May 3, 2019 | Data and Methods, Risk and resilience, Women in Science
By Junko Mochizuki, researcher with the IIASA Risk and Resilience Program
IIASA researcher Junko Mochizuki writes about her recent research in which she and other IIASA colleagues developed an indicator to help identify vulnerable countries that should be prioritized for human development and disaster risk reduction interventions.

© Yong Hian Lim | Dreamstime.com
Working as part of an interdisciplinary team at IIASA, it is not uncommon for researchers to uncover disciplinary blind spots that would otherwise have gone unnoticed. This usually leads to a conversation that goes something like, “If only we could learn from the other disciplines more often, we can create more effective theories, methods, and approaches.”
My recently published paper with Asjad Naqvi from the IIASA Advanced Systems Analysis Program titled Reflecting Risk in Development Indicators was the fruit of such an exchange. In one afternoon, our coffee conversation hypothesized various reasons as to why the disaster risk discipline continued to create one risk indicator after another while the development community remained silent on this disciplinary advancement and did not seem to be incorporating these indicators into ongoing research in their own field.
Global ambitions such as the Sustainable Development Goals (SDGs) and Sendai Framework for Disaster Risk Reduction call for disaster mainstreaming, in other words, that disaster risk be assessed and managed in combination with any development planning efforts. For various reasons, we however continue to measure development and disasters separately. We know that globally the poor are more exposed to risk and that disasters hurt development, but there was not a single effective measure that captured this interlinkage in an easy-to-grasp manner. Our aim was therefore to demonstrate how this could be done using the information on disasters and development that we already have at our disposal.
The Human Development Indicator (HDI) is a summary measure of average attainment in key dimensions of human development – education, life expectancy, and per capita income indicators – that are used to rank countries into four tiers of human development. Using the HDI as an example, Asjad and myself compiled global datasets on human development, disaster risk, and public expenditure, and developed a method to discount the HDI indicator for 131 countries globally – just as others have done to adjust for income– and gender-inequality. Discounting the HDI indicator for education, for instance, involves multiplying it by the annual economic value of the average loss in terms of education facilities, divided by the annual public expenditure on education. We did this for each dimension of the HDI.
Conceptually, the indicator development was an intriguing exercise as we and our reviewers asked interesting questions. These included questions about the non-linearity of disaster impact, especially in the health sector, such as how multiple critical lifeline failures may lead to high death tolls in the days, weeks, and even months following an initial disaster event. Other issues we examined were around possibilities for the so-called build-back-better approach, which offers an opportunity to create better societal outcomes following a disaster.
Our formulation of the proposed penalty function hardly captures these complexities, but it nevertheless provides a starting point to debate these possibilities, not just among disaster researchers, but also among others working in the development field.
For those familiar with the global analysis of disaster risk, the results of our analysis may not be surprising: disasters, unlike other development issues (such as income- and gender inequalities for which HDI have been reformulated), have a small group of countries that stand out in terms of their relative burdens. These are small island states such as Belize, Fiji, and Vanuatu, as well as highly exposed low and lower-middle income countries like Honduras, Madagascar, and the Philippines, which were identified as hotspots in terms of risk-adjustments to HDI. Simply put, this means that these countries will have to divert public and private funds to pay for response and recovery efforts in the event of disasters, where these expenses are sizeable relative to the resources they have in advancing the three dimensions of the HDI indicator. Despite their high relative risk, the latter countries also receive less external support measured in terms of per capita aid-flow.
Our study shows that global efforts to promote disaster risk reduction like the Sendai Framework should be aware of this heterogeneity and that more attention in the form of policy support and resource allocation may be needed to support groups of outliers. Finally, although the cost of most disasters that occur globally are small relative to the size of most countries’ national economies, further sub-national analysis will help identify highly vulnerable areas within countries that should be prioritized for development and disaster risk reduction interventions.
Reference:
Mochizuki J & Naqvi A (2019). Reflecting Disaster Risk in Development Indicators. Sustainability 11 (4): e996 [pure.iiasa.ac.at/15757]
Note: This article gives the views of the author, and not the position of the Nexus blog, nor of the International Institute for Applied Systems Analysis.
Mar 6, 2019 | Data and Methods, Ecosystems, Systems Analysis, Young Scientists
By Davit Stepanyan, PhD candidate and research associate at Humboldt University of Berlin, International Agricultural Trade and Development Group and 2019 IIASA Young Scientists Summer Program (YSSP) Award Finalist.
Participating in the YSSP at IIASA was the biggest boost to my scientific career and has shifted my research to a whole new level. IIASA provides a perfect research environment, especially for young researchers who are at the beginning of their career paths and helps to shape and integrate their scientific ideas and discoveries into the global research community. Being surrounded by leading scientists in the field of systems analysis who were open to discuss my ideas and who encouraged me to look at my own research from different angles was the most important push during my PhD studies. Having the work I did at IIASA recognized with an Honorable Mention in the 2019 YSSP Awards has motivated me to continue digging deeper into the world of systems analysis and to pursue new challenges.

© Davit Stepanyan
Although my background is in economics, mathematics has always been my passion. When I started my PhD studies, I decided to combine these two disciplines by taking on the challenge of developing an efficient method of quantifying uncertainties in large-scale economic simulation models, and so drastically reduce the need and cost of big data computers and data management.
The discourse on uncertainty has always been central to many fields of science from cosmology to economics. In our daily lives when making decisions we also consider uncertainty, even if subconsciously: We will often ask ourselves questions like “What if…?”, “What is the chance of…?” etc. These questions and their answers are also crucial to systems analysis since the final goal is to represent our objectives in models as close to reality as possible.
I applied for the YSSP during my third year of PhD research. I had reached the stage where I had developed the theoretical framework for my method, and it was the time to test it on well-established large-scale simulation models. The IIASA Global Biosphere Management Model (GLOBIOM), is a simulation model with global coverage: It is the perfect example of a large-scale simulation model that has faced difficulties applying burdensome uncertainty quantification techniques (e.g. Monte Carlo or quasi-Monte Carlo).
The results from GLOBIOM have been very successful; my proposed method was able to produce high-quality results using only about 4% of the computer and data storage capacities of the above-mentioned existing methods. Since my stay at IIASA, I have successfully applied my proposed method to two other large-scale simulation models. These results are in the process of becoming a scientific publication and hopefully will benefit many other users of large-scale simulation models.
Looking forward, despite computer capacities developing at high speed, in a time of ‘big data’ we can anticipate that simulation models will grow in size and scope to such an extent that more efficient methods will be required.
Note: This article gives the views of the author, and not the position of the Nexus blog, nor of the International Institute for Applied Systems Analysis.
Jan 24, 2019 | Data and Methods, Systems Analysis, Women in Science
By Sibel Eker, IIASA postdoctoral research scholar

Ceci n’est pas une pipe – This is not a pipe © Jaka Vukotič | Dreamstime.com
Quantitative models are an important part of environmental and economic research and policymaking. For instance, IIASA models such as GLOBIOM and GAINS have long assisted the European Commission in impact assessment and policy analysis2; and the energy policies in the US have long been guided by a national energy systems model (NEMS)3.
Despite such successful modelling applications, model criticisms often make the headlines. Either in scientific literature or in popular media, some critiques highlight that models are used as if they are precise predictors and that they don’t deal with uncertainties adequately4,5,6, whereas others accuse models of not accurately replicating reality7. Still more criticize models for extrapolating historical data as if it is a good estimate of the future8, and for their limited scopes that omit relevant and important processes9,10.
Validation is the modeling step employed to deal with such criticism and to ensure that a model is credible. However, validation means different things in different modelling fields, to different practitioners and to different decision makers. Some consider validity as an accurate representation of reality, based either on the processes included in the model scope or on the match between the model output and empirical data. According to others, an accurate representation is impossible; therefore, a model’s validity depends on how useful it is to understand the complexity and to test different assumptions.
Given this variety of views, we conducted a text-mining analysis on a large body of academic literature to understand the prevalent views and approaches in the model validation practice. We then complemented this analysis with an online survey among modeling practitioners. The purpose of the survey was to investigate the practitioners’ perspectives, and how it depends on background factors.
According to our results, published recently in Eker et al. (2018)1, data and prediction are the most prevalent themes in the model validation literature in all main areas of sustainability science such as energy, hydrology and ecosystems. As Figure 1 below shows, the largest fraction of practitioners (41%) think that a match between the past data and model output is a strong indicator of a model’s predictive power (Question 3). Around one third of the respondents disagree that a model is valid if it replicates the past since multiple models can achieve this, while another one third agree (Question 4). A large majority (69%) disagrees with Question 5, that models cannot provide accurate projects, implying that they support using models for prediction purposes. Overall, there is no strong consensus among the practitioners about the role of historical data in model validation. Still, objections to relying on data-oriented validation have not been widely reflected in practice.
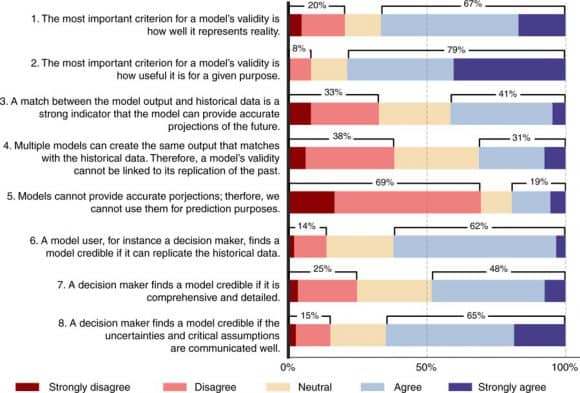
Figure 1: Survey responses to the key issues in model validation. Source: Eker et al. (2018)
According to most practitioners who participated in the survey, decision-makers find a model credible if it replicates the historical data (Question 6), and if the assumptions and uncertainties are communicated clearly (Question 8). Therefore, practitioners think that decision makers demand that models match historical data. They also acknowledge the calls for a clear communication of uncertainties and assumptions, which is increasingly considered as best-practice in modeling.
One intriguing finding is that the acknowledgement of uncertainties and assumptions depends on experience level. The practitioners with a very low experience level (0-2 years) or with very long experience (more than 10 years) tend to agree more with the importance of clarifying uncertainties and assumptions. Could it be because a longer engagement in modeling and a longer interaction with decision makers help to acknowledge the necessity of communicating uncertainties and assumptions? Would inexperienced modelers favor uncertainty communication due to their fresh training on the best-practice and their understanding of the methods to deal with uncertainty? Would the employment conditions of modelers play a role in this finding?
As a modeler by myself, I am surprised by the variety of views on validation and their differences from my prior view. With such findings and questions raised, I think this paper can provide model developers and users with reflections on and insights into their practice. It can also facilitate communication in the interface between modelling and decision-making, so that the two parties can elaborate on what makes their models valid and how it can contribute to decision-making.
Model validation is a heated topic that would inevitably stay discordant. Still, one consensus to reach is that a model is a representation of reality, not the reality itself, just like the disclaimer of René Magritte that his perfectly curved and brightly polished pipe is not a pipe.
References
- Eker S, Rovenskaya E, Obersteiner M, Langan S. Practice and perspectives in the validation of resource management models. Nature Communications 2018, 9(1): 5359. DOI: 10.1038/s41467-018-07811-9 [pure.iiasa.ac.at/id/eprint/15646/]
- EC. Modelling tools for EU analysis. 2019 [cited 16-01-2019]Available from: https://ec.europa.eu/clima/policies/strategies/analysis/models_en
- EIA. ANNUAL ENERGY OUTLOOK 2018: US Energy Information Administration; 2018. https://www.eia.gov/outlooks/aeo/info_nems_archive.php
- The Economist. In Plato’s cave. The Economist 2009 [cited]Available from: http://www.economist.com/node/12957753#print
- The Economist. Number-crunchers crunched: The uses and abuses of mathematical models. The Economist. 2010. http://www.economist.com/node/15474075
- Stirling A. Keep it complex. Nature 2010, 468(7327): 1029-1031. https://doi.org/10.1038/4681029a
- Nuccitelli D. Climate scientists just debunked deniers’ favorite argument. The Guardian. 2017. https://www.theguardian.com/environment/climate-consensus-97-per-cent/2017/jun/28/climate-scientists-just-debunked-deniers-favorite-argument
- Anscombe N. Models guiding climate policy are ‘dangerously optimistic’. The Guardian 2011 [cited]Available from: https://www.theguardian.com/environment/2011/feb/24/models-climate-policy-optimistic
- Jogalekar A. Climate change models fail to accurately simulate droughts. Scientific American 2013 [cited]Available from: https://blogs.scientificamerican.com/the-curious-wavefunction/climate-change-models-fail-to-accurately-simulate-droughts/
- Kruger T, Geden O, Rayner S. Abandon hype in climate models. The Guardian. 2016. https://www.theguardian.com/science/political-science/2016/apr/26/abandon-hype-in-climate-models
Aug 27, 2018 | Data and Methods, Ecosystems, Postdoc
by Melina Filzinger, IIASA Science Communication Fellow
Ecosystems worldwide are changed by the influence of humans, often leading to the extinction of species, for example due to climate change or loss of natural habitat. But it doesn’t stop there: as the different species in an ecosystem feed on each other and are thereby interconnected, the loss of one species might lead to the extinction of others, which can even destabilize the whole system. “In nature, everything is connected in a complex way, so at first glance you cannot be sure what will happen if one species disappears from an ecosystem,” says IIASA postdoc Mateusz Iskrzyński.
This is why the IIASA Evolution and Ecology (EEP) and Advanced Systems Analysis (ASA) programs are employing food-web modeling to find out which properties make ecosystems particularly vulnerable to species extinction. Food webs are stylized networks that represent the feeding relationships in an ecosystem. Their nodes are given by species or groups of species, and their links indicate how biomass cycles through the system by means of eating and being eaten. “This type of network analysis has a surprising power to uncover general patterns in complex relationships,” explains Iskrzyński.
Every one of these food webs is the result of years of intense research that involves both data collection to assess the abundance of species in an area, and reconstructing the links of the network from existing knowledge about the diets of different species. The largest of the currently available webs contain about 100 nodes and 1,000 weighted links. Here, “weighted” means that each link is characterized by the biomass flow between the nodes it connects.
Usually, food webs are published and considered individually, but recently efforts have been stepped up to collect them and analyze them together. Now, the ASA and EEP programs have collected 220 food webs from all over the world in the largest database assembled so far. This involved unifying the parametrization of the data and reconstructing missing links.
The researchers use this database to find out how different ecosystems react to the ongoing human-made species loss, and which ones are most at risk. This is done by removing a single node from a food web, which corresponds to the extinction of one group of species, and modeling how the populations of the remaining species change as a result. The main question is how these changes in the food web depend on its structural properties, like its size and the degree of connectedness between the nodes.
From the preliminary results obtained so far, it seems that small and highly connected food webs are particularly vulnerable to the indirect effects of species extinction. This means that in these webs the extinction of one species is especially likely to lead to large disruptive change affecting many other organisms. “Understanding the factors that cause such high vulnerability is crucial for the sustainable management and conservation of ecosystems,” says Iskrzyński. He hopes that this research will encourage more, and more precise, empirical ecosystems studies, as reliable data is still missing from many places in the world.
As a next step, the scientists in the two programs are planning to understand which factors determine the impact that the disappearance of a particular group of organisms has. They are going to make the software they use for their simulations publicly available, together with the database they developed.
Note: This article gives the views of the author, and not the position of the Nexus blog, nor of the International Institute for Applied Systems Analysis.
Aug 7, 2018 | Data and Methods, Risk and resilience, Women in Science, Young Scientists
by Melina Filzinger, IIASA Science Communication Fellow
Having just finished tenth grade, Lillian Petersen from New Mexico, USA is currently spending the summer at IIASA, working with researchers from both the Ecosystems Services and Management (ESM), and Risk and Resilience (RISK) programs on developing risk models for all African countries.
At a talk Petersen gave at the Los Alamos Nature Center/Pajarito Environmental Education Center, her method for predicting food shortages in Africa from satellite images caught the attention of Molly Jahn from the University of Wisconsin-Madison. Jahn, who is collaborating with the ESM and RISK programs at IIASA, was so impressed with Petersen’s work that she added her to her research group and connected her to IIASA researchers for a joint project.
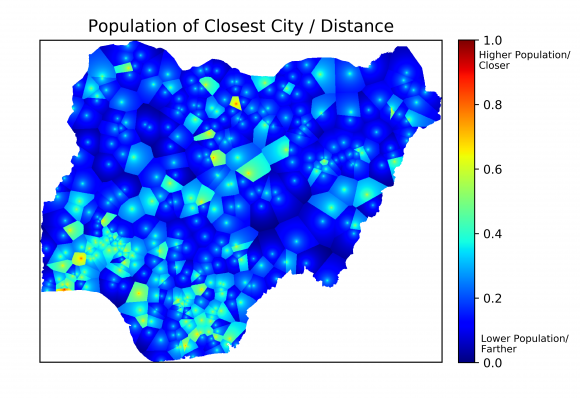
One of the indicators used to estimate poverty in Nigeria. © Lillian Petersen | IIASA
Knowing which areas are at risk for disasters like conflict, disease outbreak, or famine is often an important first step for preventing their occurrence. In developed countries, there is already a lot of work being done to estimate these risks. In developing countries, however, a lack of data often hinders risk modeling, even though these countries are often most at risk for disasters.
Many humanitarian crises, like famine, are closely connected to poverty. However, high resolution poverty estimates are only available for a few African countries. This is why Petersen and her colleagues are developing methods to obtain those poverty estimates for all of Africa using freely available data, like maps showing major roads and cities, as well as high-resolution satellite images. Information about poverty in a certain region can be extracted from this data by considering several indicators. For example, areas that are close to major roads or cities, or those that have a large amount of lighting at night, meaning that electricity is available, are usually less poor than those without these features. The researchers are also analyzing the trading potential with neighboring countries, the land cover type, and distance to major shipping routes, such as waterways.
As no single one of these indicators can perfectly predict poverty, the scientists combine them. They “train” their model using the countries for which poverty data exists: A comparison of the model’s output and the real data helps to reveal which combination of indicators gives a reliable estimate of poverty. Following this, they plan to apply that knowledge in order to accurately predict poverty with high spatial resolution over the entire African continent.
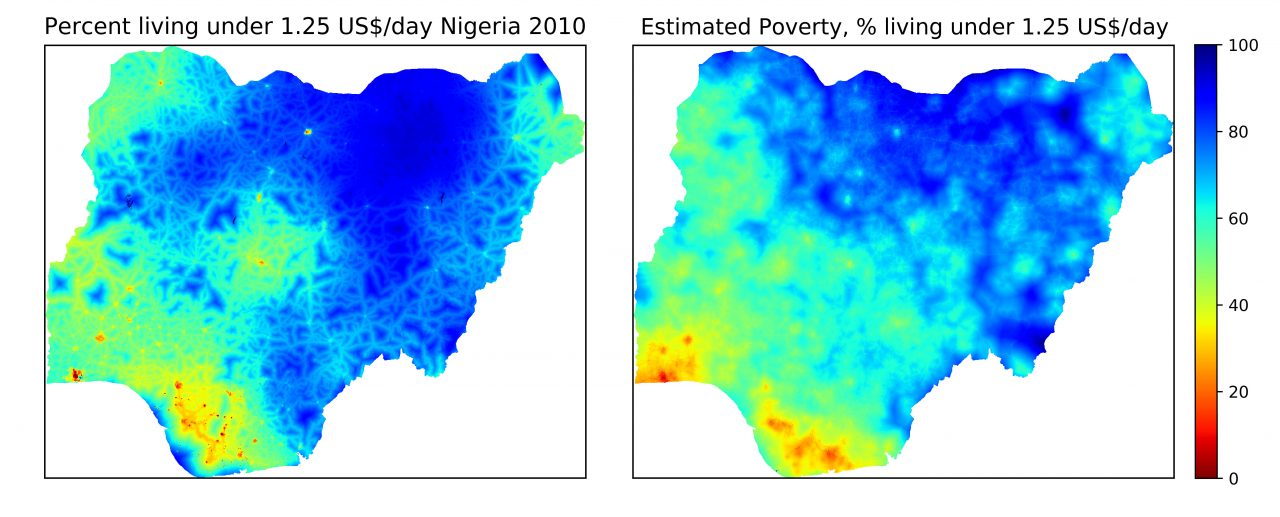
Poverty data for Nigeria in 2010 (left) and poverty estimates based on five different indicators (right). © Lillian Petersen | IIASA
Once these estimates exist, Petersen and her colleagues will apply risk models to find out which areas are particularly vulnerable to disease outbreaks, famine, and conflicts. “I hope that this research will inform policymakers about which populations are most at risk for humanitarian crises, so that they can target these populations systematically in aid programs,” says Petersen, adding that preventing a disaster is generally cheaper than dealing with its aftermath.
The skills Petersen is using for her research are largely self-taught. After learning computer programming with the help of a book when she was in fifth grade, Petersen conducted her first research project on the effect of El Nino on the winter weather in the US when she was in seventh grade. “It was a small project, but I was pretty excited to obtain scientific results from raw data,” she says. After this first success she has been building up her skills every year, by competing at science fairs across the US with her research projects.
Her internship at IIASA gives Petersen access to the resources she needs to take her research to the next level. “Getting feedback from some of the top scientists in the field here at IIASA is definitely improving my work,’’ she says. Petersen is hoping to publish a paper about her project next year, and wants to major in applied mathematics after she finishes high school.
Note: This article gives the views of the author, and not the position of the Nexus blog, nor of the International Institute for Applied Systems Analysis.
Jul 31, 2018 | Data and Methods, Young Scientists
by Melina Filzinger, IIASA Science Communication Fellow
Strategic board games are staple entertainment for families all over the world, but what many do not know is that games can also be a valuable research tool. As her project for the Young Scientists Summer Program (YSSP), Sara Turner is piloting an experiment that uses a game called the Forest Game, developed by IIASA and the Centre for Systems Solutions, to find out how policy decisions are made and how they change over time. “Games let you abstract from the specifics of a real-world case, but are more human-centric than, for example, computer simulations,” says Turner.
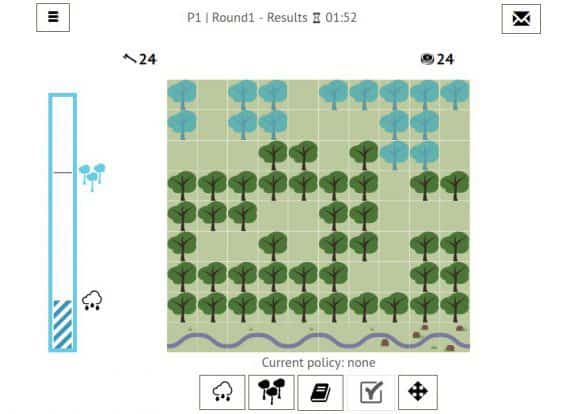
Interface of the Forest Game, © IIASA
In the Forest Game, a group of five to ten players is asked to make decisions about the management of a forest together. Harvesting trees yields returns for the players, while harvesting too many of them might destroy the forest or increase the risk of flooding. There are some uncertainties in the game – for example, the players do not know exactly how resilient the forest is. The goal of the research project is to run multiple iterations of the game with different players and starting conditions, and trace how group discussions and the resulting decisions change over time. This helps to generate hypotheses about the ways in which individuals interact to generate policy outcomes. Each game takes about an hour to play.
Even though the Forest Game deals with forest management, this is only one example of a broader class of decision-making dilemma: when a resource is limited, and it is costly to prevent access, people will tend to over-exploit the resource. This in turn leads to a wide range of problems, from over-fishing to air pollution. Although games cannot capture the complexity of real situations, they can still help us understand the core dynamics of the problem and develop ideas and strategies that are relevant to solving it. “The game is not designed to be directly applicable to real life, but it helps to come up with hypotheses that you can then compare to real-life cases,” explains Turner.
Questions about the sustainable management of resources have been studied for decades, but not a lot is known about the role values play in shaping group decision making and the stability of the implemented policies. To investigate this, each participant is asked to fill out a short ten-minute survey assessing their core values and beliefs, after which they are put into a group with people who either have a very similar or very different worldview from them. “It is really interesting to put a person in a decision-making context with other people and get some insight into how they work through that problem,” says Turner.

© Sara Turner
For example, if you are a person that strongly values equality, in the game you might be likely to argue in favor of a policy where all participants obtain the same amount of returns, regardless of the number of trees the individual player chooses to harvest. If many players in the group share your belief, that policy might be more likely to be implemented than in a very diverse group.
Another interesting question whenever you run a game for research purposes is, “Who are the right players?” Some games are targeted at real-world policymakers, but often games can also be educational for the broader public. ‘’People learn a lot during games, because of the way that information is processed and experienced,” says Turner. That is why many participants, although they might not see a connection between the game and their life at first, find themselves relying on the insights they gained while playing when faced with similar situations in the future.
In this case, the goal is to study group decision-making processes in general, so the details of who is playing are not particularly important. However, to obtain groups of players with heterogeneous worldviews, a high degree of diversity is preferable.
While the game has previously mainly been played by YSSP participants and students of the University of Vienna, Turner is currently trying to recruit a more diverse set of players from both within and outside of IIASA. “It would be ideal to have a pool of participants who come from a wide variety of educational and cultural backgrounds,” she says.
If you are interested in participating in the Forest Game, you can write Sara Turner an e-mail to [email protected].
Note: This article gives the views of the authors, and not the position of the Nexus blog, nor of the International Institute for Applied Systems Analysis.
You must be logged in to post a comment.