Nov 4, 2021 | Climate Change, Data and Methods, Risk and resilience
By Asjad Naqvi and Irene Monasterolo from the IIASA Advancing Systems Analysis Program
Asjad Naqvi and Irene Monasterolo discuss a framework they developed to assess how natural disasters cascade across socioeconomic systems.
© Bang Oland | Dreamstime.com
The 2021 Nobel Prize for Physics, was awarded to the topic of “complex systems”, highlighting the need for a better understanding of non-linear interactions that take place within natural and socioeconomic systems. In our paper titled “Assessing the cascading impacts of natural disasters in a multi-layer behavioral network framework”, recently published in Nature Scientific Reports, we highlight one such application of complex systems.
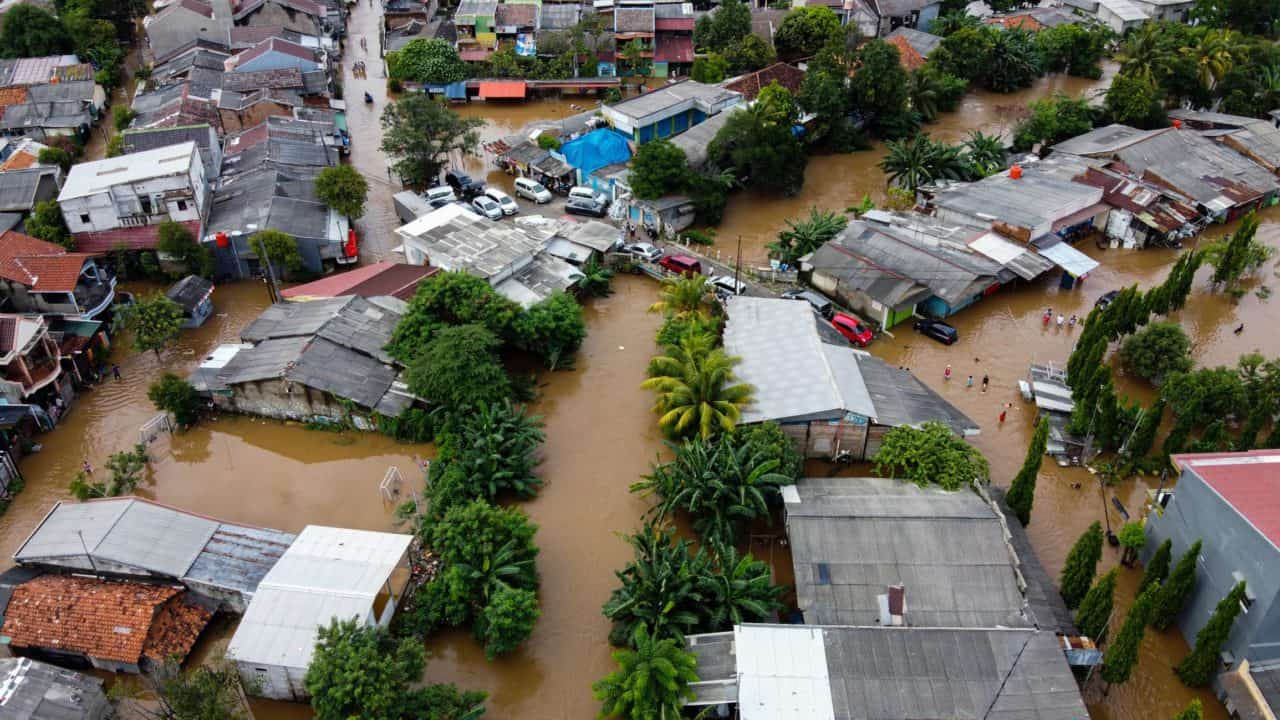
In this paper, we develop a framework for assessing how natural disasters, for example, earthquakes and floods, cascade across socioeconomic systems. We propose that in order to understand post-shock outcomes, an economic structure can be broken down into multiple network layers. Multi-layer networks are a relatively new methodology, mostly stemming from applications in finance after the 2008 financial crisis, which starts with the premise that nodes, or locations in our case, interact with other nodes through various network layers. For example, in our study, we highlight the role of a supply-side production layer, where the flows are trade networks, and a demand-side household layer, which provides labor, and the flows are migration flows.
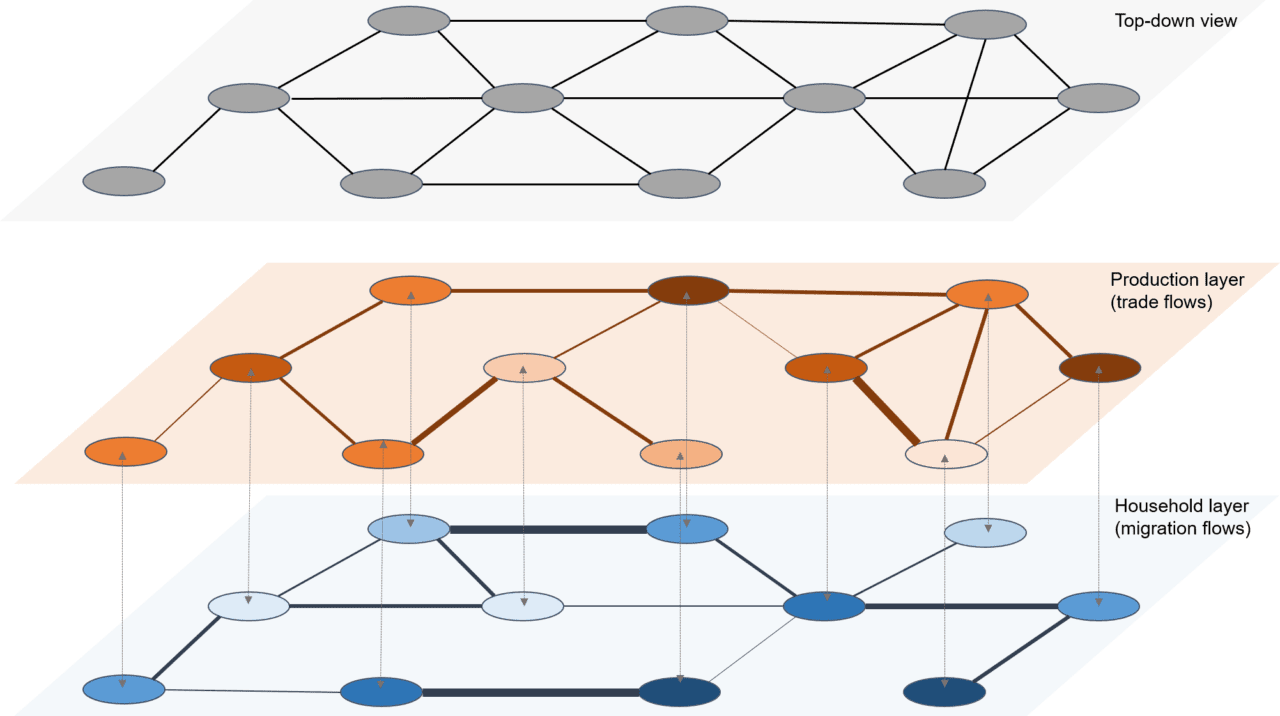
Figure 1: A multi-layer network structure
In this two-layer structure, the nodes interact, not only within, but across layers as well, forming a co-evolving demand and supply structure that feeds back across each other. The interactions are derived from economic literature, which also allow us to integrate behavioral responses to distress scenarios. This, for example, includes household coping mechanisms for consumption smoothing, and firms’ response to market signals by reshuffling supply chains. The price signals drive flows, which allows the whole system to stabilize.
We applied the framework to an agriculture-dependent economy, typically found in low-income disaster-prone regions. We simulated various flood-like shock scenarios that reduce food output in one part of the network. We then tracked how this shock spreads to the rest of the network over space and time.
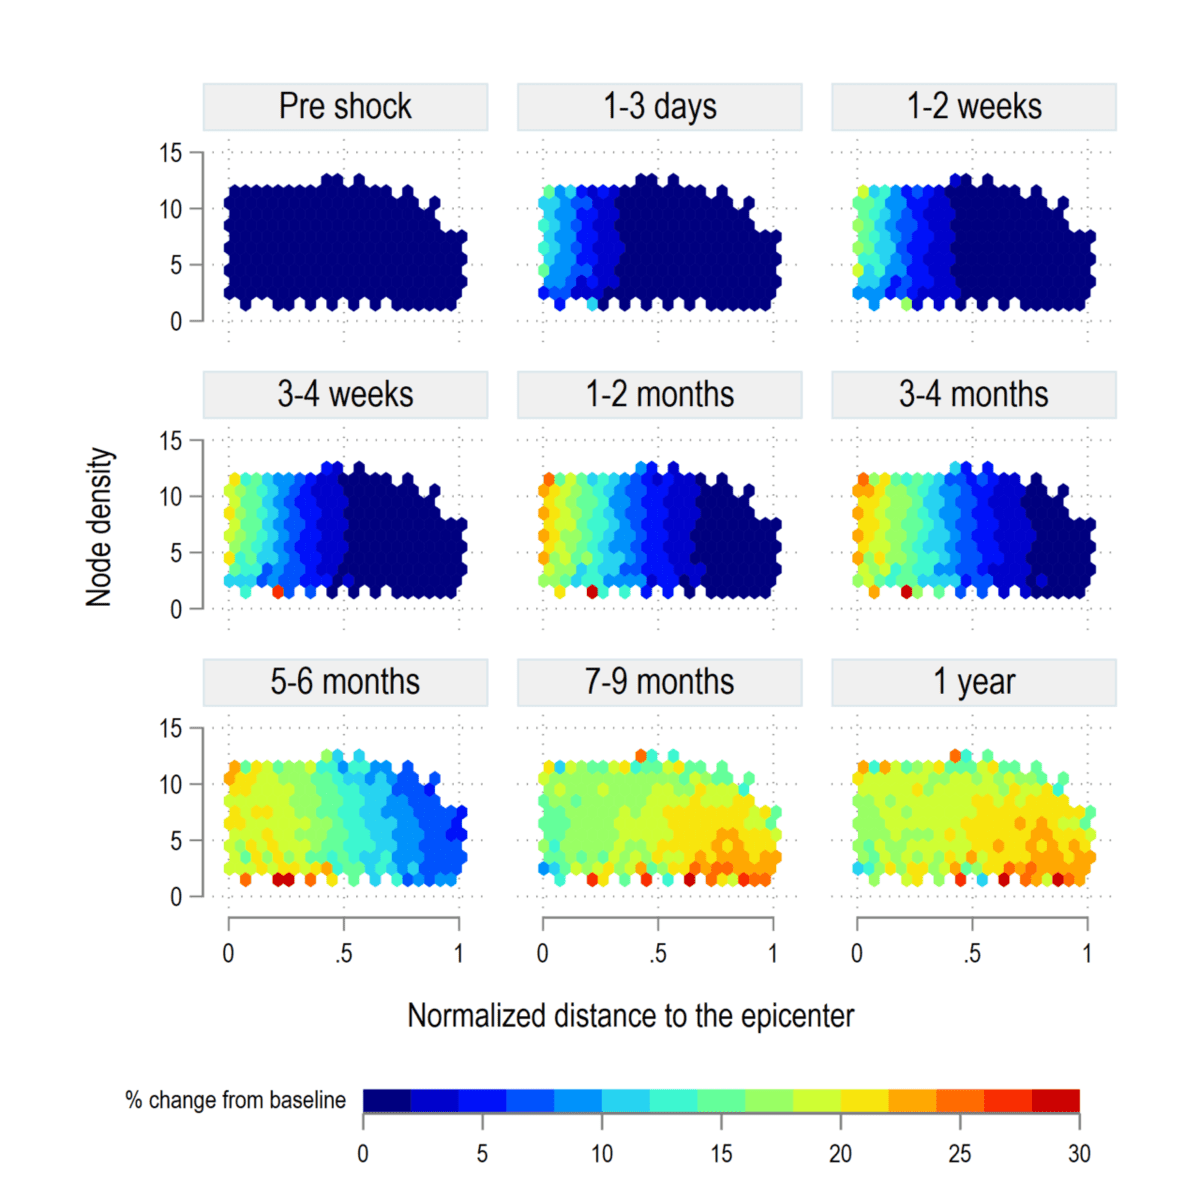
Figure 2: Evolution of vulnerability over time
Our results show that the transition phase is cyclical and depends on the network size, distance from the epi-center of the shock, and node density. Within this cyclical adjustment new vulnerabilities in terms of “food insecurity” can be created. Then, we introduce a new measure, the Vulnerability Rank, or VRank, to synthesize multi-layer risks into a single index.
Our framework can help inform and design policies, aimed at building resilience to disasters by accounting for direct and indirect cascading impacts. This is especially crucial for regions where the fiscal space is limited and timing of response is critical.
Reference:
Naqvi, A. & Monasterolo, I. (2021). Assessing the cascading impacts of natural disasters in a multi-layer behavioral network framework. Scientific Reports 11 e20146. [pure.iiasa.ac.at/17496]
Note: This article gives the views of the author, and not the position of the Nexus blog, nor of the International Institute for Applied Systems Analysis.
Sep 23, 2021 | Brazil, China, Data and Methods, Energy & Climate, India, Russia, Science and Policy, Young Scientists
By Neema Tavakolian, 2021 IIASA Science Communication Fellow
Ever wonder why countries can never agree on issues related to climate change and the environment? Young Scientists Summer Program (YSSP) participant Felix Schenuit dives into the politics and challenges surrounding carbon dioxide removal in international climate negotiations.
The Paris Agreement has been lauded as a landmark effort to address climate change and has been signed by nearly every country in the world. The agreement sets out ambitious goals such as reaching temperature targets, setting net-zero carbon targets, and providing financial, technical, and capacity building support to those countries that need it.
One topic that has been receiving increasing attention since the adoption of the agreement is carbon dioxide removal, or CDR – which comprises man made processes involving the direct removal of carbon dioxide from the atmosphere and sequestering it somewhere else, usually underground or under the sea floor. Since it was first proposed, CDR has been discussed on many platforms including critical comments, journals, and studies. 2021 IIASA YSSP participant Felix Schenuit studies how the debate, which has been largely ignored by policymakers until the Paris Agreement, is evolving, and how CDR is being taken up in climate policymaking.

© Felix Schenuit
Felix Schenuit comes from a background of political science and public policy. It was during his employment at the German Institute for International and Security Affairs (SWP) that he became fascinated by CDR and the political debates surrounding the impacts it can have on the fight against climate change. This is when he decided to combine his newfound interest with his background and experiences in international relations and public policy to pursue a PhD at the University of Hamburg comparing CDR policymaking in different countries and the role scientific knowledge has on its implementation.
Building on a previous study comparing CDR governance among nine Organisation for Economic Co-operation and Development (OECD) cases, Schenuit is now focusing on the role of scientific knowledge surrounding CDR in Brazil, China, India, and Russia. These countries account for a significant portion of the world’s greenhouse gas emissions due to their rapid industrialization and expanding economies. China and India are especially significant due to their great influence in ongoing international climate negotiations regarding the Paris Agreement.
Schenuit uses integrated assessment models to gather information and data about the role of CDR in different countries in decarbonization pathways.
“These models help us to understand what amount of CDR we are likely to need to achieve Paris Agreement targets. Case studies on specific countries are an important second step to explore facts on the ground about different policy initiatives, emerging CDR facilities, and efforts in each region. We reach out to country experts and build interdisciplinary bridges to investigate how CDR is addressed politically, what amounts are available and politically feasible, as well as relevant knowledge gaps,” he explains.
One of the biggest challenges remaining for CDR is limited knowledge about different CDR methods, both in science and policy circles. There are many ways one can remove carbon dioxide from the atmosphere, ranging from afforestation, to soil carbon sequestration, ocean fertilization, direct CO2 capture from the air, and the use of biochar, among others.
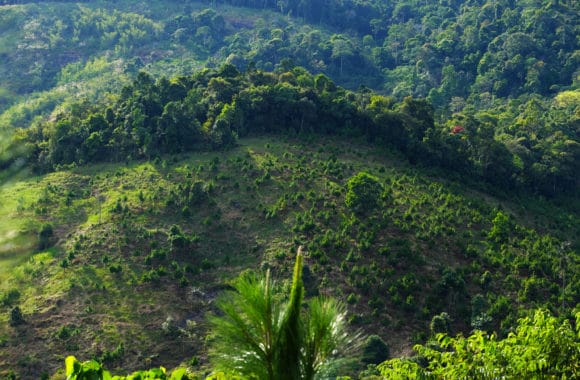
Reforestation on hill at Bao Loc mountain pass, Vietnam © Hoxuanhuong | Dreamstime.com
“When it comes to methods, many policymakers are unaware of the portfolio of available methods. Each method has different tradeoffs, both environmentally and politically. For example, in Germany, carbon capture and storage (CCS) is very contested and most policymakers are hesitant to even address CDR. Thus, in Germany one may need a different set of methods than in the UK, for example, where CCS-based CDR methods are pursued proactively,” Schenuit says.
Many predict that the role of international politics in CDR governance under the Paris Agreement is going to be difficult and tricky to navigate. Schenuit argues that it is still a bit too early in the debate for predictions as policymakers have only recently been directly addressing CDR. He does however agree that there is already strong evidence of politics at play and alliances are forming.
The study on Brazil, China, India, and Russia will yield fascinating results, as it will give us an idea about future disputes and questions regarding the carbon in our atmosphere. Questions like where we will be removing carbon and who is going to pay for it. One thing is for certain, however. Time is running out to meet the targets of the Paris Agreement, and international cooperation is desperately needed.
Note: This article gives the views of the author, and not the position of the Nexus blog, nor of the International Institute for Applied Systems Analysis.
Feb 16, 2021 | Communication, Data and Methods, IIASA Network
By Luke Kirwan, IIASA Repository and Open Access Manager
IIASA Repository and Open Access Manager Luke Kirwan explains the ins-and-outs of the Plan S policy towards full and immediate Open Access publishing.
With Plan S, which has been implemented from 1 January 2021, new Open Access requirements come into force for project participants, which are intended to accelerate the transformation to complete and immediate Open Access. This has implications for researchers obtaining funding from funders supporting Plan S, such as the Austrian Science Fund (FWF) or Formas (a Swedish Research Council for Sustainable Development).

What exactly is Plan S?
Plan S is an initiative that aims to promote making research immediately open access without embargo periods or restrictions. It requires that, from 2021, scientific publications that result from research funded by public grants must be published in compliant Open Access journals or platforms. A number of national and international research bodies, including the FWF and the European Research Council (ERC), are working jointly on the implementation of Plan S and the promotion of open access research publication. A list of these funding bodies can be found here and more detailed information on the implementation of Plan S is available here.
 What you need to know
Starting from 1 January 2021, publications derived from research funded by Plan S research organizations must be made openly accessible immediately upon publication without any embargo period. This applies only to projects submitted after 1 January 2021. Furthermore, this material must be made available under a Creative Commons Attribution license (CC-BY). In some instances, a more restrictive license can be applied, but this must be discussed with the funding body.
 Further guidelines are currently being developed for publications that are not journal articles such as books and edited volumes. From 2021 onwards, it is important to closely check the requirements of research funders to ensure that projects are compliant with any open access requirements they may have.
Papers published under Plan S funding has to include an appropriate acknowledgement. In the case of FWF funded research, it must for example follow the following format:
‘This research was funded in whole, or in part, by the Austrian Science Fund (FWF) [Grant number]. For the purpose of open access, the author has applied a CC BY public copyright license to any Author Accepted Manuscript version arising from this submission.’
Authors of papers published under Plan S funding will retain the copyright of their work, and will be providing journals with a license to publish their material rather than fully transferring copyright to them. Publishers that require a license to publish must allow the authors to make either the published version, or the accepted version, immediately available under an open license. No embargo period is permitted.
Routes to compliance
- Publish in an open access journal
- Make the accepted manuscript immediately available in an open access repository (like PURE) under a CC-BY license
- Publish in a subscription journal where IIASA has an open access agreement (For a list of IIASA’s current agreements please see here)
COAlition S has provided a journal checker tool so that you can check a journals compliance with the Plan S requirements.

The FWF’s statement and guidelines for Plan S can be found here. The operation and success of Plan S will be reviewed by the end of 2024. For any further information or assistance, please contact the library.
Related links:
Science family of journals announces change to open-access policy (Jan 2021)
Nature journals reveal terms of landmark open-access option (NOV 2020)
Plan S toolkit (coalition S website)
Note: This article gives the views of the author, and not the position of the Nexus blog, nor of the International Institute for Applied Systems Analysis.
Sep 23, 2020 | Alumni, Data and Methods, Environment, IIASA Network
By Victor Maus, alumnus of the IIASA Ecosystems Services and Management Program and researcher at the Vienna University of Economics and Business
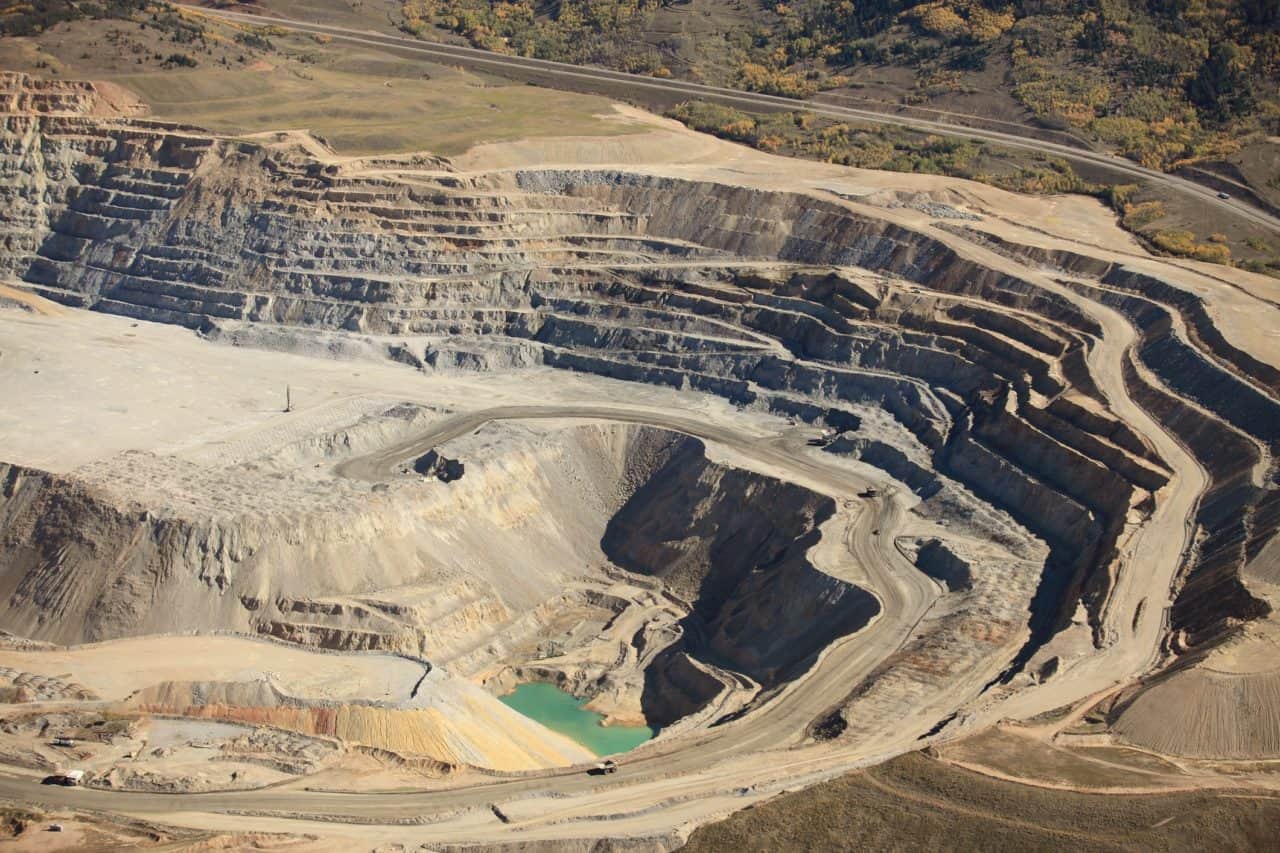
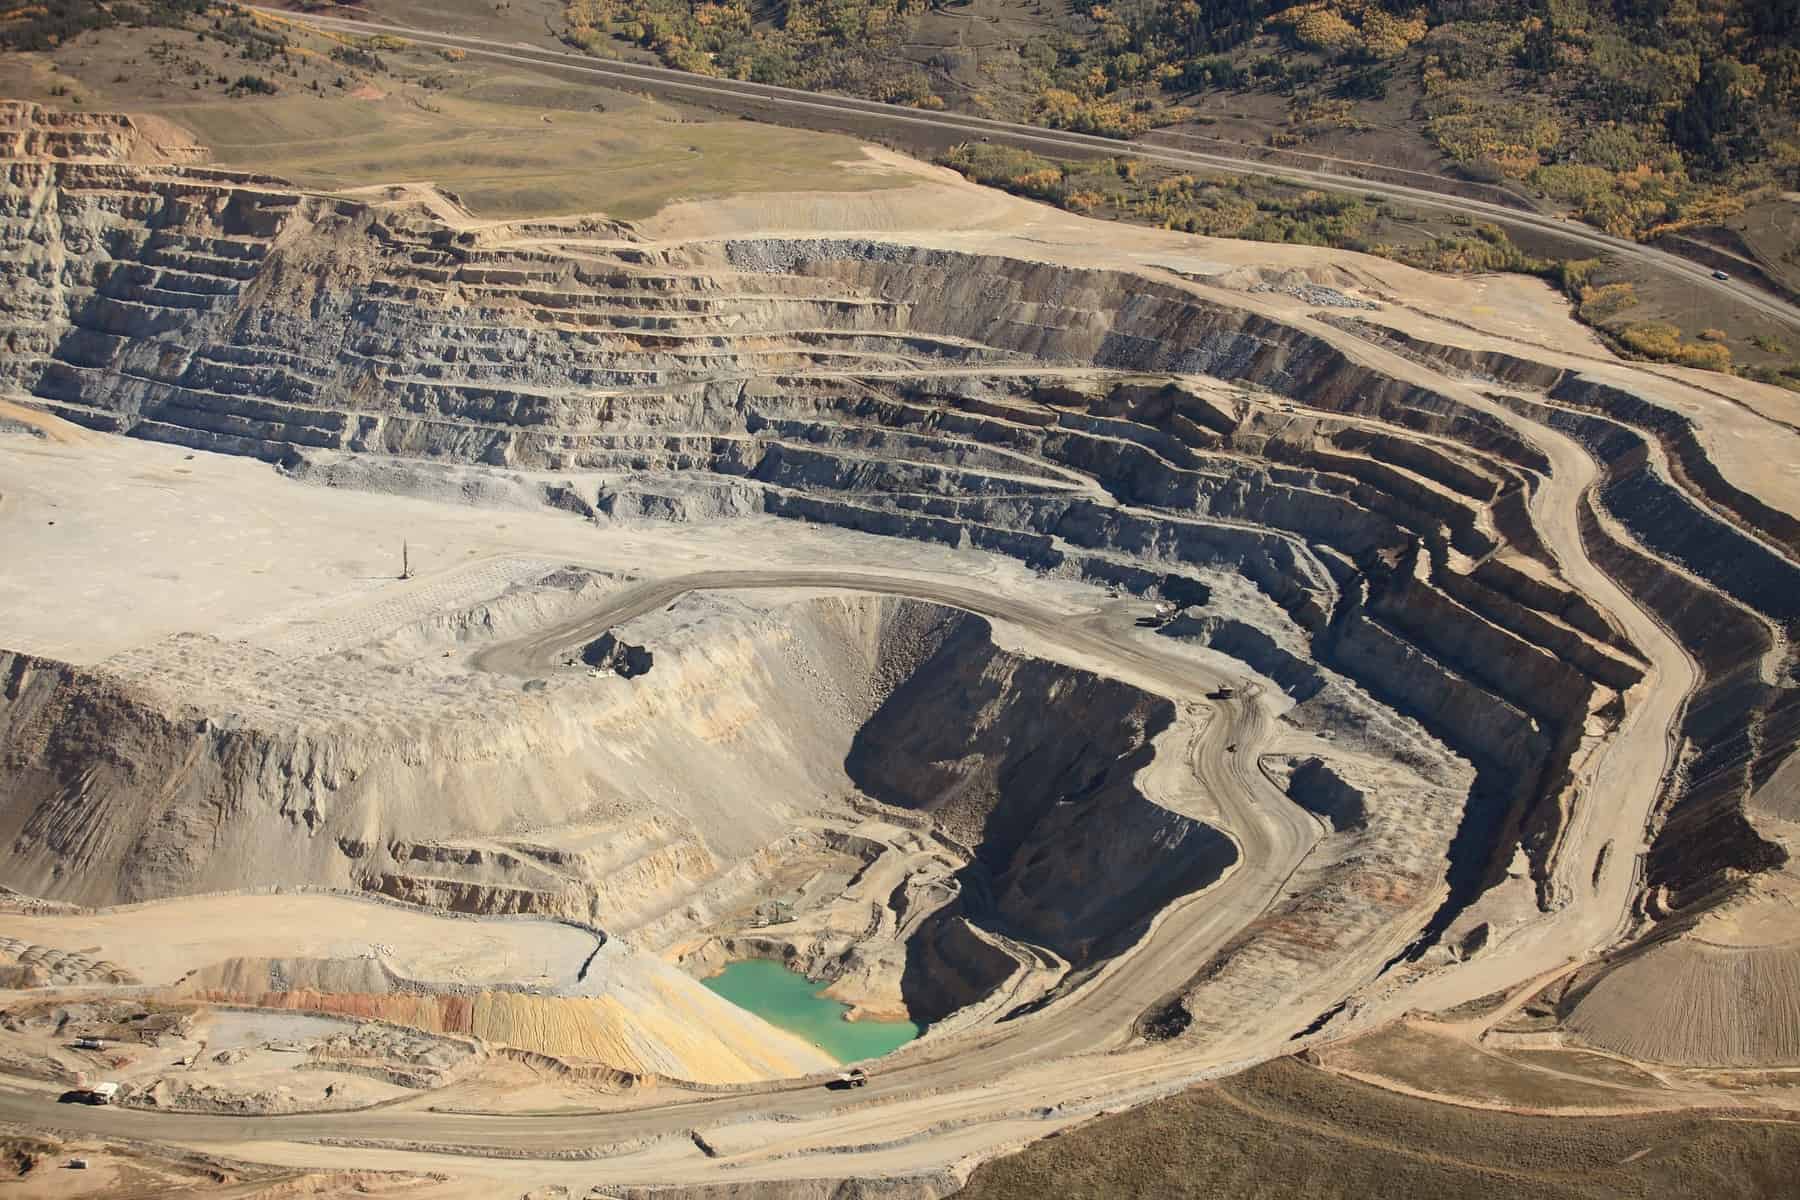
The mining of coal, metals, and other minerals causes loss of natural habitats across the entire globe. However, available data is insufficient to measure the extent of these impacts. IIASA alumnus Victor Maus and his colleagues mapped more than 57,000 km² of mining areas over the whole world using satellite images.
© Pix569 | Dreamstime.com
Our modern lifestyles and consumption patterns cause environmental and social impacts geographically displaced in production sites thousands of kilometres away from where the raw materials are extracted. Complex supply chains connecting mineral mining regions to consumers often obscure these impacts. Our team at the Vienna University of Economics and Business is investigating these connections and associated impacts on a global-scale www.fineprint.global.
However, some mining impacts are not well documented across the globe, for example, where and how much area is used to extract metals, coal, and other essential minerals are unknown. This information is necessary to assess the environmental implications, such as forest and biodiversity loss associated with mining activities. To cover this data gap, we analyzed the satellite images of more than 6,000 known mining regions all around the world.
Visually identifying such a large number of mines in these images is not an easy task. Imagine you are flying and watching from the window of a plane, how many objects on the Earth’s surface can you identify and how fast? Using satellite images, we searched and mapped mines over the whole globe. It was a very time-consuming and exhausting task, but we also learned a lot about what is happening on the ground. Besides, it was very interesting to virtually visit a vast range of mining places across the globe and realize the large variety of ecosystems that are affected by our increasing demand for nature’s resources.
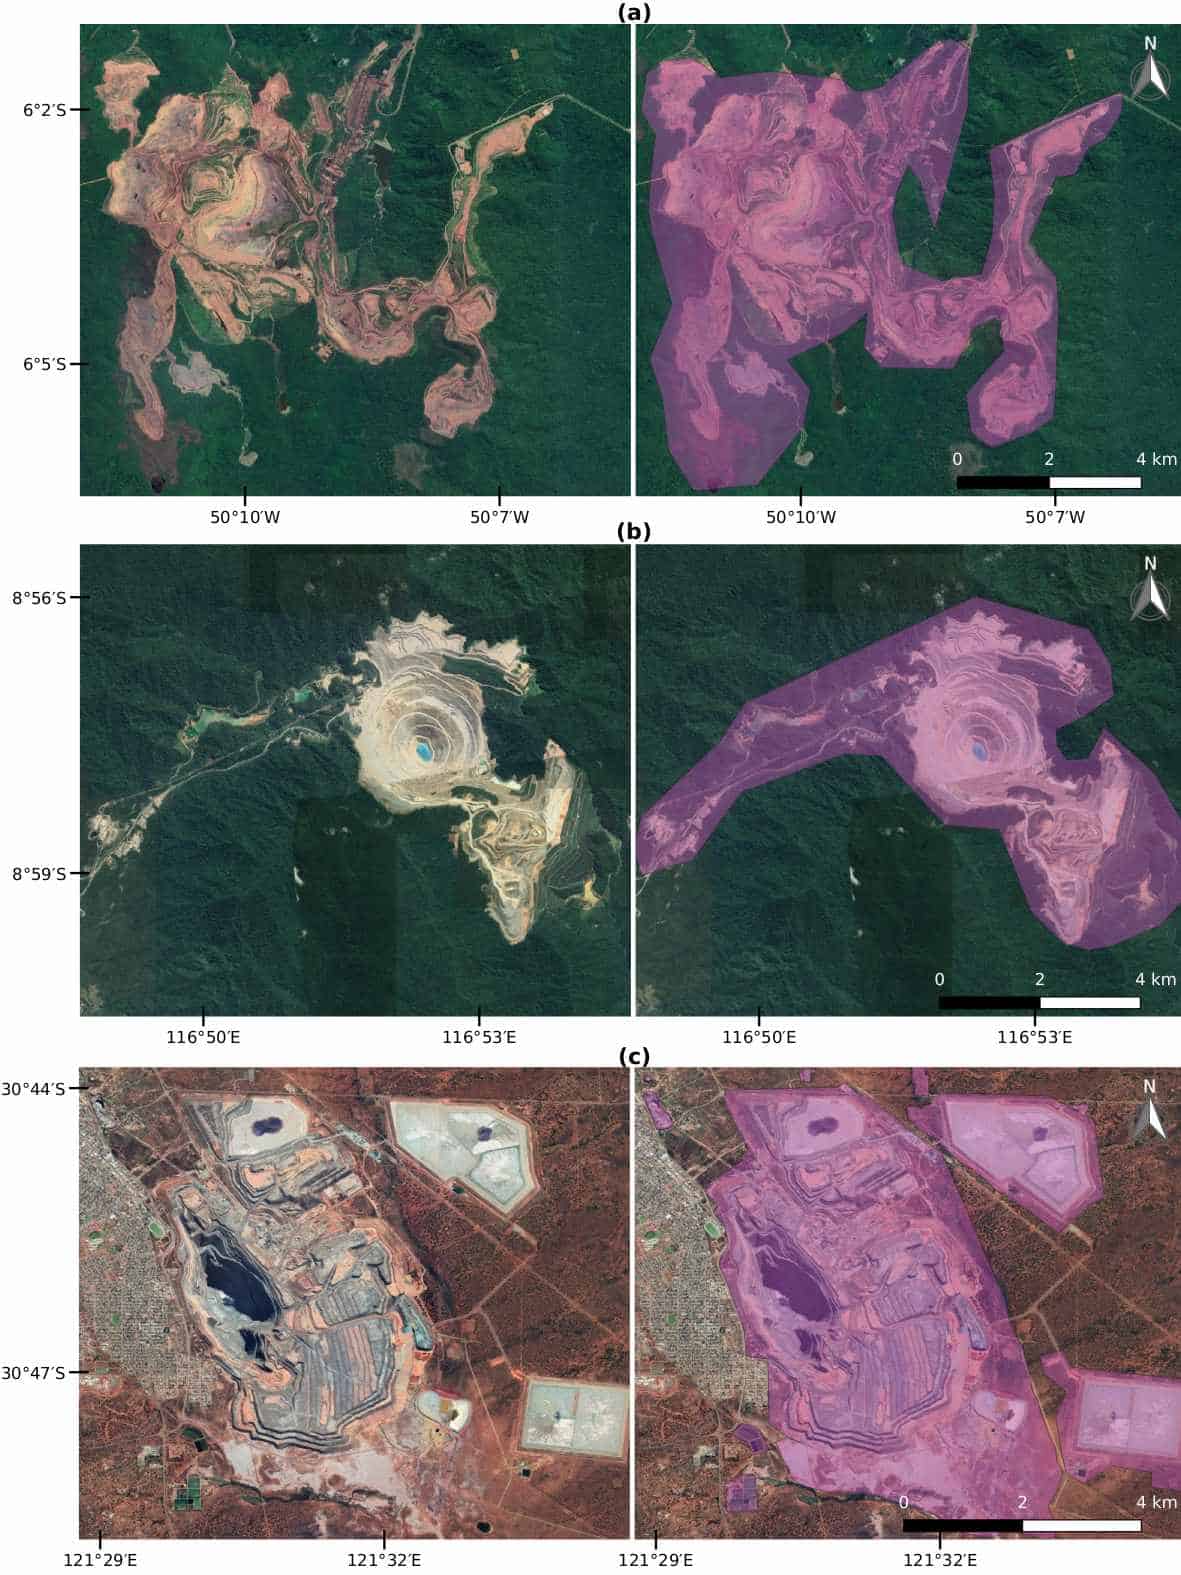
The result of our adventure is a global data set covering more than 21,000 mapped areas adding up to around 57,000 km² (that is about the size of Croatia or Togo). These mapped areas cover open cuts, tailings dams, piles of rocks, buildings, and other infrastructures related to the mining activities — some of them extending to almost 10 km (see figure below). We also learned that around 50 % of the mapped mining area is concentrated in only five countries, China, Australia, the United States, Russia, and Chile.

Examples of mines viewed from Google Satellite images. (a) Caraj\'{a}s iron ore mine in Brazil, (b) Batu Hijau copper-gold mine in Indonesia, and (c) Super Pit gold mine in Australia. In purple is the data collected for these mines (Figure source: www.nature.com/articles/s41597-020-00624-w).
Using these data, we can improve the calculation of environmental indicators of global mineral extraction and thus support the development of less harmful ways to extract natural resources. Further, linking these impacts to supply chains can help to answer questions related to our consumption of goods. For example, which impacts the extraction of minerals used in our smartphones cases and where on the planet they occur? We hope that many others will use the mining areas data for their own research and applications. Therefore, the data is fully open to everyone. You can explore the global mining areas using our visualization tool at www.fineprint.global/viewer or you can download the full data set from doi.pangaea.de/10.1594/PANGAEA.910894. The complete description of the data and methods is in our paper available from www.nature.com/articles/s41597-020-00624-w.
This blog post first appeared on the Springer Nature “Behind the paper” website. Read the original post here.
Note: This article gives the views of the authors, and not the position of the Nexus blog, nor of the International Institute for Applied Systems Analysis.
Sep 18, 2020 | Data and Methods, Science and Policy, Systems Analysis
By Daniel Huppmann, research scholar in the IIASA Energy Program
Daniel Huppmann sheds light on how open-source scientific software and FAIR data can bring us one step closer to a community of open science.

© VectorMine | Dreamstime.com
Over the past decade, the open-source movement (e.g., the Free Software Foundation (FSF) and the Open Source Initiative (OSI)) has had a tremendous impact on the modeling of energy systems and climate change mitigation policies. It is now widely expected – in particular by and of early-career researchers – that data, software code, and tools supporting scientific analysis are published for transparency and reproducibility. Many journals actually require that authors make the underlying data available in line with the FAIR principles – this acronym stands for findable, accessible, interoperable, and reusable. The principles postulate best-practice guidance for scientific data stewardship. Initiatives such as Plan S, requiring all manuscripts from projects funded by the signatories to be released as open-access publications, lend further support to the push for open science.
Alas, the energy and climate modeling community has so far failed to realize and implement the full potential of the broader movement towards collaborative work and best practice of scientific software development. To live up to the expectation of truly open science, the research community needs to move beyond “only” open-source.
Until now, the main focus of the call for open and transparent research has been on releasing the final status of scientific work under an open-source license – giving others the right to inspect, reuse, modify, and share the original work. In practice, this often means simply uploading the data and source code for generating results or analysis to a service like Zenodo. This is obviously an improvement compared to the previously common “available upon reasonable request” approach. Unfortunately, the data and source code are still all too often poorly documented and do not follow best practice of scientific software development or data curation. While the research is therefore formally “open”, it is often not easily intelligible or reusable with reasonable effort by other researchers.
What do I mean by “best practice”? Imagine I implement a particular feature in a model or write a script to answer a specific research question. I then add a second feature – which inadvertently changes the behavior of the first feature. You might think that this could be easily identified and corrected. Unfortunately, given the complexity and size to which scientific software projects tend to quickly evolve, one often fails to spot the altered behavior immediately.
One solution to this risk is “continuous integration” and automated testing. This is a practice common in software development: for each new feature, we write specific tests in an as-simple-as-possible example at the same time as implementing the function or feature itself. These tests are then executed every time that a new feature is added to the model, toolbox, or software package, ensuring that existing features continue to work as expected when adding a new functionality.
Other practices that modelers and all researchers using numerical methods should follow include using version control and writing documentation throughout the development of scientific software rather than leaving this until the end. In addition, not just the manuscript and results of scientific work should be scrutinized (aka “peer review”), but such appraisal should also apply to the scientific software code written to process data and analyze model results. In addition, like the mentoring of early-career researchers, such a review should not just come at the end of a project but should be a continuous process throughout the development of the manuscript and the related analysis scripts.
In the course that I teach at TU Wien, as well as in my work on the MESSAGEix model, the Intergovernmental Panel on Climate Change Special Report on Global Warming of 1.5°C scenario ensemble, and other projects at the IIASA Energy Program, I try to explain to students and junior researchers that following such best-practice steps is in their own best interest. This is true even when it is just a master’s thesis or some coursework assignment. However, I always struggle to find the best way to convince them that following best practice is not just a noble ideal in itself, but actually helps in doing research more effectively. Only when one has experienced the panic and stress caused by a model not solving or a script not running shortly before a submission deadline can a researcher fully appreciate the benefits of well-structured code, explicit dependencies, continuous integration, tests, and good documentation.
A common trope says that your worst collaborator is yourself from six months ago, because you didn’t write enough explanatory comments in your code and you don’t respond to emails. So even though it sounds paradoxical at first, spending a bit more time following best practice of scientific software development can actually give you more time for interesting research. Moreover, when you then release your code and data under an open-source license, it is more likely that other researchers can efficiently build on your work – bringing us one step closer to a community of open science!
Note: This article gives the views of the authors, and not the position of the Nexus blog, nor of the International Institute for Applied Systems Analysis.
Aug 11, 2020 | COVID19, Data and Methods, Science and Policy, Women in Science
By Sibel Eker, researcher in the IIASA Energy Program
IIASA researcher Sibel Eker explores the usefulness and reliability of COVID-19 models for informing decision making about the extent of the epidemic and the healthcare problem.

© zack Ng 99 | Dreamstime.com
In the early days of the COVID-19 pandemic, when facts were uncertain, decisions were urgent, and stakes were very high, both the public and policymakers turned not to oracles, but to mathematical modelers to ask how many people could be infected and how the pandemic would evolve. The response was a plethora of hypothetical models shared on online platforms and numerous better calibrated scientific models published in online repositories. A few such models were announced to support governments’ decision-making processes in countries like Austria, the UK, and the US.
With this announcement, a heated debate began about the accuracy of model projections and their reliability. In the UK, for instance, the model developed by the MRC Centre for Global Infectious Disease Analysis at Imperial College London projected around 500,000 and 20,000 deaths without and with strict measures, respectively. These different policy scenarios were misinterpreted by the media as a drastic variation in the model assumptions, and hence a lack of reliability. In the US, projections of the model developed by the University of Washington’s Institute for Health Metrics and Evaluation (IHME) changed as new data were fed into the model, sparking further debate about the accuracy thereof.
This discussion about the accuracy and reliability of COVID-19 models led me to rethink model validity and validation. In a previous study, my colleagues and I showed that, based on a vast scientific literature on model validation and practitioners’ views, validity often equates with how good a model represents the reality, which is often measured by how accurately the model replicates the observed data. However, representativeness does not always imply the usefulness of a model. A commentary following that study emphasized the tradeoff between representativeness and the propagation error caused by it, thereby cautioning against an exaggerated focus on extending model boundaries and creating a modeling hubris.
Following these previous studies, in my latest commentary in Humanities and Social Sciences Communications, I briefly reviewed the COVID-19 models used in public policymaking in Austria, the UK, and the US in terms of how they capture the complexity of reality, how they report their validation, and how they communicate their assumptions and uncertainties. I concluded that the three models are undeniably useful for informing the public and policy debate about the extent of the epidemic and the healthcare problem. They serve the purpose of synthesizing the best available knowledge and data, and they provide a testbed for altering our assumptions and creating a variety of “what-if” scenarios. However, they cannot be seen as accurate prediction tools, not only because no model is able to do this, but also because these models lacked thorough formal validation according to their reports in late March. While it may be true that media misinterpretation triggered the debate about accuracy, there are expressions of overconfidence in the reporting of these models, even though the communication of uncertainties and assumptions are not fully clear.

© Jaka Vukotič | Dreamstime.com
The uncertainty and urgency associated with pandemic decision-making is familiar to many policymaking situations from climate change mitigation to sustainable resource management. Therefore, the lessons learned from the use of COVID models can resonate in other disciplines. Post-crisis research can analyze the usefulness of these models in the discourse and decision making so that we can better prepare for the next outbreak and we can better utilize policy models in any situation. Until then, we should take the prediction claims of any model with caution, focus on the scenario analysis capability of models, and remind ourselves one more time that a model is a representation of reality, not the reality itself, like René Magritte notes that his perfectly curved and brightly polished pipe is not a pipe.
References
Eker S (2020). Validity and usefulness of COVID-19 models. Humanities and Social Sciences Communications 7 (1) [pure.iiasa.ac.at/16614]
Note: This article gives the views of the author, and not the position of the Nexus blog, nor of the International Institute for Applied Systems Analysis.


You must be logged in to post a comment.