Sep 23, 2020 | Alumni, Data and Methods, Environment, IIASA Network
By Victor Maus, alumnus of the IIASA Ecosystems Services and Management Program and researcher at the Vienna University of Economics and Business
The mining of coal, metals, and other minerals causes loss of natural habitats across the entire globe. However, available data is insufficient to measure the extent of these impacts. IIASA alumnus Victor Maus and his colleagues mapped more than 57,000 km² of mining areas over the whole world using satellite images.
© Pix569 | Dreamstime.com
Our modern lifestyles and consumption patterns cause environmental and social impacts geographically displaced in production sites thousands of kilometres away from where the raw materials are extracted. Complex supply chains connecting mineral mining regions to consumers often obscure these impacts. Our team at the Vienna University of Economics and Business is investigating these connections and associated impacts on a global-scale www.fineprint.global.
However, some mining impacts are not well documented across the globe, for example, where and how much area is used to extract metals, coal, and other essential minerals are unknown. This information is necessary to assess the environmental implications, such as forest and biodiversity loss associated with mining activities. To cover this data gap, we analyzed the satellite images of more than 6,000 known mining regions all around the world.
Visually identifying such a large number of mines in these images is not an easy task. Imagine you are flying and watching from the window of a plane, how many objects on the Earth’s surface can you identify and how fast? Using satellite images, we searched and mapped mines over the whole globe. It was a very time-consuming and exhausting task, but we also learned a lot about what is happening on the ground. Besides, it was very interesting to virtually visit a vast range of mining places across the globe and realize the large variety of ecosystems that are affected by our increasing demand for nature’s resources.
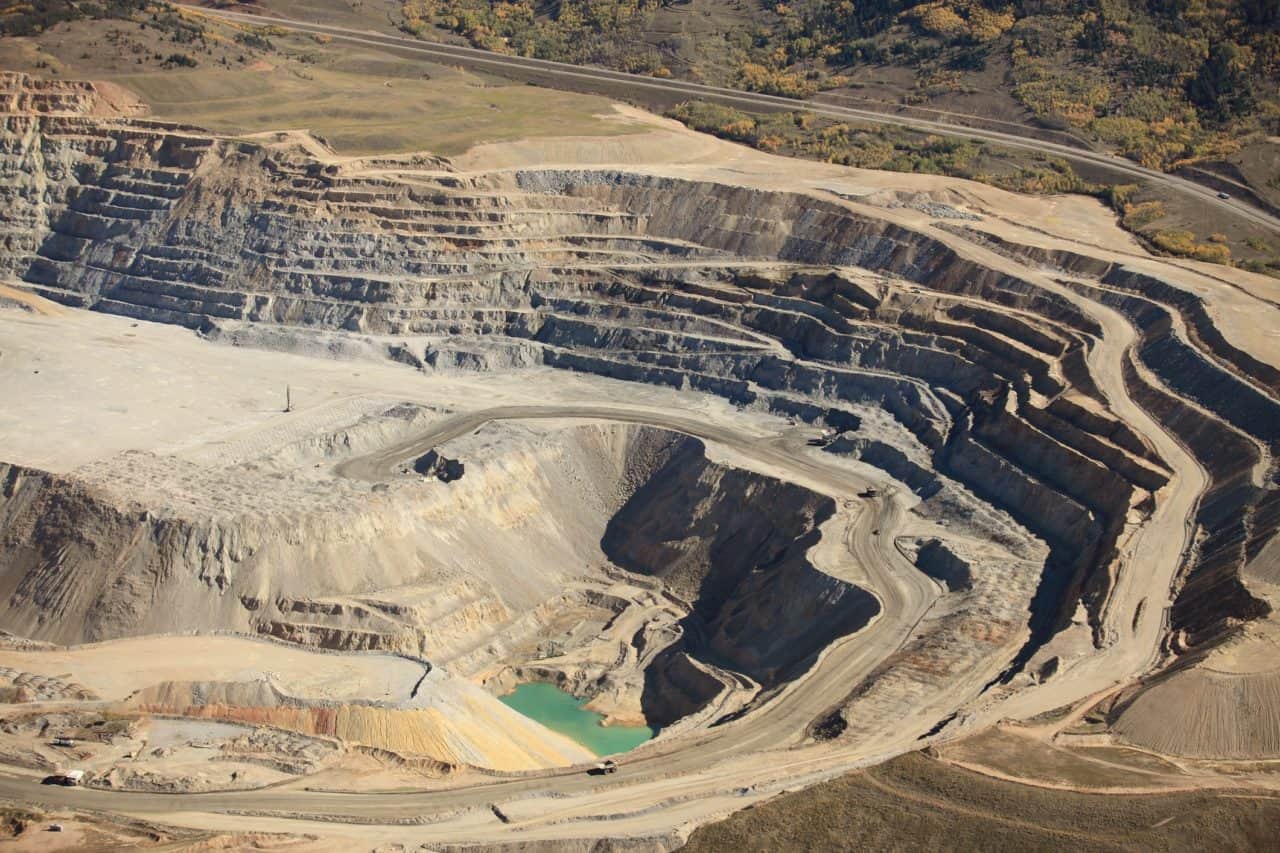
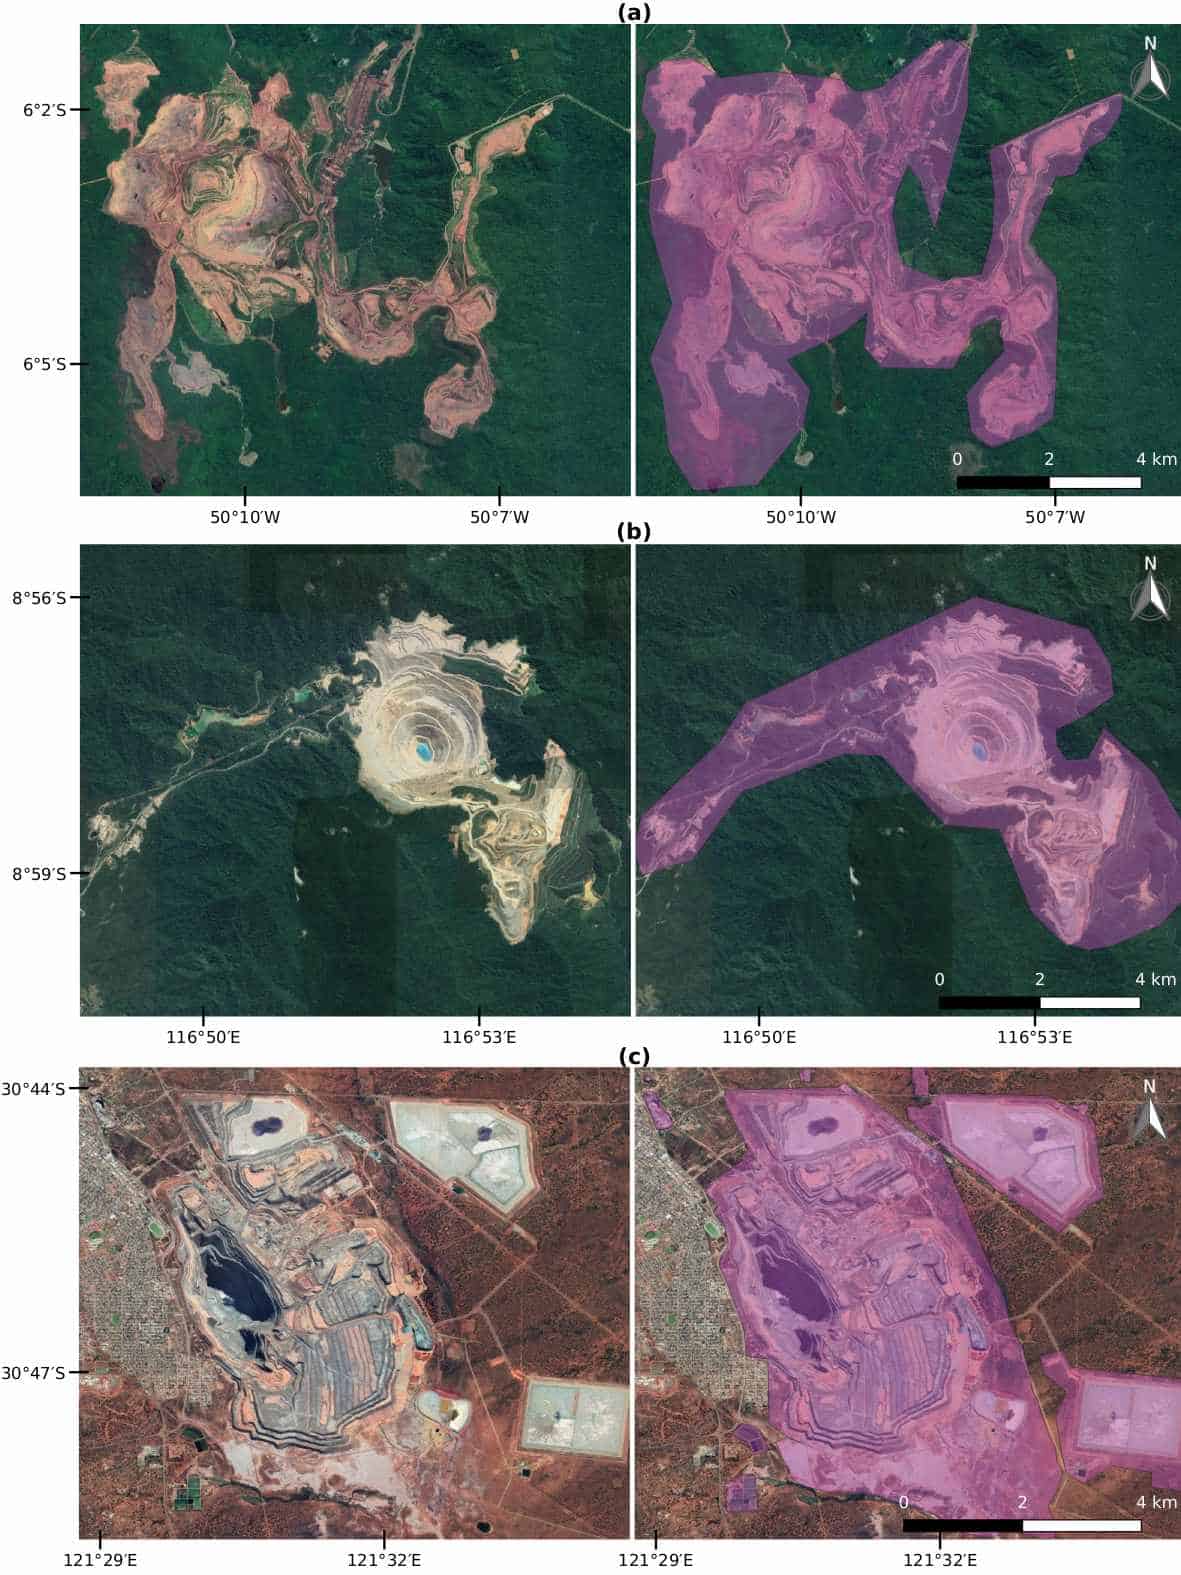
The result of our adventure is a global data set covering more than 21,000 mapped areas adding up to around 57,000 km² (that is about the size of Croatia or Togo). These mapped areas cover open cuts, tailings dams, piles of rocks, buildings, and other infrastructures related to the mining activities — some of them extending to almost 10 km (see figure below). We also learned that around 50 % of the mapped mining area is concentrated in only five countries, China, Australia, the United States, Russia, and Chile.

Examples of mines viewed from Google Satellite images. (a) Caraj\'{a}s iron ore mine in Brazil, (b) Batu Hijau copper-gold mine in Indonesia, and (c) Super Pit gold mine in Australia. In purple is the data collected for these mines (Figure source: www.nature.com/articles/s41597-020-00624-w).
Using these data, we can improve the calculation of environmental indicators of global mineral extraction and thus support the development of less harmful ways to extract natural resources. Further, linking these impacts to supply chains can help to answer questions related to our consumption of goods. For example, which impacts the extraction of minerals used in our smartphones cases and where on the planet they occur? We hope that many others will use the mining areas data for their own research and applications. Therefore, the data is fully open to everyone. You can explore the global mining areas using our visualization tool at www.fineprint.global/viewer or you can download the full data set from doi.pangaea.de/10.1594/PANGAEA.910894. The complete description of the data and methods is in our paper available from www.nature.com/articles/s41597-020-00624-w.
This blog post first appeared on the Springer Nature “Behind the paper” website. Read the original post here.
Note: This article gives the views of the authors, and not the position of the Nexus blog, nor of the International Institute for Applied Systems Analysis.
Nov 2, 2018 | Citizen Science, Ecosystems, Environment, Food
by Rastislav Skalsky, Ecosystems Services and Management Program, International Institute for Applied Systems Analysis
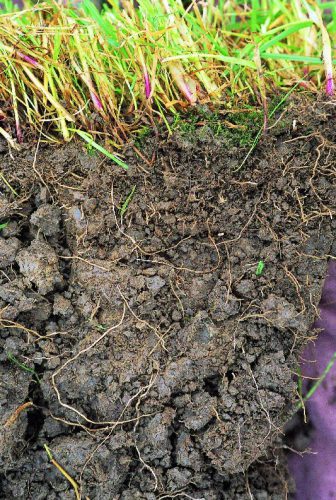
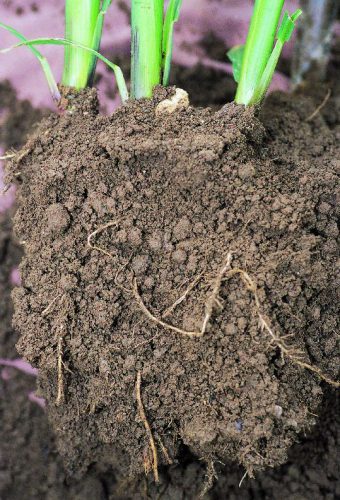
Clay soil
As growers, we know soil is important. It supports plants, and provides nutrients and water for them to grow. But do we all appreciate how crucial the role of soil is in continuously supplying plants with water, even when it hasn’t rained for a few days or even weeks, even without extra water being added via watering?
Soil is like a sponge. It can retain rain water and, if it is not taken up by plants, soil can store it for a long time. We can feel the water in soil as soil moisture. Try it — take and hold a lump (clod) of soil — if it is wet it will leave a spot on your palm. If it’s only moist then it will feel cold — cooler than the air around. And if the soil is dry, it will feel a little warm.
Soil moisture not only can be felt, but it can also be measured — in the lab, or directly in the field with professional or low-cost soil moisture sensors.
Soil moisture in general indicates how much water is contained by the soil. But it is not always the case that soil which feels moist or wet is able to support plants. It could happen that, despite feeling moist, the soil simply does not hold enough water, or holds the water too tightly for the plants to extract it. Or the opposite, soil can sometimes contain too much water. To understand how this works, one has to learn more about how water is stored in the soil.
Water is bound to soil by physical forces. Some forces are too weak to hold water in the plant root zone and water percolates to deeper layers, where plants can no longer reach it. Other forces can be too strong, preventing water from being retrieved by the roots.
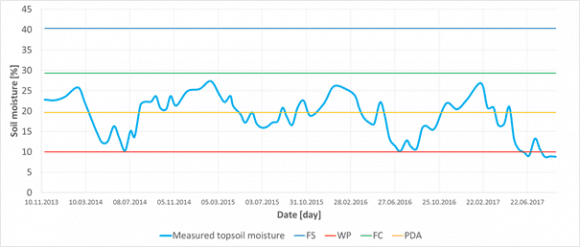
Figure 1
If soil moisture is measured at one place over time, it can reveal its seasonal dynamics. Having estimated important soil water content thresholds (FS — full saturation, FC — field capacity, PDA — point of decreased availability, and WP — wilting point) for that particular site, e.g. based on soil texture test or measurement, one can easily interpret if the measured soil moisture and say if there was enough water or not to fully support plants with water and air. In this particular case of sandy 0–30 cm deep topsoil from Slovakia, it was never wet enough to cause oxygen stress for plants, — in fact it never reached state of all capillary voids filled with water (FC). On the other hand, each summer the topsoil moisture dropped below the point of decreased availability (PDA), even got close to the wilting point or went through (WP), which means that during those periods plants suffered drought conditions.
Thresholds
In order to describe this behavior in more useful terms, plant ecologists and soil hydrologists came up with couple of important soil water content thresholds (Figure 1). These thresholds, also called “soil moisture ecological intervals”, define how easily plants can get the water out of the soil.
We speak about full saturation of soil when all empty spaces (pores/voids) are completely filled with water. Full saturation of the soil with water prevents air entering into the soil. Yet there is no force holding water in the soil. Roots need air as well as water so, if this situation continues, it eventually causes oxygen stress for most of the common plants because roots simply cannot breathe.
Soil also has different types of pores. Larger ones, which are called “gravitational pores”, are filled with water only when the soil is saturated and otherwise drains freely, and smaller ones called “capillary pores” which are small enough in size to prevent water from percolating down the soil profile by gravitation. These smaller pores can hold water even in well-drained soils and make it available for plants to extract. There are also even smaller pores where the water is held so tightly that plants cannot extract it.
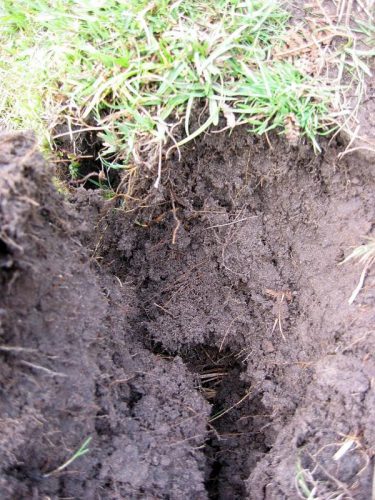
Sandy soil
When all gravitational pores/voids are empty of water and it is present only in so called capillary pores/void we speak about the field water capacity — which is considered to be the best soil moisture status of the soil — enabling plants to retrieve the water they need, whilst leaving enough air for roots to breathe. If no new water is added into the soil, the soil dries as water is used by plants or evaporates. As soil dries less water is available to plants until the point of decreased availability when water remains only in the smallest capillary pores/voids. But this water is bound to soil particles so strongly that most plants are not able to extract it suffer from drought. Ultimately, all the available water is used up by plants, and the remaining water is inaccessible. Soil reaches the so-called wilting point and water is not available for the plants anymore. Plants permanently wilt and eventually die.
How Soil Characteristics Relate to Moisture
The tricky thing with soil moisture however is that the same amount of water (volumetric percent of the total soil column volume) can, in different soils, represent different amount of water available for plants. How big this difference could be is defined by many soil characteristics.
Loamy soil
The most important is the soil texture — a blend of all fine-earth soil mineral constituents (sand, silt, clay) and stones in various rates. In general, the finer the texture is (i.e. more clay, less sand) the more water is bound in the soil too tightly to be retrieved by plants. Even if the soil feels moist, plants can permanently wilt in clay soils. In contrast, those soils with coarse texture (i.e. more sand, less clay) can support plants with nearly all the water they can hold. Although the soil looks dry, plants can still effectively take the water out of it. The drawback here is that in coarse textured, sandy, soil nearly all water drains down the gravitational pores and therefore such a soil cannot support plants for very long time. That is also why medium textured soils (loam, silty loam, clay loam) are considered best for holding and providing the water for plants. Medium textured soils can effectively drain excess water, yet hold much water in capillary pores/voids for a long time, and still, only a relatively small amount of water remains unavailable for the plants.
A practical implication of this behavior of soil with different soil texture could be that one has to apply slightly different strategies to maintain soil moisture in the way that it can effectively supply plants with water. Sandy soils will require more frequent watering with smaller amount of water. It would not make any practical sense to try build-up a storage of water in these soils. All extra water added will simply drain out of the topsoil. Clay rich soils can absorb big amounts of water but a lot is bounded too strongly to the soil particles and thus not available for the plants. Therefore one should water even if the soil looks moist or wet — and if dry a lot of water must be added to recharge the topsoil so that it can support plants effectively. With loamy soils it is possible to be more relaxed with watering frequency, simply because one can build solid storage of water in such soils. Adding a bit more water than is necessary is perfectly fine with these soils because the water is effectively kept in the soil profile and it can be used later on.
Interested in learning more? Why not sign up for GROW Observatory’s next free online course – Citizen Research: From Data to Action – to discover how citizen-generated data on soils, food and a changing climate can create positive change in the world. Starts 5th November.
This blog was originally published on https://medium.com/grow-observatory-blog/moisture-matters-a9e33dc880a1
Mar 21, 2018 | Citizen Science, Environment
By Linda See and Inian Moorthy, Ecosystems Services and Management Program
A recent estimate indicates that there are around 3 trillion trees on the Earth’s surface, of which around 15 billion are cut down each year [1]. When we think of these vast numbers, we usually picture Amazonian rainforests or landscapes of evergreen trees surrounded by lakes and mountains. We rarely think of urban trees and the important role they play in making cities a healthier, greener place to live.

©Durch pecaphoto77 | Shutterstock
Raising awareness of the importance of urban forests for quality of life is part of the theme of this year’s United Nations International Day of Forests. At IIASA we are actively contributing to this awareness through an EU-funded project called LandSense. The aim of the project is to create a citizen-powered observatory for environmental monitoring of landscapes, particularly those that are changing and affecting citizen wellbeing, livelihoods, and biodiversity. Monitoring trees, and more specifically urban greenspaces, is a fundamental component of the LandSense project. Trees can reduce air pollution in cities by absorbing and filtering out the gases and particles that cause harm. Additionally, trees have a cooling effect on cities, which is increasingly important as temperatures rise due to climate change. In cities, the urban heat island effect results in higher temperatures during heat waves, often leading to health problems and even fatalities. Monitoring the presence of urban trees and fostering citizen access to urban greenspaces should therefore not be underestimated in terms of their contribution to promoting urban health, wellbeing, and sustainable cities.
With this urban focus in mind, the LandSense citizen observatory is engaging citizens in Vienna and Amsterdam in monitoring their local greenspaces, and in this way obtaining their perceptions about the quality and extent of these areas. A smart phone app developed at IIASA, guides participating citizens to specific locations in the city and asks them a series of questions, some of which relate to the quality of the trees in their area. This feedback can help city authorities to better understand the views of their citizens. The ultimate goal is to create dynamic and temporal maps of greenspace quality across the city, which can guide timely local decision making. The LandSense app will for example, directly contribute to STEP 2025, the urban development plan for Vienna.
This participatory approach not only gives citizens a better understanding of changing greenspaces in the city, but also empowers them to elicit action from city authorities in terms of improving poorly perceived greenspaces. By participating in this process, citizens are actively engaging in dialogue with the city authorities – getting their voices heard and influencing where future improvements will take place. Ultimately, by improving greenspaces and urban forests, citizens are helping to increase the wellbeing and quality of life of urban dwellers in the city.
We are currently testing the mobile app with students in Vienna and Amsterdam before launching broader citizen-based greenspace monitoring campaigns in the future. If you want to find out more, please visit the LandSense website for details or follow us on Twitter @LandSense.
References
[1] Crowther TW, Glick HB, Covey KR, et al (2015). Mapping tree density at a global scale. Nature 525:201–205. doi: 10.1038/nature14967
Note: This article gives the views of the authors, and not the position of the Nexus blog, nor of the International Institute for Applied Systems Analysis.
Sep 19, 2017 | Citizen Science, Food, Sustainable Development
By Myroslava Lesiv, IIASA Ecosystems Services and Management Program.
The public can contribute considerably to science by filling the gaps of missing information in many research areas, for example, monitoring land use, biodiversity, or forest degradation. Crowdsourcing campaigns organized by research institutions bring together citizens interested in science and help solving research questions to the benefit of the whole world.
This June, the IIASA Geo-Wiki team ran the Global Field Size campaign, encouraging citizen scientists to classify field sizes on satellite images. Its aim was to develop a global field sizes dataset, which will be used as input to create an improved global cropland field size map for agricultural monitoring and food security assessments. The field sizes dataset can also help us determine what types of satellite data are needed for agricultural monitoring in different parts of the world.

Geo-Wiki interface for collecting field size data. Background layer: Google Maps.
Why are field sizes so important? They provide us with valuable information to tackle challenges of food security. A recent study showed that more than a half the food calories produced globally comes from smallholder farmers, who often make up the most vulnerable parts of population, living in poverty. Within this scope, the field size dataset fills the gaps of missing information, especially for countries that have a limited food supply and lack a well-developed agricultural monitoring system.
The Global Field Size campaign has been one of the most successful crowdsourcing campaigns run through the Geo-Wiki engagement platform. Within one month, 130 participants completed 390,000 tasks – that is, they classified the field sizes in 130,000 locations around the globe!
So we can see that crowdsourcing is powerful, but can we trust the data? Is it accurate enough to be used in different applications? I think it is! The Geo-Wiki team has significant experience in running crowdsourcing campaigns; one of the key lessons we have learned from previous Geo-Wiki campaigns is the importance of training the public to increase the quality of the crowdsourced data.
This campaign was designed so that the participants learned over time how to delineate fields in different regions of the world, and, at the same time, pay special attention to the quality of their submissions. At the end of the campaign, the majority of participants gave us a feedback that, to them, this campaign was indeed a learning exercise. From our end, I have to add, this was also a challenging campaign, as fields are so diverse in shape, continuity of coverage, crop type, irrigation, etc.

Global distribution of dominant field sizes. Cartography by Myroslava Lesiv. Country boundaries: GAUL. Software: ArcMap 10.1.
During the campaign, the crowd was asked to identify whether there were fields in a certain location, and determine the relevant field sizes by the visual interpretation of very high-resolution Google and Bing imagery. A “field” was defined as an agricultural area that included annual or perennial croplands, fallow, shifting cultivation, pastures or hayfields. The collected data can also be used to identify areas falsely mapped as cropland.
Now the team is focused on summarizing the results of the campaign, processing the collected field size data, and preparing them for scientific publication. We will ensure that the published dataset is of high quality and can be used by others with confidence!
This article gives the views of the author, and not the position of the Nexus blog, nor of the International Institute for Applied Systems Analysis.
May 29, 2017 | Citizen Science, Risk and resilience
By Wei Liu, IIASA Risk and Resilience Program
What do Rajapur, Nepal; Chosica, Peru; and Tabasco, Mexico all have in common? Flooding: these areas are all threatened by floods, and they also face similar knowledge gaps, especially in terms of local level spatial information on risk, and the resources and the capacities of communities to manage risk.
To address these gaps, I and my colleagues at IIASA, in collaboration with Kathmandu Living Labs (KLL) and Practical Action (PA) Nepal are building on our experiences in Nepal’s Lower Karnali River basin to support flood risk mapping in flood-prone areas in Peru and Mexico.
Recent developments in data collection and communication via personal devices and social media have greatly enhanced citizens’ abilities to contribute spatial data, called Crowdsourced Geographic Information (CGI) in the mapping community. OpenStreetMap is the most widely used platform for sharing this free geographic data globally, and the fast growing Humanitarian OpenStreetMap Team has developed CGI in some of the world’s most disaster-prone and data-scarce regions. For example, after the 2015 Nepal Earthquake, thousands of global volunteers mapped infrastructure across Nepal, greatly supporting earthquake rescue, recovery, and reconstruction efforts.
Today there is excellent potential to engage citizen mappers in all stages of the disaster risk management cycle, including risk prevention and reduction, preparedness and reconstruction. In this project, we have successfully launched a series of such mapping activities for the Lower Karnali River basin in Nepal starting in early 2016. In an effort to share the experience and lessons of this work with other Zurich Global Flood Resilience Alliance field sites, in March 2017 we initiated two new mapathons in Kathmandu, with support from Soluciones Prácticas (PA Peru) and the Mexican Red Cross, to remotely map basic infrastructure such as buildings and roads, as well as visible water surface, around flood-prone communities in Chosica, Peru and Tobasco, Mexico.
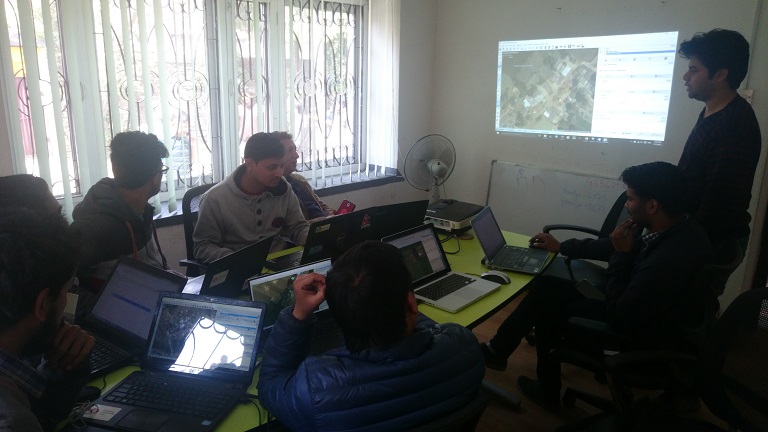
March 17th, 2017, staff and volunteers conducting remote mapping at Kathmandu Living Labs @ Wei Liu | IIASA
Prior to our efforts very few buildings in these areas were identified on online map portals, including Google Maps, Bing Maps, and OSM. Through our mapathons, dozens of Nepalese volunteers mapped over 15,000 buildings and 100 km of roads. The top scorer, Bishal Bhandari, mapped over 1,700 buildings and 6 km of roads for Chosica alone.
Having the basic infrastructure mapped before a flood event can be extremely valuable for increasing flood preparedness of communities and for local authorities and NGOs. During the period of the mapathons, the Lima region in Peru, including Chosica, was hit by a severe flood induced by coastal El Niño conditions. Having almost all buildings in Chosica mapped on the OSM platform now makes visible the high flood risk faced by people living in this densely populated area with both formal and informal settlements. These data may support conducting a quick damage assessment, as suggested by Miguel Arestegui, a collaborator from PA Peru during his visit to IIASA in April, 2017.
Recognizing the value of crowdsourced spatial risk information, we are working closely with partners, including OpenStreetMap Peru, to mobilize the creativity, technical know-how, and practical experience from the Nepal study to Latin America countries. Collecting such information using CGI comes with low cost but high potential for modeling and estimating the amount of people and economic assets potentially being affected under different future flood situations, for improving development and land-use plans to support disaster risk reduction, and for increasing preparedness and helping with allocating humanitarian support in a timely manner after disaster events.
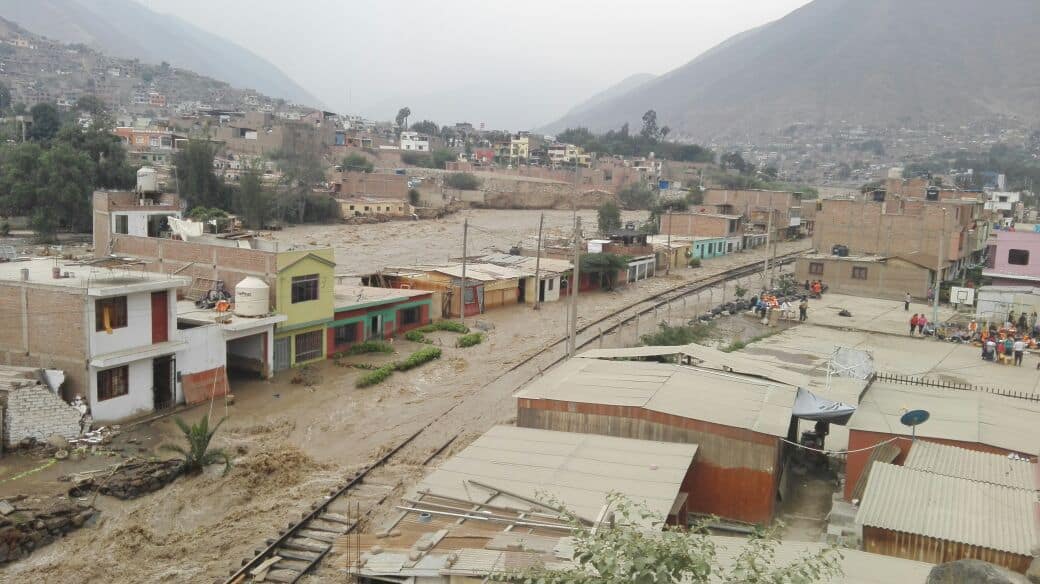
Flood-inundated houses and local railway in Chosica, Peru, 18/03/2017 @ Miluska Ordoñez | Soluciones Prácticas
The United Nation’s Sendai Framework for Disaster Risk Reduction states that knowledge in “all dimensions of vulnerability, capacity, exposure of persons and assets, hazard characteristics and the environment” needs to be leveraged to inform policies and practices across all stages of the disaster risk management cycle. CGI has a great potential to involve citizens from around the world to help fill this critical knowledge gap. These pilot mapathons conducted between Nepal and Latin America are promising examples of supporting community flood resilience through the mobilization of CGI via international partnerships within the Global South.
This article gives the views of the author, and not the position of the Nexus blog, nor of the International Institute for Applied Systems Analysis.
You must be logged in to post a comment.