Jan 15, 2018 | Data and Methods, Demography
By Dilek Yildiz, Wittgenstein Center for Demography and Global Human Capital (IIASA, VID/ÖAW and WU), Vienna Institute of Demography, Austrian Academy of Sciences, International Institute for Applied Systems Analysis
Social media offers a promising source of data for social science research that could provide insights into attitudes, behavior, social linkages and interactions between individuals. As of the third quarter of 2017, Twitter alone had on average 330 million active users per month. The magnitude and the richness of this data attract social scientists working in many different fields with topics studied ranging from extracting quantitative measures such as migration and unemployment, to more qualitative work such as looking at the footprint of second demographic transition (i.e., the shift from high to low fertility) and gender revolution. Although, the use of social media data for scientific research has increased rapidly in recent years, several questions remain unanswered. In a recent publication with Jo Munson, Agnese Vitali and Ramine Tinati from the University of Southampton, and Jennifer Holland from Erasmus University, Rotterdam, we investigated to what extent findings obtained with social media data are generalizable to broader populations, and what constitutes best practice for estimating demographic information from Twitter data.
A key issue when using this data source is that a sample selected from a social media platform differs from a sample used in standard statistical analysis. Usually, a sample is randomly selected according to a survey design so that information gathered from this sample can be used to make inferences about a general population (e.g., people living in Austria). However, despite the huge number of users, the information gathered from Twitter and the estimates produced are subject to bias due to its non-random, non-representative nature. Consistent with previous research conducted in the United States, we found that Twitter users are more likely than the general population to be young and male, and that Twitter penetration is highest in urban areas. In addition, the demographic characteristics of users, such as age and gender, are not always readily available. Consequently, despite its potential, deriving the demographic characteristics of social media users and dealing with the non-random, non-representative populations from which they are drawn represent challenges for social scientists.
Although previous research has explored methods for conducting demographic research using non-representative internet data, few studies mention or account for the bias and measurement error inherent in social media data. To fill this gap, we investigated best practice for estimating demographic information from Twitter users, and then attempted to reduce selection bias by calibrating the non-representative sample of Twitter users with a more reliable source.
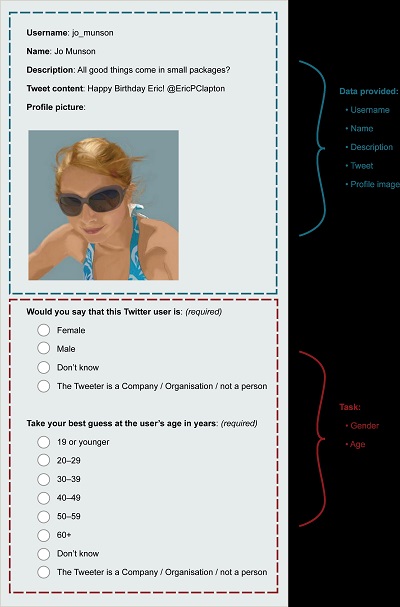
Exemplar of CrowdFlower task © Jo Munson.
We gathered information from 979,992 geo-located Tweets sent by 22,356 unique users in South-East England and estimated their demographic characteristics using the crowd-sourcing platform CrowdFlower and the image-recognition software Face++. Our results show that CrowdFlower estimates age more accurately than Face++, while both tools are highly reliable for estimating the sex of Twitter users.
To evaluate and reduce the selection bias, we ran a series of models and calibrated the non-representative sample of Twitter users with mid-year population estimates for South-East England from the UK Office of National Statistics. We then corrected the bias in age-, sex-, and location-specific population counts. This bias correction exercise shows promise for unbiased inference when using social media data and can be used to further reduce selection bias by including other sociodemographic variables of social media users such as ethnicity. By extending the modeling framework slightly to include an additional variable, which is only available through social media data, it is also possible to make unbiased inferences for broader populations by, for example, extracting the variable of interest from Tweets via text mining. Lastly, our methodology lends itself for use in the calculation of sample weights for Twitter users or Tweets. This means that a Twitter sample can be treated as an individual-level dataset for micro-level analysis (e.g., for measuring associations between variables obtained from Twitter data).
Reference:
Yildiz, D., Munson, J., Vitali, A., Tinati, R. and Holland, J.A. (2017). Using Twitter data for demographic research, Demographic Research, 37 (46): 1477-1514. doi: 10.4054/DemRes.2017.37.46
Note: This article gives the views of the author, and not the position of the Nexus blog, nor of the International Institute for Applied Systems Analysis.
Nov 7, 2017 | Data and Methods, Food, Postdoc, Water
By Valeria Javalera Rincón, IIASA CONACYT Postdoctoral Fellow in the Ecosystems Services and Management and Advanced Systems Analysis programs.
What is more important: water, energy, or food?
If you work in the water, energy or agriculture sector we can guess what your answer might be! But if you are a policy or decision maker trying to balance all three, then you know that it is getting more and more difficult to meet the growing demand for water, energy, and food with the natural resources available. The need for this balance was confirmed by the 17 Sustainable Development Goals, agreed by 193 countries, and the Paris climate agreement. But how to achieve it? Intelligent cooperation is the key.
The thing is that water, energy, and food are all related in such a way that are reliant on each other for production or distribution. This is the so-called Water-Energy-Food nexus. In many cases, you need water to produce energy, you need energy to pump water, and you need water and energy to produce, distribute, and conserve food.
Many scientists have tried to relate or to link models for water, agriculture, land, and energy to study these synergic relationships. In general, so far, there are two ways that this has been solved: One is integrating models with “hard linkages” like this:
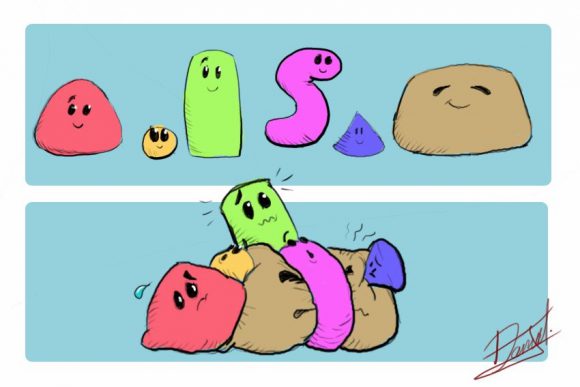
© Daniel Javalera
In the picture there are six models (let’s say water, land use, hydro energy, gas, coal, food production models) that are then integrated into just one. The resulting integrated model then preserves the relationships but is complex, and in order to make it work with our current computer power you often have to sacrifice details.
Another way is to link them is using so-called “soft linkages” where the output of one model is the input of the next one, like this:
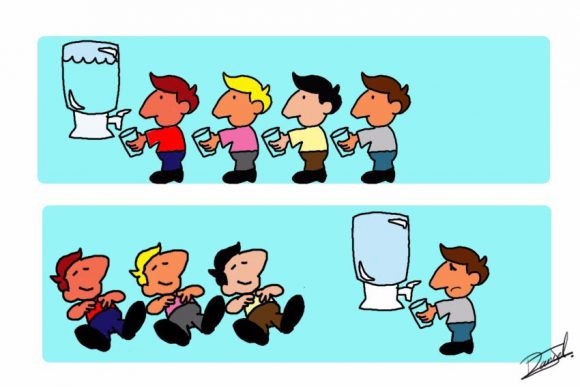
© Daniel Javalera
In the picture, each person is a model and the input is the amount of water left. These models all refer to a common resource (the water) and are connected using “soft linkages.” These linkages are based on sequential interaction, so there is no feedback, and no real synergy.
The intelligent linker agent
But what if we could have the relations and synergies between the models? It would mean much more accurate findings and helpful policy advice. Well, now we can. The secret is to link through an intelligent linker agent.
I developed a methodology in which an intelligent linker agent is used as a “negotiator” between models that can communicate with each other. This negotiator applies a machine-learning algorithm that gives it the capability to learn from the interactions with the models. Through these interactions, the intelligent linker can advise on globally optimal actions.
The knowledge of the intelligent linker is based on past experience and also on hypothetical future actions that are evaluated in a training process. This methodology has been used to link drinking water networks, such as Barcelona’s drinking water network.
When I came to IIASA, I was asked to apply this approach to optimize trading between cities in the Shanxi region of China. I used a set of previously development models which aimed to distribute water and land available for each city in order to produce food (eight types of crops) and coal for energy. The intelligent linker agent optimizes trading between cities in order to satisfy demand at the lowest cost for each city.
The purpose of this exercise was to compare the solutions with those from “hard linkages” – like those in the first picture. We found that the intelligent linker is flexible enough to find the optimal solution to questions such as: How much of each of these products should each city export/import to satisfy global demand at a global lower economic and ecological cost? What actions are optimal when the total production is insufficient to meet the total demand? Under what conditions is it preferable to stop imports/exports when production is insufficient to supply the demand of each city?
The answers to these questions can be calculated by the interaction with the models of each city just by the interfacing with the intelligent linker agent, this means that no major changes in the models of each city were needed. We also found that, under the same conditions, the solutions using the intelligent linker agent were in agreement with those found when hard linking was used.
My next challenge is to build a prototype of a “distributed computer platform,” which will allow us to link models on different computers in different parts of the world—so that we in Austria could link to a model built by colleagues in Brazil, for example. I also want to link models of different sectors and regions of the globe, in order to prove that intelligent cooperation is the key to improving global welfare.
References
Xu X, Gao J, Cao G-Y, Ermoliev Y, Ermolieva T, Kryazhimskiy AV, & Rovenskaya E (2015). Modeling water-energy-food nexus for planning energy and agriculture developments: case study of coal mining industry in Shanxi province, China. IIASA Interim Report. IIASA, Laxenburg, Austria: IR-15-020
Javalera V, Morcego B, & Puig V, Negotiation and Learning in distributed MPC of Large Scale Systems, Proceedings of the 2010 American Control Conference, Baltimore, MD, 2010, pp. 3168-3173. doi: 10.1109/ACC.2010.5530986
Valeria J, Morcego B, & Puig V, Distributed MPC for Large Scale Systems using Agent-based Reinforcement Learning, In IFAC Proceedings Volumes, Volume 43, Issue 8, 2010, Pages 597-602, ISSN 1474-6670, ISBN 9783902661913, https://doi.org/10.3182/20100712-3-FR-2020.00097.
Morcego B, Javalera V, Puig V, & Vito R (2014). Distributed MPC Using Reinforcement Learning Based Negotiation: Application to Large Scale Systems. In: Maestre J., Negenborn R. (eds) Distributed Model Predictive Control Made Easy. Intelligent Systems, Control and automation: Science and Engineering, vol 69. Springer, Dordrecht
Javalera Rincón V, Distributed large scale systems: a multi-agent RL-MPC architecture, Universitat Politècnica de Catalunya. Institut d’Organització i Control de Sistemes Industrials,Doctoral thesis. 2016. http://upcommons.upc.edu/handle/2117/96332
Note: This article gives the views of the author and not the position of the Nexus blog, nor of the International Institute for Applied Systems Analysis.
Jul 3, 2017 | Data and Methods, Food
By Victor Maus, IIASA Ecosystems Services and Management Program
Nowadays, satellite images are an abundant supply of data which we can use to get information about our planet and its changes. Satellite images can, for example, help us detect an approaching storm, measure the expansion of a city, identify deforested areas, or estimate how crop areas change over time. Usually, we are interested in extracting information from large areas, for example, deforestation in the Amazon Rainforest (5.5 million km², around 15 times the area of Germany). It would be challenging for us to monitor and map such vast areas without combining satellite images with automated and semi-automated computer programs.

Aerial view of the Amazon Rainforest, near Manaus, Brazil. Monitoring deforestation in the Amazon is difficult because the area is massive and remote. ©Neil Palmer | CIAT
To address this problem, I developed — along with my colleagues Gilberto Camara from the Brazilian National Institute for Space Research and Marius Appel and Edzer Pebesma from the University of Münster, Germany — a new open source software to extract information about land-cover changes from satellite images. The tool maps different crop types (e.g., soybean, maize, and wheat), forests, and grassland, and can be used to support land-use monitoring and planning.
Our software, called dtwSat, is open-source and can be freely installed and used for academic and commercial purposes. It builds upon on other graphical and statistical open-source extensions of the statistical program R. Adding to that, our article in press in Journal of Statistical Software is completely reproducible and provides a step-by-step example of how to use the tool to produce land-cover maps. Given that we have public access to an extensive amount satellite images, we also get much benefit from tools that are openly available, reproducible, and comparable. These, in particular, can contribute to rapid scientific development.
The software dtwSat is based on a method widely used for speech recognition called Dynamic Time Warping (DTW). Instead of spoken words, we adapted DTW to identify ‘phenological cycles’ of the vegetation. These encompass the plants’ life cycle events, such as how deciduous trees lose their leaves in the fall. The software compares a set of phenological cycles of the vegetation measured from satellite images (just like a dictionary of spoken words) with all pixels in successive satellite images, taken at different times. After comparing the satellite time series with all phenological cycles in the dictionary, dtwSat builds a sequence of the land-cover maps according to similarity to the phenological cycles.
The series of maps produced by dtwSat allows for land-cover change monitoring and can help answer questions such as how much of the Amazon rainforest has been replaced with soy or grass for cattle grazing during the last decade? It could also help study the effects of policies and international agreements, such Brazil’s Soy Moratorium, where soybean traders agreed not to buy soy from areas deforested after 2006 in the Brazilian Amazon. If soy farming cannot expand over areas deforested after 2006, it might expand to areas formerly used for cattle grazing deforested before 2006, and force the cattle grazing farmers to open new areas that have been cleared more recently. Therefore, besides monitoring changes, the land-cover information can help better understand direct and indirect drivers of deforestation and support new land-use policy.
Further info: dtwSat is distributed under the GPL (≥2) license. The software is available from the IIASA repository PURE pure.iiasa.ac.at/14514/. Precompiled binary available from CRAN at cran.r-project.org/web/packages/dtwSat/index.html
dtwSat development version available from GitHub at github.com/vwmaus/dtwSat
Reference:
Maus V, Camara G, Appel M, & Pebesma E (2017). dtwSat: Time-Weighted Dynamic Time Warping for Satellite Image Time Series Analysis in R. Journal of Statistical Software (In Press).
Maus, V, Camara, G, Cartaxo, R, Sanchez, A, Ramos, FM, & de Queiroz, GR (2016). A Time-Weighted Dynamic Time Warping Method for Land-Use and Land-Cover Mapping. IEEE Journal of Selected Topics in Applied Earth Observations and Remote Sensing 9 (8): 3729–39.
This article gives the views of the author, and not the position of the Nexus blog, nor of the International Institute for Applied Systems Analysis.
Jun 21, 2017 | Data and Methods
By Luke Kirwan, IIASA open access manager
At this year’s European Geosciences Union a panel of experts convened to debate the benefits of open science. Open science means making as much of the scientific output and processes publicly visible and accessible, including publications, models, and data sets.

Open science includes not just open access to research findings, but the idea of sharing data, methods, and processes. ©PongMoji | Shutterstock
In terms of the benefits of open science the panelists—who included representatives from academia, government, and academic publishing—generally agreed that openness favors increased collaboration and the development of large networks, especially in terms of geoscience data, which improves precision in the interpretation of results. There is evidence that sharing data and linking to publications increases both readership and citations. A growing number of funding bodies and journals are also requiring researchers to make the data underlining a publication as publicly available as possible. In the context of Horizon 2020, researchers are instructed to make their data ‘as open as possible, as closed as necessary.’
This statement was intentionally left vague, because the European Research Council (ERC) realized that a one size fits all approach would not be able to cover the entirety of research practices across the scientific community, said Jean-Paul Bourguignon, president of the ERC.
Barbara Romanowicz from Collège de France and Institut de Physique du Glove de Paris also pointed to the need for disciplines to develop standardized metadata standards and a community ethic to facilitate interoperability. She also pointed out that the requirements for making raw data openly accessible are quite different to those for making models accessible. These problems require increased resources to be adequately addressed.
Roche DG, Lanfear R, Binning SA, Haff TM, Schwanz LE, Cain KE, Kokko H, Jennions MD, Kruuk LEB (2014). Troubleshooting public data archiving: suggestions to increase participation. PLOS Biology. 12 (1): e1001779. doi:10.1371/journal.pbio.1001779.
Playing devil’s advocate, Helen Glaves from the British Geological Survey pointed to several areas of potential concern. She questioned whether the costs involved in providing long-term preservation and access to data are the most efficient use of taxpayers money. She also suggested that charging for access could be used to generate revenues to fund future research. However, possibly a more salient concern for researchers that she raised was the fear of scientists that making their data and research available in good faith, could allow their hard work to be passed off by another researcher as their own.
Many of these issues were raised by audience members during the questions and answer session. Scientists pointed out that research data involved a lot of hard work to collate, they had concerns about inappropriate secondary reuse, jobs and research grants are highly competitive. However, the view was also expressed that paying for access to research fundamentally amounts to ‘double taxation’ if the research has been funded by public money, and that even restrictive sharing is better than not sharing at all. It was also argued that incentivising sharing through increased citations and visibility would both help encourage researchers to make their research more open and aide researchers in the pursuit of grants or research positions. To bring about these changes in research practices will involve investing in training the next generation of scientists in these new processes.
Here at IIASA we are fully committed to open access and in the library, we assist our researchers with any queries or issues they may have with widely sharing their research. As well as improving the visibility of research publications through Pure, our institutional repository, we can also assist with making research data discoverable and citable.
A video of the discussion is available on YouTube.
This article gives the views of the author, and not the position of the Nexus blog, nor of the International Institute for Applied Systems Analysis.

You must be logged in to post a comment.