Notice: Function wp_maybe_inline_styles was called incorrectly. Unable to read the "path" key with value "https://blog.iiasa.ac.at/wp-content/plugins/jetpack/_inc/build/subscriptions/subscriptions.min.css" for stylesheet "jetpack-subscriptions". Please see Debugging in WordPress for more information. (This message was added in version 7.0.0.) in /opt/wpprojects.iiasa.ac.at/wordpress/wp-includes/functions.php on line 6170
By Shonali Pachauri, Senior Researcher in the IIASA Energy Program
Shonali Pachauri explains why data, indicators, and monitoring at finer scales are important to ensure that everyone benefits from policies and efforts aimed at achieving national and global development goals.
A world where no one is left behind by 2030, is the promise nations have made by adopting the United Nations’ Agenda for Sustainable Development. But how does one ensure that no one is left behind? It requires designing inclusive policies and programs that target the most vulnerable and marginalized regions and populations. Sound data and indicators underpin our current understanding of the status of development and are an important part of periodic reviews to determine the direction and pace of progress towards achieving agreed goals. These form the basis of informed decisions and evidence-based policymaking. While an exhaustive list of indicators has been prescribed to monitor progress towards the globally agreed goals, these have been largely defined at a national scale. These goals rely overwhelmingly on simple averages and aggregates that mask underlying variations and distributions.
Recent work I’ve been involved in makes the pitfalls of working with averages and aggregates alone abundantly clear. They can obscure uneven patterns of changes and impacts across regions and groups within the same nation. The overall conclusion of this work is that, even if the globally agreed goals are met by 2030, this is no guarantee that everyone will benefit from their achievement.
A recent Nature Energy –News & Views piece I was invited to write reports on a study that assessed the impacts of China’s recent coal to electricity program across villages in the Beijing municipal region. The program subsidizes electricity and electric heat pumps and has been rolling out a ban on coal use for household heating. The study found that the benefits of the program to home comfort, air quality, and wellbeing varied significantly across rich and poor districts. In poor districts, the study found that the ban was not effective as poor households were still unable to afford the more expensive electric heating and were continuing to rely on coal. Studies such as this one that help us understand how and why benefits of a program may vary across regions or population groups can aid policy- and decision makers in formulating more fair and inclusive policies.
In other recent research carried out with colleagues in the IIASA Energy Program, the Future Energy Program at the Fondazione Eni Enrico Mattei (FEEM) in Italy, and the Institute for Integrated Energy Systems at the University of Victoria, Canada, we developed a detailed satellite nightlights derived dataset to track progress with providing electricity access at a sub-national level in Africa. We found that while progress with electrification between 2014 and 2018 varied across nations, at a sub-national provincial level, disparities were even more pronounced. Even more surprising, while electricity access is generally higher and easier to extend in urban areas, we found urban pockets where access has stagnated or even worsened. This correlated with areas where in-migration of populations had been high. These areas likely include urban slums or peri-urban regions where expanding electricity access continues to be challenging. Furthermore, our analysis shows that even where access has been extended, there are regions where electricity use remains extremely low, which means that people are not really benefitting from the services electricity can provide.
In a final example, of research carried out with collaborators from the University of British Columbia and the Stockholm Environment Institute, we evaluated a large nationwide program to promote cooking with liquefied petroleum gas (LPG) in Indian households to induce a shift away from the use of polluting solid fuels. While this program specifically targets poor and deprived, largely rural households, our assessment found that although there has been an unprecedented increase in enrollments of new LPG customers under the program, this has not been matched by an equal increase in LPG sales. In fact, we found consumption of LPG by program beneficiaries was about half that of the average rural consumer. Moreover, when we examined how purchases were distributed across all new consumers, we found that about 35% of program beneficiaries purchased no refills during the first year and only 7% bought enough to substitute half or more of their total cooking energy needs with LPG. Clearly, the health and welfare benefits of a transition to cleaner cooking are still to be realized for most people covered by this program.
Analyses, such as the examples I’ve discussed here, clearly highlight that we need data, indicators, and monitoring at much finer scales to really assess if all regions and populations are benefitting from policies and efforts to achieve national and globally agreed development goals. Relying on aggregates and averages alone may paint a picture that hides more than it reveals. Thus, without such finer-scale analysis and an understanding of the distributional impacts of policies and programs, we may end up worsening inequalities and leaving many behind.
References:
[1] Pachauri S (2019). Varying impacts of China’s coal ban. Nature Energy 4: 356-357. [pure.iiasa.ac.at/15905]
[2] Falchetta G, Pachauri S, Parkinson S, & Byers E (2019). A high-resolution gridded dataset to assess electrification in sub-Saharan Africa. Scientific Data 6 (1): art. 110. [pure.iiasa.ac.at/15982]
[3] Kar A, Pachauri S, Bailis R, & Zerriffi H (2019). Using sales data to assess cooking gas adoption and the impact of India’s Ujjwala program in rural Karnataka. Nature Energy [pure.iiasa.ac.at/15994]
Note: This article gives the views of the author, and not the position of the Nexus blog, nor of the International Institute for Applied Systems Analysis.
Rachel Potter, IIASA communications officer, interviews retired NASA Astronaut and Principal of AstroPlanetview LLC, Sandra H Magnus on insights about our world she has gained from her time living on the International Space Station.
Q: Can you tell us a bit about your specific areas of research as a scientist?
A: My PhD was on a new material system being investigated for thermionic cathodes, which are used as electron sources for satellite communication systems. My research was an effort to look at the system methodically and from a science viewpoint to understand physically what was going on in order to inform the design of more robust devices. If you can operate the cathode at a lower temperature, that means a longer life for it, which is a good thing for satellites! Post-PhD I was however admitted to the Astronaut Office and that, quite frankly, pretty much put an end to my career as a researcher, or at least as a principal investigator (PI). The work I did on the International Space Station was at the direction of other PIs who had proposed, and been granted, experiments in space.
Q: Your career has spanned a wide range of settings from the NASA Astronaut Corps to your current role as Principal of AstroPlanetview LLC – what is the common thread or focus that has run through your work?
A: Following my curiosity and looking for challenges. I always want to be challenged and feel that I am learning new things. If I feel that I have become stagnant, I start looking for how to change that situation.
Q: What have been the personal highlights of your career?
A: Clearly flying in space! I feel very fortunate, however, to have been in the Astronaut Office during the era of the space station. I enjoyed very much working in a collaborative, multicultural, international environment where we had a big team of people from around the world working on something that benefits the planet.
Q: What are the greatest lessons you have learned from seeing the Earth from space?
A: I was so excited to FINALLY be going into space after hoping to do just that for over 20 years. The Earth is our spaceship – a closed system in which everything on the planet affects, and is connected to everything else on the planet. An action somewhere means a reaction somewhere else, even if it is not always first order (and usually it is not). Also, the planet looks incredibly beautiful and very fragile – we have to take care of it!
Q: What do you see as key to solving the complex problems the Earth faces in terms of sustainability?
A: Having the will to do it as a community. If you have the will, commitment and a clear, agreed-to, articulation of the common goal, we can pretty much accomplish anything we want to.
Q: How do you see IIASA being able to build bridges between countries across political divides?
A: Well, when we want to solve problems, it really is all about relationships at the end of the day. It is easy to demonize or keep your distance from abstract ideas or the ubiquitous “They” but when you meet people, understand them as individuals and the context of their backgrounds that lead them to have different views and approaches to life and solving problems, it is much easier to visualize how you can work together to tackle issues. The relationships are the bridges.
Q: What advice would you give to young women researchers wanting to make it into Aeronautics?
A: To young women (and young men, too, really) I would say, “If you have a dream to go do something, then you owe it to yourself to go for it and try it!” Never let anyone else define who you are or tell you what you can or cannot do – believe in yourself and give it a try. Maybe you will make it, maybe you will not, but it will be on your own terms, with you pushing yourself and regardless of the outcome you will have a deeper understanding of yourself, and that is always a good thing.
Sandra H Magnus visited IIASA on 21 June 2019 in cooperation with the US Embassy Vienna, to give a lecture entitled “Perspectives from Space” to IIASA staff and this year’s participants of the IIASA Young Scientists Summer Program. IIASA has a worldwide network of collaborators who contribute to research by collecting, processing, and evaluating local and regional data that are integrated into IIASA models. The institute has 819 research partner institutions in member countries and works with research funders, academic institutions, policymakers, and individual researchers in national member organizations.
Notes: This article gives the views of the authors, and not the position of the Nexus blog, nor of the International Institute for Applied Systems Analysis.
By Junko Mochizuki, researcher with the IIASA Risk and Resilience Program
IIASA researcher Junko Mochizuki writes about her recent research in which she and other IIASA colleagues developed an indicator to help identify vulnerable countries that should be prioritized for human development and disaster risk reduction interventions.
Working as part of an interdisciplinary team at IIASA, it is not uncommon for researchers to uncover disciplinary blind spots that would otherwise have gone unnoticed. This usually leads to a conversation that goes something like, “If only we could learn from the other disciplines more often, we can create more effective theories, methods, and approaches.”
My recently published paper with Asjad Naqvi from the IIASA Advanced Systems Analysis Program titled Reflecting Risk in Development Indicators was the fruit of such an exchange. In one afternoon, our coffee conversation hypothesized various reasons as to why the disaster risk discipline continued to create one risk indicator after another while the development community remained silent on this disciplinary advancement and did not seem to be incorporating these indicators into ongoing research in their own field.
Global ambitions such as the Sustainable Development Goals (SDGs) and Sendai Framework for Disaster Risk Reduction call for disaster mainstreaming, in other words, that disaster risk be assessed and managed in combination with any development planning efforts. For various reasons, we however continue to measure development and disasters separately. We know that globally the poor are more exposed to risk and that disasters hurt development, but there was not a single effective measure that captured this interlinkage in an easy-to-grasp manner. Our aim was therefore to demonstrate how this could be done using the information on disasters and development that we already have at our disposal.
The Human Development Indicator (HDI) is a summary measure of average attainment in key dimensions of human development – education, life expectancy, and per capita income indicators – that are used to rank countries into four tiers of human development. Using the HDI as an example, Asjad and myself compiled global datasets on human development, disaster risk, and public expenditure, and developed a method to discount the HDI indicator for 131 countries globally – just as others have done to adjust for income– and gender-inequality. Discounting the HDI indicator for education, for instance, involves multiplying it by the annual economic value of the average loss in terms of education facilities, divided by the annual public expenditure on education. We did this for each dimension of the HDI.
Conceptually, the indicator development was an intriguing exercise as we and our reviewers asked interesting questions. These included questions about the non-linearity of disaster impact, especially in the health sector, such as how multiple critical lifeline failures may lead to high death tolls in the days, weeks, and even months following an initial disaster event. Other issues we examined were around possibilities for the so-called build-back-better approach, which offers an opportunity to create better societal outcomes following a disaster.
Our formulation of the proposed penalty function hardly captures these complexities, but it nevertheless provides a starting point to debate these possibilities, not just among disaster researchers, but also among others working in the development field.
For those familiar with the global analysis of disaster risk, the results of our analysis may not be surprising: disasters, unlike other development issues (such as income- and gender inequalities for which HDI have been reformulated), have a small group of countries that stand out in terms of their relative burdens. These are small island states such as Belize, Fiji, and Vanuatu, as well as highly exposed low and lower-middle income countries like Honduras, Madagascar, and the Philippines, which were identified as hotspots in terms of risk-adjustments to HDI. Simply put, this means that these countries will have to divert public and private funds to pay for response and recovery efforts in the event of disasters, where these expenses are sizeable relative to the resources they have in advancing the three dimensions of the HDI indicator. Despite their high relative risk, the latter countries also receive less external support measured in terms of per capita aid-flow.
Our study shows that global efforts to promote disaster risk reduction like the Sendai Framework should be aware of this heterogeneity and that more attention in the form of policy support and resource allocation may be needed to support groups of outliers. Finally, although the cost of most disasters that occur globally are small relative to the size of most countries’ national economies, further sub-national analysis will help identify highly vulnerable areas within countries that should be prioritized for development and disaster risk reduction interventions.
Reference:
Mochizuki J & Naqvi A (2019). Reflecting Disaster Risk in Development Indicators. Sustainability 11 (4): e996 [pure.iiasa.ac.at/15757]
Note: This article gives the views of the author, and not the position of the Nexus blog, nor of the International Institute for Applied Systems Analysis.
By Kejia Hu, PhD Candidate at Zhejiang University, China and IIASA Young Scientists Summer Program (YSSP) 2016 participant
Kejia Hu, an alumna of the IIASA Young Scientists Summer Program, discusses a recent study on how extreme temperatures affect the health risks experienced by urban and rural communities in China.
Hot and cold temperatures are associated with increased risks of cause-specific mortality, in other words, deaths that result from, for instance, cardiovascular and respiratory conditions. Due to the urban heat island effect – where an urban heat island is a city or metropolitan area that is significantly warmer than its surrounding rural areas due to human activity – it is commonly assumed that urban residents are at a higher risk of exposure to extreme heat than their rural neighbors are. Very few studies have explored the urban-rural differences of temperature-related health risks, often because of the lack of sufficient meteorological and health data in rural areas.
Today, 45% of the global population – nearly 3.4 billion people – still live in rural regions, and based on the UN’s World Urbanization Prospects 2018, there will still be more than 3 billion people living in these areas by 2050, despite current trends such as urbanization.
This made us wonder whether there could be a rural-urban gap in extreme temperature induced health risk. We decided to conduct a study to address this question in Zhejiang province in eastern China employing high spatial resolution data on temperature, death registrations, air pollution, and population density across 89 counties in Zhejiang from 2009 to 2015.
Based on an epidemiological analysis of more than 2 million death cases, we found that rural residents are more sensitive to both cold and hot temperatures than urban residents, and that extreme temperatures especially affect the elderly. Our results indicate that extreme cold temperatures increased the mortality rate by 98% for rural populations, and by 47% for urban populations, while extremely hot temperatures increased the mortality rate by 18% for rural populations and by 14% for urban populations. When considering both human exposure and vulnerability, the attributable deaths from cold and hot temperatures were 4.8 and 2.6 times higher in rural than in urban areas, respectively.
But why do rural populations tend to have higher mortality risks in the face of both cold and heat? Our results suggest that age, education, income, access to health care services and air conditioners, and the types of occupations that residents in these areas engage in, are among the potential sources. We found that counties with higher percentages of elderly and agricultural employment, lower levels of education, lower income levels, fewer hospital beds, and fewer air conditioners, had higher mortality risks related to both heat and cold. This could mean that socioeconomic vulnerability may play an important role – even more important than temperature in the determinants of temperature-related health risks.
Ours is the first study to find an urban–rural disparity in both heat and cold mortality risks. Importantly, it challenges the general assumption in previous studies in developed countries that urban residents are at a higher risk to extreme high temperatures. Our findings suggest that previous studies, which mostly investigated exposure-response associations using data from urban areas, may have underestimated the mortality burden for the entire population.
Although the Chinese government have standards in place regarding thermal comfort in residential buildings and highly recommend that they are implemented for rural houses, unfortunately, until now, this has only been enforced for urban apartments in China. In addition, due to lower income, rural households are more likely to fall into “fuel poverty” compared to urban households, which will limit the use of air conditioners for rural people. Targeted measures such as financial assistance for paying electricity bills will help build rural residents’ resilience to extreme temperatures.
Our findings have important implications for policy, particularly in developing countries. Overall, no single action will be enough to reduce the temperature-related mortality risks in rural areas. More efforts should be made to narrow the urban-rural gaps that persist in access to health care by, for example, increasing investment in health care facilities and health care professionals in rural areas. Improving rural people’s general awareness of temperature related risks, such as to popularize preventive knowledge and to develop early warning systems is also needed to prevent temperature-related deaths.
Reference:
Hu K, Guo Y, Hochrainer-Stigler S, Liu W, See L, Yang X, Zhong J, Fei F, et al. (2019). Evidence for Urban–Rural Disparity in Temperature–Mortality Relationships in Zhejiang Province, China. Environmental Health Perspectives 127 (3): e037001. [pure.iiasa.ac.at/15773]
Note: This article gives the views of the author, and not the position of the Nexus blog, nor of the International Institute for Applied Systems Analysis.
By Barbara Willaarts, researcher with the IIASA Water Program
On World Water Day 2019, IIASA researcher Barbara Willaarts tells us more about how our dietary choices can contribute towards reaching the UN’s Sustainable Development Goal 6: Water for all by 2030.
The theme chosen for World Water Day 2019 is “Leaving no one behind”. As the UN emphasizes, this year is very much about reminding ourselves that there are still considerable efforts required to provide clean water, sanitation, and hygiene for all people across the globe.
While there is no question about the fact that we should push our governments and decision makers to pursue the fundamental human right of access to clean water, bringing forward the sustainable development water agenda – specifically Sustainable Development Goal (SDG) 6 : Water for all by 2030 – requires that action is taken on multiple fronts. Securing access and sanitation, is a top priority, but how we manage the water we have access to, is also fundamental.
Related video:
The first key message here is that a lot of the actions that are required to overcome many of the global water challenges like water scarcity, pollution, and ecosystem degradation, actually do not require expensive government interventions. Many rely on us, on the choices that we make as citizens and consumers in our day-to-day activities. What we wear, how we eat, or what we buy and where we buy it, are daily personal decisions, and these can make a huge difference when it comes to achieving the sustainable development agenda and in particular, SDG6.
In the past years I have conducted various research projects looking into the footprints of our lifestyles, particularly in western societies. The aim behind these investigations was not only to quantify impacts to raise awareness, but also to use this information to define benchmarks for sustainable consumption.
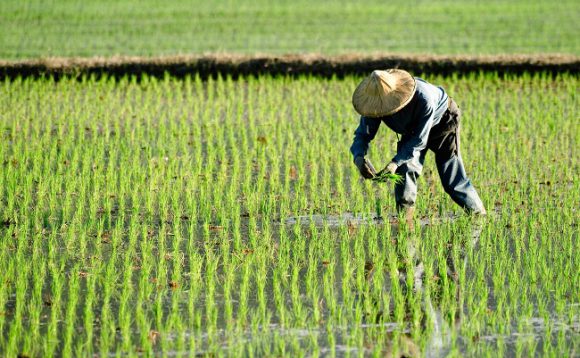
Being Dutch, it is not strange that I have developed my professional career in the water sector, and living in Spain (the most arid country in the EU) for many years has only deepened my interest in looking into drivers of and solutions to global water scarcity. Anyone working in this field will quickly agree that exploring solutions to water scarcity problems very often implies looking at solutions related to the way we produce and consume agricultural products.
There is a bunch of interesting literature out there assessing solutions to increase the efficiency of agricultural production systems and pathways to reduce its environmental footprint. Approaching the food problem from a consumption perspective, however, is an arena that researchers only recently started to explore. This is promising because, firstly, the benefits of improving consumption patterns might outweigh those achieved through efficiency gains. Secondly, this science often conveys messages that are easy to grasp and implement, for example, eat meat only once a week, buy local, and eat five a day of vegetables and fruits. Lastly, it also empowers citizens as the main actors of the social change that is required to meet the sustainability agenda.
With that said, I would like to reflect on a recent study led by colleagues from the Polytechnic University of Madrid and the Food and Agricultural Organization, that I was involved in. The research in question is about the water and nutritional implications of shifting diets, and we used Spain as a case study. The choice of the case study was driven by the fact that Spain, like other Mediterranean countries, is often recognized and valued for its fresh, locally grown, and healthy diets. The reality is however that, while it has been so for many years, things across the Mediterranean, and particularly in Spain, have changed substantially after the 70s as a result of a number of drivers including increasing migration to cities, incorporation of more women into the labor force, work-life imbalance, and food trade openness.
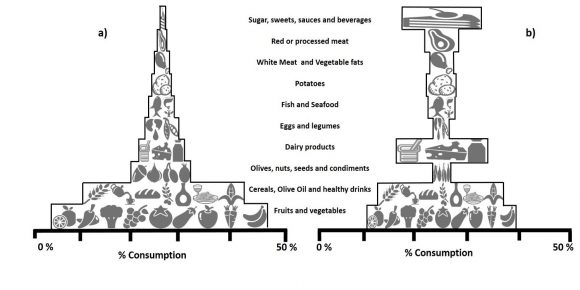
According to the results of our study, the dietary shift in Spain is such that current diets resemble an inverted food pyramid, with households eating 15% more meat, beverages, and sugar products and 37% less fruits and vegetables on a daily basis than what is actually recommended by the Mediterranean dietary guidelines. The effect of this shift is that today, Spain ranks fifth in the EU of countries with the highest prevalence of obesity and overweight.
These dietary shifts have all sorts of nutritional and environmental implications. From a nutritional perspective, current diets contain 17% more kilocalories (Kcal) – meaning units of energy – than the recommended intake, as well as a 36% higher content of macro-nutrients like fats and proteins. On the other extreme, the intake of essential micro-nutrients like vitamins and minerals has decreased sharply by 40%.
From a water perspective, the observed dietary shifts have increased the water footprint of food consumption by 34%, which is equivalent to seven times the daily per capita consumption of domestic water. An interesting finding here is that current dietary patterns are not just more water intense, but also more international, since over 40% of water “eaten” is from imported food products. This basically means that the Spanish food basket is no longer local but is increasingly being filled with foreign land, biodiversity, and water resources.
Spain is not a unique case and it is very likely that similar trends are occurring across other European and developed countries. This clearly evidences that what we eat matters a lot – to our health and to our environment. Most importantly, you and I have the capacity to make the difference. Eat healthy, eat sustainably, and don’t leave yourself behind!
Note: This article gives the views of the author, and not the position of the Nexus blog, nor of the International Institute for Applied Systems Analysis.
Quantitative models are an important part of environmental and economic research and policymaking. For instance, IIASA models such as GLOBIOM and GAINS have long assisted the European Commission in impact assessment and policy analysis2; and the energy policies in the US have long been guided by a national energy systems model (NEMS)3.
Despite such successful modelling applications, model criticisms often make the headlines. Either in scientific literature or in popular media, some critiques highlight that models are used as if they are precise predictors and that they don’t deal with uncertainties adequately4,5,6, whereas others accuse models of not accurately replicating reality7. Still more criticize models for extrapolating historical data as if it is a good estimate of the future8, and for their limited scopes that omit relevant and important processes9,10.
Validation is the modeling step employed to deal with such criticism and to ensure that a model is credible. However, validation means different things in different modelling fields, to different practitioners and to different decision makers. Some consider validity as an accurate representation of reality, based either on the processes included in the model scope or on the match between the model output and empirical data. According to others, an accurate representation is impossible; therefore, a model’s validity depends on how useful it is to understand the complexity and to test different assumptions.
Given this variety of views, we conducted a text-mining analysis on a large body of academic literature to understand the prevalent views and approaches in the model validation practice. We then complemented this analysis with an online survey among modeling practitioners. The purpose of the survey was to investigate the practitioners’ perspectives, and how it depends on background factors.
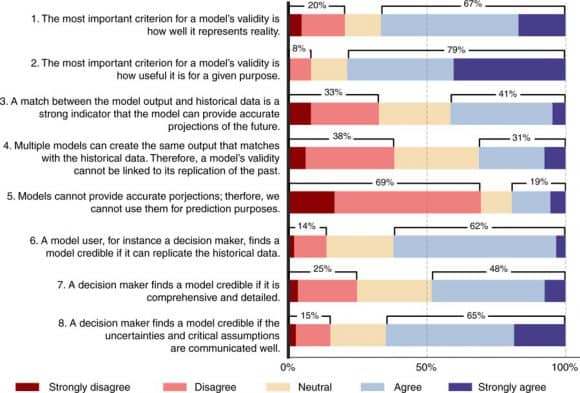
According to our results, published recently in Eker et al. (2018)1, data and prediction are the most prevalent themes in the model validation literature in all main areas of sustainability science such as energy, hydrology and ecosystems. As Figure 1 below shows, the largest fraction of practitioners (41%) think that a match between the past data and model output is a strong indicator of a model’s predictive power (Question 3). Around one third of the respondents disagree that a model is valid if it replicates the past since multiple models can achieve this, while another one third agree (Question 4). A large majority (69%) disagrees with Question 5, that models cannot provide accurate projects, implying that they support using models for prediction purposes. Overall, there is no strong consensus among the practitioners about the role of historical data in model validation. Still, objections to relying on data-oriented validation have not been widely reflected in practice.
Figure 1: Survey responses to the key issues in model validation. Source: Eker et al. (2018)
According to most practitioners who participated in the survey, decision-makers find a model credible if it replicates the historical data (Question 6), and if the assumptions and uncertainties are communicated clearly (Question 8). Therefore, practitioners think that decision makers demand that models match historical data. They also acknowledge the calls for a clear communication of uncertainties and assumptions, which is increasingly considered as best-practice in modeling.
One intriguing finding is that the acknowledgement of uncertainties and assumptions depends on experience level. The practitioners with a very low experience level (0-2 years) or with very long experience (more than 10 years) tend to agree more with the importance of clarifying uncertainties and assumptions. Could it be because a longer engagement in modeling and a longer interaction with decision makers help to acknowledge the necessity of communicating uncertainties and assumptions? Would inexperienced modelers favor uncertainty communication due to their fresh training on the best-practice and their understanding of the methods to deal with uncertainty? Would the employment conditions of modelers play a role in this finding?
As a modeler by myself, I am surprised by the variety of views on validation and their differences from my prior view. With such findings and questions raised, I think this paper can provide model developers and users with reflections on and insights into their practice. It can also facilitate communication in the interface between modelling and decision-making, so that the two parties can elaborate on what makes their models valid and how it can contribute to decision-making.
Model validation is a heated topic that would inevitably stay discordant. Still, one consensus to reach is that a model is a representation of reality, not the reality itself, just like the disclaimer of René Magritte that his perfectly curved and brightly polished pipe is not a pipe.
References
Eker S, Rovenskaya E, Obersteiner M, Langan S. Practice and perspectives in the validation of resource management models. Nature Communications 2018, 9(1): 5359. DOI: 10.1038/s41467-018-07811-9 [pure.iiasa.ac.at/id/eprint/15646/]
Nuccitelli D. Climate scientists just debunked deniers’ favorite argument. The Guardian. 2017. https://www.theguardian.com/environment/climate-consensus-97-per-cent/2017/jun/28/climate-scientists-just-debunked-deniers-favorite-argument
Notice: Function wp_maybe_inline_styles was called incorrectly. Unable to read the "path" key with value "https://blog.iiasa.ac.at/wp-content/plugins/jetpack/_inc/build/subscriptions/subscriptions.min.css" for stylesheet "jetpack-subscriptions". Please see Debugging in WordPress for more information. (This message was added in version 7.0.0.) in /opt/wpprojects.iiasa.ac.at/wordpress/wp-includes/functions.php on line 6170


 These dietary shifts have all sorts of nutritional and environmental implications. From a nutritional perspective, current diets contain 17% more kilocalories (Kcal) – meaning units of energy – than the recommended intake, as well as a 36% higher content of macro-nutrients like fats and proteins. On the other extreme, the intake of essential micro-nutrients like vitamins and minerals has decreased sharply by 40%.
You must be logged in to post a comment.