Aug 26, 2020 | Alumni, Climate Change, History, USA, Young Scientists
By Marcus Thomson, IIASA alumnus and a researcher at the National Center for Ecological Analysis and Synthesis (NCEAS), the University of California, Santa Barbara
IIASA alumnus Marcus Thomson explains how what we have learnt about prehistoric farming cultures can be used to provide useful insights on human societal responses to climate change.
The climate of the western half of the North American continent, between the Rocky Mountains and the Pacific coastal region, is dry by European standards. The American Southwest, in particular, centered roughly on the intersection of the states of Colorado, New Mexico, Arizona, and Utah, is predominantly desert between high mountain plateaus. It is, and has always been, a challenging environment for farmers. Yet the prehistoric Southwest was home to complex maize-based agricultural societies. In fact, until the 19th century growth of industrial cities like New York, the Southwest contained ruins of the largest buildings north of Mexico — and these had been abandoned centuries before the Spanish arrived in the Americas.
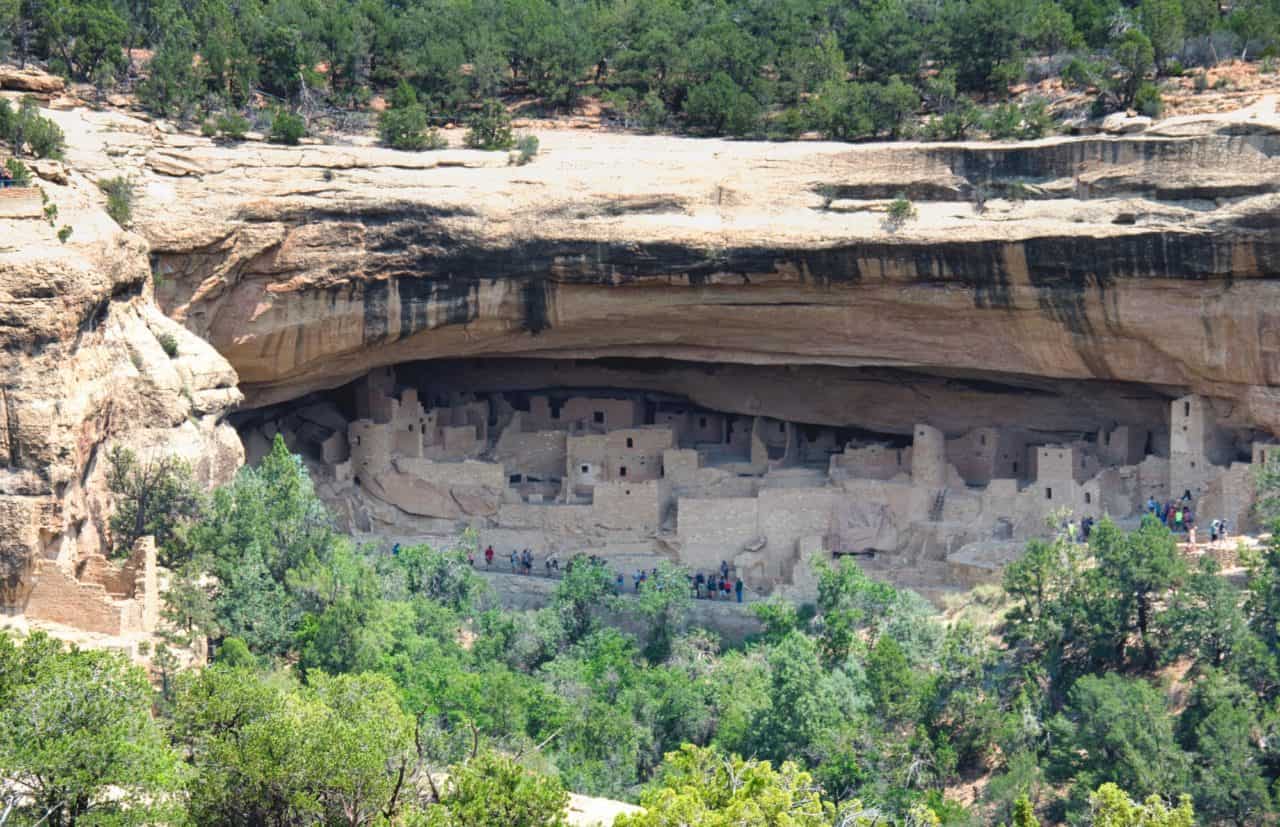
© Mudwalker | Dreamstime.com
For more than a century, researchers have pored over data, from proxies of paleo-environmental change, to historiographies collected by explorers, to archaeology and computational models of human occupation, and produced a detailed picture of the socio-environmental, economic, and climatic conditions that could explain why these sites were abandoned. While details vary in fine-grained analyses of the various sub-groupings of peoples in the region, the big picture is one of societal transformation in adapting to climate change.
Also important is just how the climate changed during the period, because similar dynamics are expected to emerge in the future as a consequence of global warming. European historians point to a medieval era with generally warmer mean annual temperatures. In the Southwestern United States however, which is more sensitive to changes in drought than temperature, the period between roughly AD 850 to 1350 is known as the Medieval Climate Anomaly (MCA). The warm, dry MCA was followed by a long stretch of increased changes in the availability of water, known as the Little Ice Age (LIA). More frequent “warm droughts” at the end of the MCA, and generally increasing changes in water resources at the onset of the LIA, is thought to be a good analogy for future conditions in western North America.
When I had the good fortune to visit IIASA as a participant of the Young Scientists Summer Program (YSSP) in 2016, I worked with research scholars Juraj Balkovič and Tamás Krisztin to develop a model of ancient Fremont Native American maize. The Fremont were an ancient forager-farmer people who lived in the vicinity of modern Utah. We used a climate model reconstruction of the temperature and rainfall between AD 850 and 1450 to drive this maize crop model, and compared modeled crop yields against changes in radiocarbon-derived occupations – in other words, the information gathered from carbon dated artifacts that show that an area was occupied by a particular people – from a few archaeological areas in Utah.

© Galyna Andrushko | Dreamstime.com
Among our findings was that changes in local temperatures appeared to play a larger role in the lives, practices and habits of the people who lived there than changes in regional, long-term temperature conditions [1]. Later, while a researcher at IIASA myself, I returned to the subject with one of our coauthors, professor Glen MacDonald of the University of California, Los Angeles, using an expanded geographic range and a more sophisticated treatment of radiocarbon dated occupation likelihoods.
We used the climate model to reconstruct prehistoric maize growing season lengths and mean annual rainfall for Fremont sites. We found that the most populous and resilient Fremont communities were at sites with low-variability season lengths; and low populations coincided with, or followed, periods of variable season lengths. This study confirmed the important dependence on climate variability; and more importantly, our results are in line with others on modern smallholder farming contexts.
More details on our latest study [2] have just been published online in Environmental Research Letters (ERL). It will become part of an ERL special issue looking at societal resilience drawing lessons from the past 5000 years. Studies like these can give useful insights on human societal responses to climate change because these ancient civilizations are, in a sense, completed experiments with complex human-environmental systems. For decision makers, who must plan early to commit resources to offset the effects of future climate change on smallholder farmers in similarly drought-sensitive, marginally productive environments, these studies indicate that year-to-year climatic variability drives occupation change more than long-term temperature change.
References:
[1] Thomson MJ, Balkovič J, Krisztin T, & MacDonald GM (2019). Simulated impact of paleoclimate change on Fremont Native American maize farming in Utah, 850–1449 CE, using crop and climate models. Quaternary International, 507, pp.95-107 [pure.iiasa.ac.at/15472]
[2] Thomson MJ, & MacDonald GM (In press). Climate and growing season variability impacted the intensity and distribution of Fremont maize farmers during and after the Medieval Climate Anomaly based on a statistically downscaled climate model. Environmental Research Letters.
Note: This article gives the views of the author, and not the position of the Nexus blog, nor of the International Institute for Applied Systems Analysis.
Aug 19, 2020 | Climate Change, COVID19, USA, Wellbeing, Young Scientists
By Lisa Thalheimer, 2020 IIASA Young Scientists Summer Program (YSSP) participant in the Risk and Resilience and World Population Programs
Lisa Thalheimer shares her journey in researching climate-related migration in the age of the COVID-19 pandemic and the importance of taking mental health issues into account in climate science and the policy realm.

© Raul Mellado Ortiz | Dreamstime.com
COVID-19 has changed our idea of normal. These unprecedented, stressful times affect us all – some of us more than others. Fear and anxiety over a new disease without any promise of a vaccine anytime soon, global economic downturn, along with feelings of loneliness and emotional exhaustion due to the lockdown, can leave us mentally exhausted. Rates of depression and addiction-related suicide are in fact already on the rise among young people like myself.
Now imagine you are advised to stay at home, but you cannot do so because climate change has turned your entire life upside down: your house is no longer there, you have lost your job, your family or friends – you are likely to feel unhinged. This is a reality for many migrants across the globe. It is inevitable that existing migration patterns will be shifted beyond disasters alone. Cascading impacts form the still unfolding pandemic could compound. No matter if you are a migrant yourself or not, agency and the choice over the decision whether to leave your house or not, and the luxury to socially distance could potentially not be an option with a systemic shock like COVID-19.
These changes in circumstances have also affected me as a young scientist. I would have been in Laxenburg, getting to know my YSSP peers and IIASA colleagues, but this year’s journey has been rewritten – courtesy of the COVID-19 pandemic.
I was living in Oxford in the UK when I came to realise that mental health is a game changer in the way I manage my day, make decisions, my ability to care for my partner who suffers from Amyotrophic Lateral Sclerosis (ALS), and making progress on my PhD thesis. Everything felt more difficult. I was overwhelmed. I wanted to understand why this is the case. My interest soon evolved into researching the links between mental health and my PhD topic of climate-related migration.
For the article “The hidden burden of pandemics, climate change and migration on mental health”, I teamed up with an epidemiologist who specialises in mental health at my old university home, the Earth Institute in New York City. This research experience was an eye-opener, both personally and scientifically.
In our article, we focused on the US, as it has been hit hardest by COVID-19 – in mid-August, the number of COVID-19 cases exceeded five million. On top of this, depression and anxiety are already prominent among Americans, as is costly impacts from disasters. Hurricanes cost the US around US$ 17 billion every year, but estimates show a higher probability of extremely damaging hurricane seasons with climate change. We may know the impact of climate change on assets and on physical health, but what about mental health impacts?

© Raggedstonedesign | Dreamstime.com
Although my coauthor and I come from different scientific disciplines, I soon came to realize that our scientific approach has a common denominator: systems thinking. Accounting for interconnections and cascading effects, our article shed light on different systems affected by COVID-19 and situations where mental health issues are likely to become increasingly prevalent in a changing climate. The article focuses on already vulnerable parts of the population, for example those who have been impacted by Hurricane Katrina or Hurricane Harvey – the latter of which has been made worse by climate change. The article illustrates how COVID-19 becomes a risk multiplier for climate migrants in three distinct case studies: key workers in New York as urban setting, seasonal migration dynamics, and disproportionate effects on black and Latino communities. Unrelenting effects include loss of employment, and a lower likelihood of being able to work from home or to have health insurance than white people.
A better understanding of the mental health-migration-climate change nexus can help absorb adverse mental health outcomes from COVID-19, which would otherwise compound. We however need to tackle systemic risks affecting mental health through synergies in research and policy, and an integrated intervention approach. Free mental health support for key workers through tele-therapy and mental health hotlines provide a practical way forward. Personally, I learned that climate migrants have been relentlessly resilient to systemic shocks. Nevertheless, with mental health issues, it becomes increasingly hard to maintain such resilience. With this commentary, I hope that mental health and interdisciplinary research finds its way in climate science and in the policy realm. We all need a clear mind to attain the Sustainable Development Goals.
Note: This article gives the views of the author, and not the position of the Nexus blog, nor of the International Institute for Applied Systems Analysis.
Aug 5, 2020 | Biodiversity, Data and Methods, Ecosystems, Young Scientists
By Martin Jung, postdoctoral research scholar in the IIASA Ecosystems Services and Management Program.
IIASA postdoc Martin Jung discusses how a newly developed map can help provide a detailed view of important species habitats, contribute to ongoing ecosystem threat assessments, and assist in biodiversity modeling efforts.
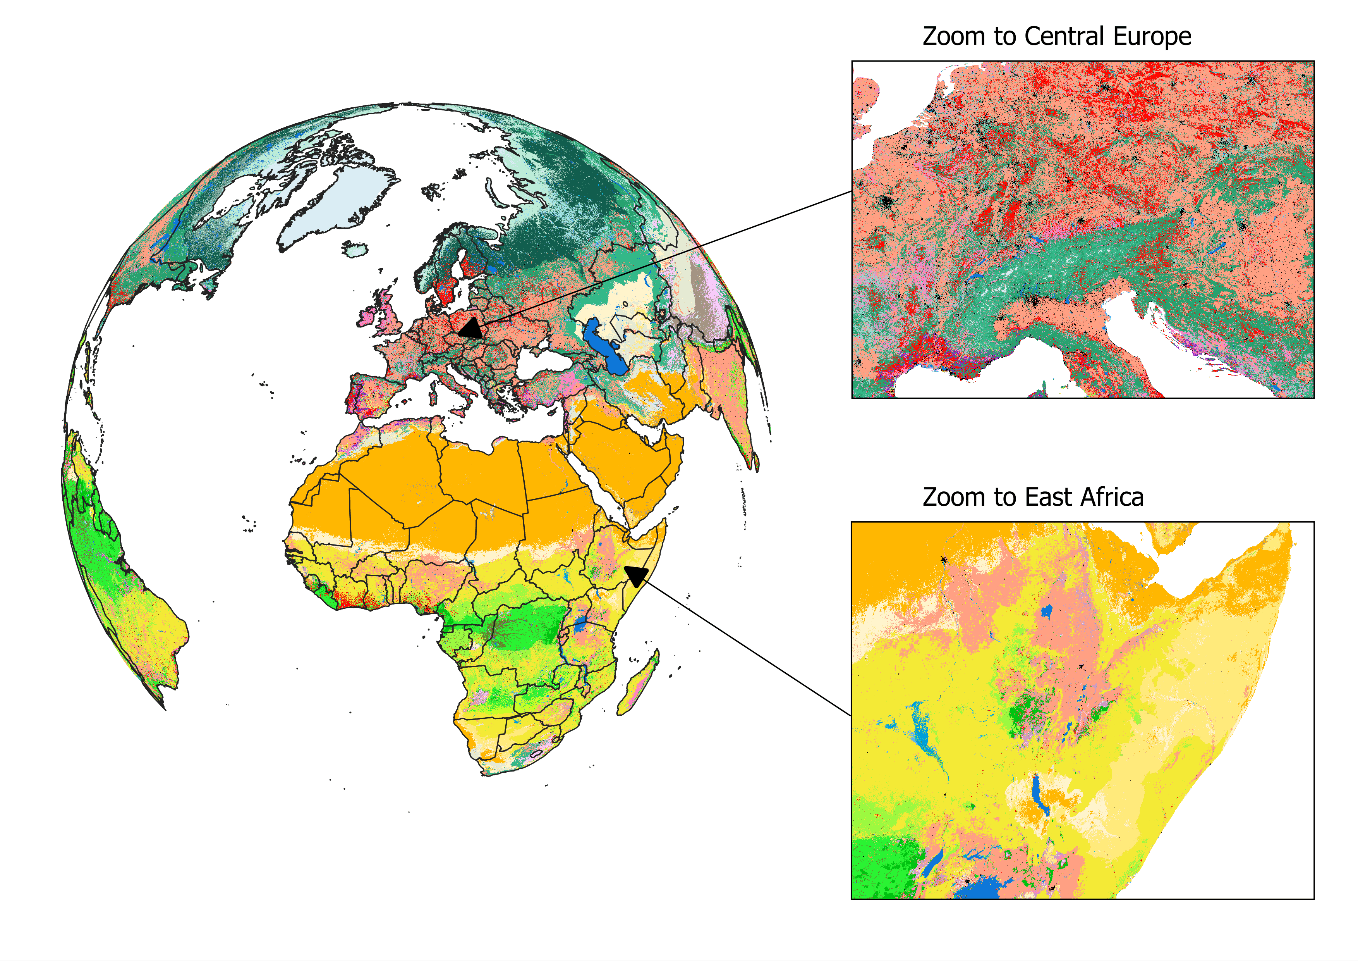
Biodiversity is not evenly distributed across our planet. To determine which areas potentially harbor the greatest number of species, we need to understand how habitats valuable to species are distributed globally. In our new study, published in Nature Scientific Data, we mapped the distribution of habitats globally. The habitats we used are based on the International Union for Conservation of Nature (IUCN) Red List habitat classification scheme, one of the most widely used systems to assign species to habitats and assess their extinction risk. The latest map (2015) is openly available for download here. We also built an online viewer using the Google Earth Engine platform where the map can be visually explored and interacted with by simply clicking on the map to find out which class of habitat has been mapped in a particular location.

Figure 1: View on the habitat map with focus on Europe and Africa. For a global view and description of the current classes mapped, please read Jung et al. 2020 or have a look at the online interactive interface.
The habitat map was created as an intersection of various, best-available layers on land cover, climate, and land use (Figure 1). Specifically, we created a decision tree that determines for each area on the globe the likely presence of one of currently 47 mapped habitats. For example, by combining data on tropical climate zones, mountain regions and forest cover, we were able to estimate the distribution of subtropical/tropical moist mountainous rain forests, one of the most biodiverse ecosystems. The habitat map also considers best available land use data to map human modified or artificial habitats such as rural gardens or urban sites. Notably, and as a first, our map also integrates upcoming new data on the global distribution of plantation forests.
What makes this map so useful for biodiversity assessments? It can provide a detailed view on the remaining coverage of important species habitats, contribute to ongoing ecosystem threat assessments, and assist in global and national biodiversity modeling efforts. Since the thematic legend of the map – in other words the colors, symbols, and styles used in the map – follows the same system as that used by the IUCN for assessing species extinction risk, we can easily refine known distributions of species (Figure 2). Up to now, such refinements were based on crosswalks between land cover products (Figure 2b), but with the additional data integrated into the habitat map, such refinements can be much more precise (Figure 2c). We have for instance conducted such range refinements as part of the Nature Map project, which ultimately helped to identify global priority areas of importance for biodiversity and ecosystem services.
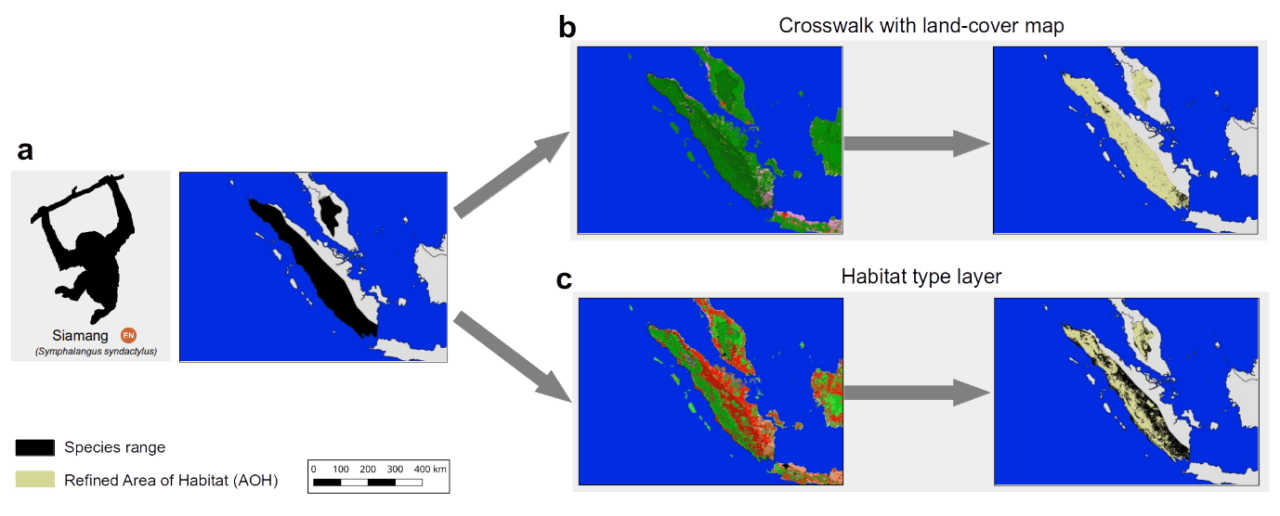
Figure 2: The range of the endangered Siamang (Symphalangus syndactylus) in Indonesia and Malaysia according to the IUCN Red List. Up to now refinements of its range were conducted based on land cover crosswalks (b), while the habitat map allows a more complete refinement (c).
Similar as with other global maps, this new map is certainly not without errors. Even though a validation has proved good accuracy at high resolution for many classes, we stress that – given the global extent and uncertainty – there are likely fine-scale errors that propagate from some of the input data. Some, such as the global distribution of pastures, are currently clearly insufficient, with existing global products being either outdated or not highly resolved enough to be useful. Luckily, with the decision tree being implemented on Google Earth Engine, a new version of the map can be created within just two hours.
In the future, we plan to further update the habitat map and ruleset as improved or newer data becomes available. For instance, the underlying land cover data from the European Copernicus Program is currently only available for 2015, however, new annual versions up to 2018 are already being produced. Incorporating these new data would allow us to create time series of the distribution of habitats. There are also already plans to map currently missing classes such as the IUCN marine habitats – think for example of the distribution of coral reefs or deep-sea volcanoes – as well as improving the mapped wetland classes.
Lastly, if you, dear reader, want to update the ruleset or create your own habitat type map, then this is also possible. All input data, the ruleset and code to fully reproduce the map in Google Earth Engine is publicly available. Currently the map is at version 003, but we have no doubt that the ruleset and map can continue to be improved in the future and form a truly living map.
Reference:
Jung M, Raj Dahal P, Butchart SHM, Donald PF, De Lamo X, Lesiv M, Kapos V,Rondinini C, & Visconti P (2020). A global map of terrestrial habitat types. Nature Scientific Data DOI: 10.1038/s41597-020-00599-8
Note: This article gives the views of the author, and not the position of the Nexus blog, nor of the International Institute for Applied Systems Analysis.
Feb 28, 2020 | Air Pollution, Alumni, India, Poverty & Equity, Young Scientists
By Abhishek Kar, Postdoctoral Research Scientist at Columbia University, USA, and IIASA Young Scientists Summer Program (YSSP) alumnus.
Abhishek Kar shares his thoughts on the Indian government’s Ujjwala program, which aims to scale up household access to Liquefied Petroleum Gas (LPG) for clean cooking.

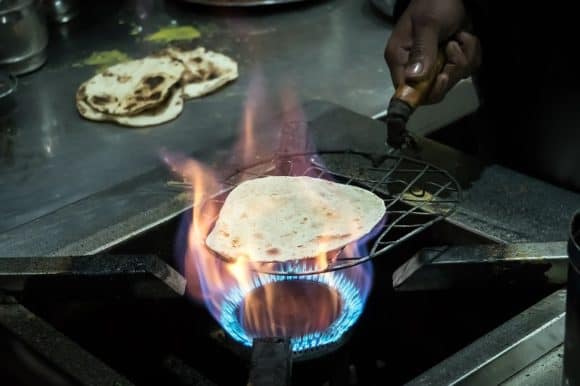
© Kaiskynet | Dreamstime.com
About 2.9 billion people depend on burning traditional fuels like firewood rather than modern cooking fuels like gas and electricity to cook their daily meals. The household air pollution caused when these fuels are burned, along with the resultant exposure to kitchen smoke causes several respiratory and other diseases. It is estimated that between 2 and 3.6 million people die every year due to lack of access to clean cooking fuels. It also has severe environmental effects like forest degradation and contributes to climate change. To address these challenges, the Indian Government launched a massive program called Pradhan Mantri Ujjwala Yojana (PMUY, or Ujjwala) to scale up household access to Liquefied Petroleum Gas (LPG) in May 2016.
My IIASA Young Scientists Summer Program (YSSP) project under Shonali Pachauri’s supervision was about analyzing consumption patterns of LPG in rural India. We looked at whether there was any differences in consumption patterns between the Ujjwala beneficiaries and general consumers. The analysis formed part of my PhD research and was eventually published as the cover story for the September 2019 issue of the journal, Nature Energy. The journal also invited us to write a policy brief, which was published in January 2020. The study’s findings received widespread media attention, especially in India. When I talk to journalists, they often ask whether the Ujjwala program is a success or a failure. I would like to use this opportunity to clear common misconceptions and share my thoughts.
The Ujjwala program’s original mandate was to tackle the challenge of “lack of access to clean fuel” and to make LPG affordable for poor women. The program provided capital subsidies to this end. Unfortunately, the policy document neither discussed usage of LPG as an exclusive or primary cooking fuel, nor did it provide any incentive for regular use (barring the universal LPG cylinder subsidy that is provided to everyone). The program was ambitious in terms of both scale and timeline, and fulfilled its original aim of providing LPG connections for millions of poor women.
Current debates around the program’s failure to result in smokeless kitchens are happening only because Ujjwala succeeded in fulfilling its original mandate of ensuring physical access. In my opinion, it is truly a remarkable achievement to have reached out to 80 million poor women within 40 months. The process not only involved massive awareness generation and community mobilization, but also ramping up the supply chain to meet increased demand. While I have a lot to say about how Ujjwala can be improved, I think it would be unfair to call it a failure. Access is the first step towards transition to clean fuels, and at least in this respect, it was an extraordinary success, making it a model of energy access for developing countries.
Our research shows that Ujjwala was able to attract new consumers rapidly, but those consumers did not start using LPG on a regular basis. Based on the literature and my own experience, there are five reasons why regular LPG use is a challenge for Ujjwala consumers, and the scheme did not have any specific provisions to effectively address them.
First, rural communities generally have easy access to free firewood, crop residues, cattle dung, etc. So why would they start paying for commercial fuel, when free fuel is readily available for cooking?
Secondly, Ujjwala (bravely) targeted poor women, who generally have limited disposable cash and seasonal, agriculture linked fluctuations in income. If there is no additional income, what costs would a poor family on an already tight budget have to cut to afford such a regular additional expense? While the program has made a 5 kg cylinder option available in response to this issue, the impact on LPG sales is still unknown.
Thirdly, home delivery of LPG cylinders is a challenge in most rural areas, as the cost of delivery for LPG distributors often outweighs the commission they receive. If there is no delivery option, poor rural families who often don’t have access to transport would need to arrange for a cylinder to be picked up from a far-off retail outlet. Oil Marketing Companies have vigorously been pushing for home delivery, but unless there are explicit incentives for this, the situation is unlikely to improve.
© Dmitrii Melnikov | Dreamstime.com
In the fourth place, gender dynamics make the situation even more complicated. Men are often financial decision makers who have to make budget cuts, while women are the primary beneficiaries of LPG in terms of a quick and smokeless cooking experience, with the side benefit of avoiding the drudgery of fuelwood collection. The laudable effort of the LPG panchayat platform, where women share their success stories and strategies to overcome opposition within their homes, is a step in the right direction, but it is unlikely that this will be sufficient to tackle a deep-rooted societal problem.
Lastly, and perhaps most importantly, people will have to stop using mud stoves and start using LPG stoves, which may involve real (or, perceived) changes in the taste, texture, look, and size of food items. As a student of habit change literature, I am surprised that anyone expected that such a switch would not be accompanied by behavior change interventions.
Ultimately, the Ujjwala scheme provided incentives to reduce the burden of the capital cost of LPG connections, and poor female consumers responded to it positively. This is a successful first step towards clean cooking energy transition. However, there were no scheme incentives to promote use, except general LPG subsidies, which is available to all, including the urban middle class. Consumers simply decided that the transition to LPG through regular purchase of LPG refills was not worth it, and did not take the next step. I would however not call this a failure of Ujjwala, as that was never the original program objective.
We have to acknowledge that Ujjwala’s phenomenal success in providing access to clean fuel has put the spotlight on its ineffectiveness to ensure sustained regular use. If you ask me, this is a classic case of the glass half-full or half-empty scenario. Or, as my PhD supervisor at the University of British Columbia, Hisham Zerrifi, puts it: “It depends!”
References:
[1] Kar A, Pachauri S, Bailis R, & Zerriffi H (2019). Using sales data to assess cooking gas adoption and the impact of India’s Ujjwala program in rural Karnataka. Nature Energy DOI: 10.1038/s41560-019-0429-8 [pure.iiasa.ac.at/15994]
Note: This article gives the views of the author, and not the position of the Nexus blog, nor of the International Institute for Applied Systems Analysis.
Feb 20, 2020 | Climate, Energy & Climate, Women in Science, Young Scientists
By Chibulu Luo, PhD student at the University of Toronto (Civil Engineering) and 2016 Young Scientists Summer Program (YSSP) participant.
Luo’s recent publication in the Journal of Cleaner Production considers the needs of the poorest and most vulnerable communities when exploring policy insights for Dar es Salaam’s energy transition.
Global discourse on sustainability rarely focuses on the Africa region as a key player in the global transition towards a cleaner low-carbon energy future. Filling this critical gap in the research is what has stimulated my doctoral studies.
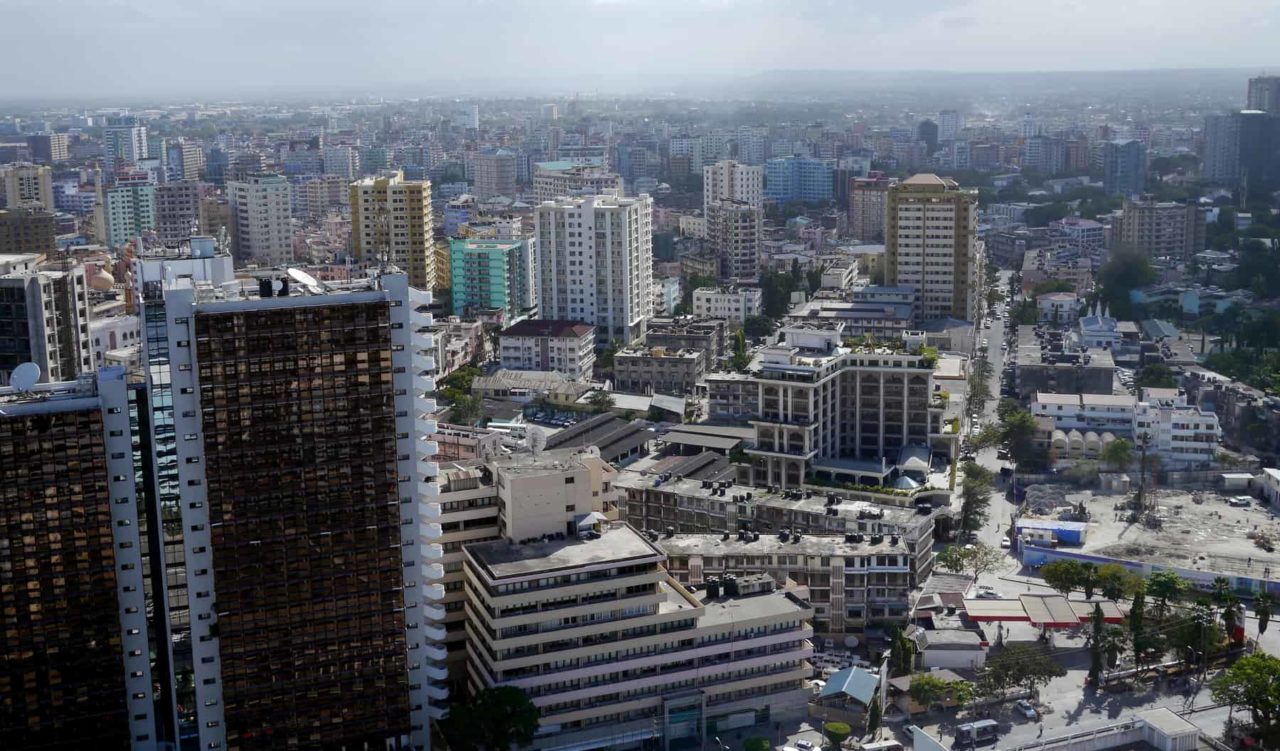
Dar es Salaam © Timwege | Dreamstime
According to a recent report from the International Energy Agency, the Africa region contributed only 3.7% towards global energy-related GHG emissions in 2018, which perhaps explains why the region has remained largely ignored in current research on energy. However, with colleagues at the University of Toronto and Ontario Tech University, I assert that the growth of large cities such as Dar es Salaam should be critically considered in global efforts on climate change mitigation. My recently published paper estimates to the year 2050, the potential changes in residential energy use and GHG emissions in Dar es Salaam, among Africa’s most populous and fastest-growing cities. Like many African cities,contributes little to global GHG emissions; however, our paper projects a substantial increase in future emissions by the year 2050 – up to 4 to 24 times– which is quite overwhelming. According to our findings, this jump in emissions is due to a higher urban population in 2050 (expected to triple from 5 million in 2015, to as much as 16 million in 2050), and increased energy access and electricity consumption.
In developing these future estimates, we used the Shared-Socio-Economic Pathways (SSPs), developed by IIASA researchers, as a guiding narrative. While there may be some uncertainties with projecting GHG emissions pathways several years into the future, our findings could derive insights to the emissions pathways of other large African cities, and the critical role that these cities can play in global efforts to achieve the 1.5-degree, or even, 2-degree global warming target.

© Chibulu Luo
I first heard about the SSPs as a participant in the IIASA YSSP in 2016; this period was a tremendous time of growth and reflection in terms of my research direction. The opportunity to work amongst such a talented group of scientists in a collaborative environment and on issues that are globally relevant was an unforgettable experience. I especially enjoyed working with colleagues in the IIASA Risk and Resilience Program, where some of my early research ideas were formulated. At that time, I focused largely on resilience measures for infrastructure development in African cities, including Dar es Salaam.
Note: This article gives the views of the author, and not the position of the Nexus blog, nor of the International Institute for Applied Systems Analysis.
More updates from IIASA alumni or information on the IIASA network may be found here.


You must be logged in to post a comment.