By Martin Jung, postdoctoral research scholar in the IIASA Ecosystems Services and Management Program.
IIASA postdoc Martin Jung discusses how a newly developed map can help provide a detailed view of important species habitats, contribute to ongoing ecosystem threat assessments, and assist in biodiversity modeling efforts.
Biodiversity is not evenly distributed across our planet. To determine which areas potentially harbor the greatest number of species, we need to understand how habitats valuable to species are distributed globally. In our new study, published in Nature Scientific Data, we mapped the distribution of habitats globally. The habitats we used are based on the International Union for Conservation of Nature (IUCN) Red List habitat classification scheme, one of the most widely used systems to assign species to habitats and assess their extinction risk. The latest map (2015) is openly available for download here. We also built an online viewer using the Google Earth Engine platform where the map can be visually explored and interacted with by simply clicking on the map to find out which class of habitat has been mapped in a particular location.
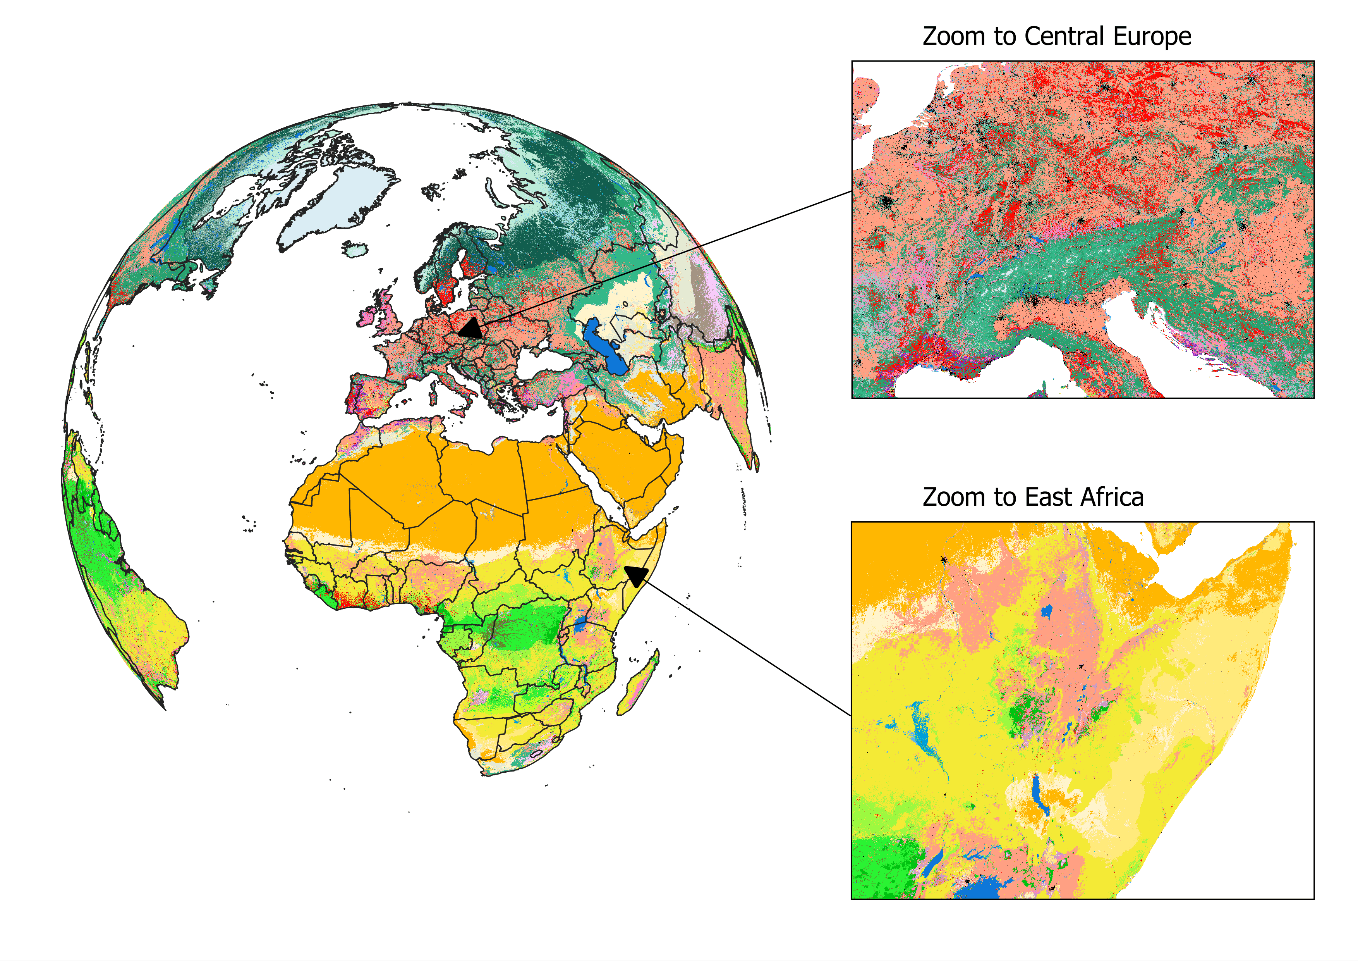
Figure 1: View on the habitat map with focus on Europe and Africa. For a global view and description of the current classes mapped, please read Jung et al. 2020 or have a look at the online interactive interface.
The habitat map was created as an intersection of various, best-available layers on land cover, climate, and land use (Figure 1). Specifically, we created a decision tree that determines for each area on the globe the likely presence of one of currently 47 mapped habitats. For example, by combining data on tropical climate zones, mountain regions and forest cover, we were able to estimate the distribution of subtropical/tropical moist mountainous rain forests, one of the most biodiverse ecosystems. The habitat map also considers best available land use data to map human modified or artificial habitats such as rural gardens or urban sites. Notably, and as a first, our map also integrates upcoming new data on the global distribution of plantation forests.
What makes this map so useful for biodiversity assessments? It can provide a detailed view on the remaining coverage of important species habitats, contribute to ongoing ecosystem threat assessments, and assist in global and national biodiversity modeling efforts. Since the thematic legend of the map – in other words the colors, symbols, and styles used in the map – follows the same system as that used by the IUCN for assessing species extinction risk, we can easily refine known distributions of species (Figure 2). Up to now, such refinements were based on crosswalks between land cover products (Figure 2b), but with the additional data integrated into the habitat map, such refinements can be much more precise (Figure 2c). We have for instance conducted such range refinements as part of the Nature Map project, which ultimately helped to identify global priority areas of importance for biodiversity and ecosystem services.
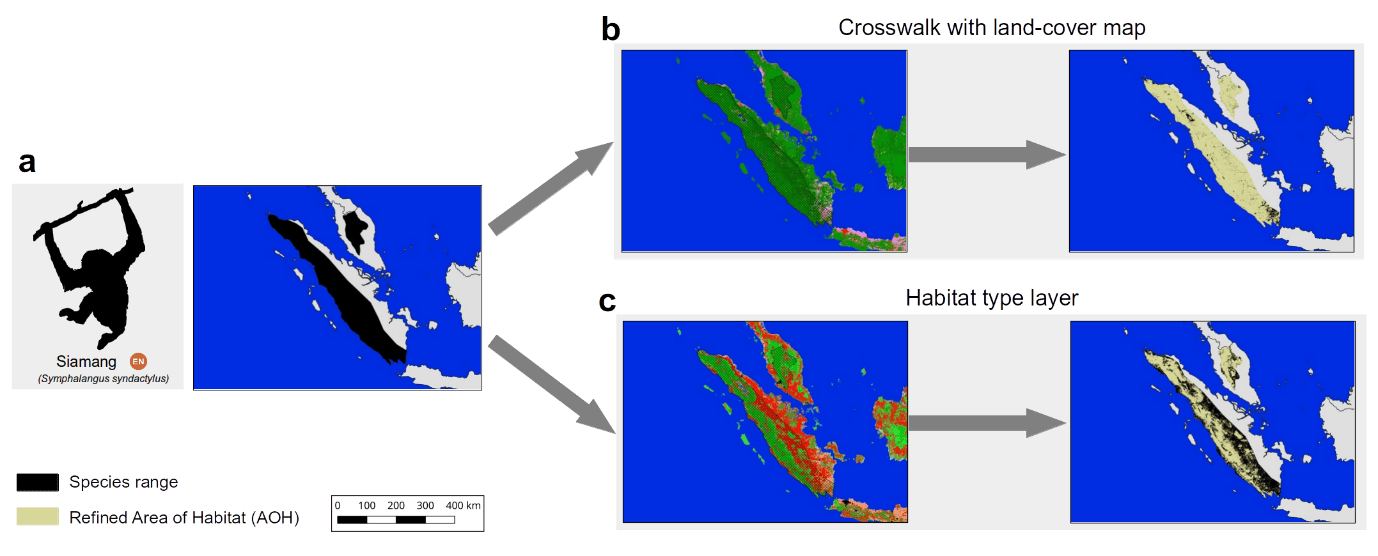
Figure 2: The range of the endangered Siamang (Symphalangus syndactylus) in Indonesia and Malaysia according to the IUCN Red List. Up to now refinements of its range were conducted based on land cover crosswalks (b), while the habitat map allows a more complete refinement (c).
Similar as with other global maps, this new map is certainly not without errors. Even though a validation has proved good accuracy at high resolution for many classes, we stress that – given the global extent and uncertainty – there are likely fine-scale errors that propagate from some of the input data. Some, such as the global distribution of pastures, are currently clearly insufficient, with existing global products being either outdated or not highly resolved enough to be useful. Luckily, with the decision tree being implemented on Google Earth Engine, a new version of the map can be created within just two hours.
In the future, we plan to further update the habitat map and ruleset as improved or newer data becomes available. For instance, the underlying land cover data from the European Copernicus Program is currently only available for 2015, however, new annual versions up to 2018 are already being produced. Incorporating these new data would allow us to create time series of the distribution of habitats. There are also already plans to map currently missing classes such as the IUCN marine habitats – think for example of the distribution of coral reefs or deep-sea volcanoes – as well as improving the mapped wetland classes.
Lastly, if you, dear reader, want to update the ruleset or create your own habitat type map, then this is also possible. All input data, the ruleset and code to fully reproduce the map in Google Earth Engine is publicly available. Currently the map is at version 003, but we have no doubt that the ruleset and map can continue to be improved in the future and form a truly living map.
Reference:
Jung M, Raj Dahal P, Butchart SHM, Donald PF, De Lamo X, Lesiv M, Kapos V,Rondinini C, & Visconti P (2020). A global map of terrestrial habitat types. Nature Scientific Data DOI: 10.1038/s41597-020-00599-8
Note: This article gives the views of the author, and not the position of the Nexus blog, nor of the International Institute for Applied Systems Analysis.
You must be logged in to post a comment.