Feb 12, 2016 | Systems Analysis
By Sergio Rinaldi, IIASA Evolution and Ecology Program and Politecnico di Milano, Italy
Is it possible to predict how love stories develop, progress, and end using mathematical models? I have studied this question over the past 20 years with a group of researchers at IIASA and at the Politecnico di Milano, and as we show in our new book Modeling Love Dynamics (World Scientific, 2016), the answer is yes. The emerging message is that prediction is possible, if we can describe in formulas the way each individual reacts to the love and to the appeal of the partner.
Consider a standard love story, which develops like those described in a classical Hollywood movie such as Titanic. This story can be easily modeled, if one considers reasonably appealing individuals who increase their reaction with the partner’s love – so called secure individuals. Starting from the state of indifference, where the individuals are at their first encounter, their feelings continuously grow and tend toward a positive plateau.

Mala Powers and José Ferrer in Cyrano de Bergerac, 1950. – Public Domain
Love stories become more intriguing when one individual is not particularly appealing, if not repelling, as in the fairy tale “Beauty and The Beast.” Indeed, in these cases, there exists also a second romantic regime, which is negative and can therefore entrain, in the long run, marital dissolution. In order to avoid that trap, people who are not very charming, or believe to be so, do all they can to look more attractive to the partner. At the first date, she wears her nicest dress and he shows up with his best fitting T-shirt. However, after a while, the bluffing can be interrupted, because the couple has entered the safe basin of attraction of the positive regime. Needless to say, the model also supports much more sophisticated behavioral strategies, like that described by Edmond Rostand in his “Cyrano de Bergerac,” the masterpiece of the French love literature.
Not all individuals are secure. Indeed, some people react less and less strongly when the love of the partner overcomes a certain threshold. These individuals, often very keen to flirtation, are incapable of becoming one with their partner. The model shows that couples composed of insecure individuals tend, with almost no exception, toward an unbalanced romantic regime in which the most insecure is only marginally involved and is therefore prone to break up the relationship at the first opportunity. This is why after just 20 minutes of the very long “Gone with the Wind,” when one realizes that Scarlett and Rhett are both insecure, the model can already predict the end of the film, where he quits her with the lapidary “Frankly, my dear, I don’t give a damn.” The same conclusion is expected if only one of the two individuals is insecure. This explains the numerous failures in the romantic life of some individuals, like the beautiful star Liz Taylor, who is described as very insecure in all her biographies, and went, indeed, through eight marriages.

Clark Gable and Vivien Leigh in Gone with the Wind, 1939 – MGM Pictures | Public Domain
Mathematical models can also be used to interpret more complex romantic behaviors. Particularly important is the case of individuals who overestimate the appeal of the partners when they are more in love with them (like parents who have a biased view of the beauty of their own kids). Interestingly, if insecurity is also present, biased couples can have romantic regimes characterized by recurrent ups and downs. In other words, the theory says that bias and insecurity is an explosive mix that triggers turbulence in the life of a couple.
In the second part of the book we focus on the effects of the social environment and to the consequences of extra-emotional compartments. In this context, our analysis of the 20-years long relationship between Laura and the famous Italian poet Francis Petrarch shows that poetic inspiration is an important destabilizing factor, responsible for transforming a quiet relationship into a turbulent one.
Finally, we studied triangular relationships, with emphasis on the effects of conflict and jealousy. In all these cases the dynamics of the feelings can be very wild, up to the point of being chaotic and, hence, unpredictable. When this occurs, the life of the couple becomes unsustainable, because painful periods of crisis can virtually start at any moment: a heavy permanent stress. The model can thus explain why the relationship is often interrupted, sometimes even tragically, as in the famous film by François Truffaut “Jules et Jim”, where Kathe’s suicide is perceived as a real relief.
 More information: Watch a video of Sergio Rinaldi’s talk at the 2015 Systems Analysis Conference.
Reference
Rinaldi S, Della Rossa F, Dercole F, Gragnani A, Landi P, (2015). Modeling Love Dynamics. World Scientific, Singapore [January 2016] http://www.worldscientific.com/worldscibooks/10.1142/9656
Note: This article gives the views of the author, and not the position of the Nexus blog, nor of the International Institute for Applied Systems Analysis.
Jan 27, 2016 | Climate Change, Postdoc, Risk and resilience
By Mia Landauer, a Finnish postdoc at IIASA Risk, Policy and Vulnerability Program and Arctic Futures Initiative
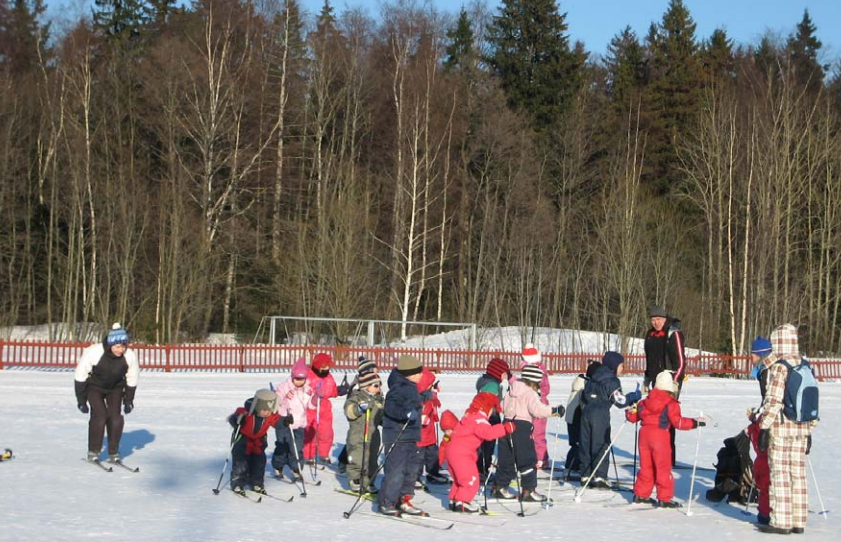
When I was a child I did not like cross-country skiing. One reason was that like many other schoolmates in Finland, I had no other option than to ski to school throughout the winter, even when temperatures were below -20 C, and even though my skis were too big because I got them from my sister and so old that they could have broken anytime.
When I decided to write my dissertation in Austria about climate adaptation of winter tourism, I found I still couldn’t get away from skiing. My professor at the University of Natural Resources and Life Sciences (BOKU) asked me to join a research team investigating this topic. “What a great tradition you have in Finland! My friend and colleague from METLA (now Natural Resources Institute) in Finland would love to do research with us but with somebody who knows about cross-country skiing! You are the perfect match!” I guess I was too shy to admit that I was not excited about having cross-country skiing as a case study—but I decided to give it a try.
Cross country skiing in Finland is practiced by all age groups (voluntarily or not). Photo Credit: © Mia Landauer
Cross-country skiing is socially and culturally a very important activity in Finland, with considerable health benefits. Forty-two percent of the population practice skiing annually and 98% have the skills. But cross-country skiing, like other snow-based activities, is affected by climate change: even Nordic countries are now seeing lack of snow, shift of seasons, and extreme weather events. The winter 2015/2016 has been no exception. Many Finns are concerned that losing this activity would lead to reduced well-being and loss of cultural tradition. Furthermore, economic impacts on tourism regions brought about by a decrease in skiing would cause problems to local economies heavily dependent on snow-based tourism.
Although vulnerability indicators of some other tourism sectors such as beach tourism exist, nobody had thought about cross-country skiing. So we decided to develop an index, based on climatic observations together with extensive survey data on skiers living in climatically different regions in Finland.
We found that exposure to changes in snow conditions have a considerable effect on regional vulnerability. The most vulnerable skiers are in southernmost parts of Finland, which makes sense. But it is not only the amount of snow and length of winter that matter. We also found that skiers in North and East Finland have the highest capacity to adapt, as indicated by their ability to ski: having the necessary skills and equipment, as well as capacity and willingness to travel to be able to ski.
However, the results also show that if it we could enhance these components of adaptive capacity, also the skiers in the south would have a chance. If there are no adaptation options (no artificial snow tracks, no indoor skiing facilities, or simply no interest to use these, or no money or time to travel to be able to ski), in the short term the Finnish cross-country skiing population will face impacts on health, well-being, and quality of life. In the long term, the skiing culture could be lost. Furthermore, decline in demand would lead to regional economic losses in tourism-dependent local economies.
Attempts are being made to maintain the skiing tradition. Nowadays there are a lot of organized activities where kids are introduced to outdoor activities in a playful and educational environment, and ski school and clubs are being established. They play an important role to create a close and pleasant relationship to nature and increase motivation for skiing. But of course the most important element for skiing is snow.
I have always had a very close relationship to nature. Believe me or not, sometimes I do go skiing although it also brings back the unpleasant memories. Despite them, wintery landscapes and nature experience have motivated me to continue skiing as an adult. The gray and rainy winters make me worried and I simply cannot see myself skiing in a ski tunnel… Albeit “you will never know the true value of a moment until it becomes a memory“, I want snow!

Cross country ski track in Ruka, Finland Photo Credit: © Timo Newton-Syms via Flickr
More information:
Project: “Map Based Assessment of Vulnerability to Climate Change Employing Regional Indicators” (MAVERIC)” http://www.syke.fi/projects/maveric
References
Landauer, M., Sievänen, T., & Neuvonen, M. (2015). Indicators of climate change vulnerability for winter recreation activities: a case of cross-country skiing in Finland, Leisure/Loisir, 39:3-4, 403-440. http://dx.doi.org/10.1080/14927713.2015.1122283
Landauer, M., Haider, W., & Pröbstl, U. (2014). The influence of culture on climate change adaptation strategies: Preferences of cross-country skiers in Austria and Finland. Journal of Travel Research 53(1), pp. 95-109. doi: 10.1177/0047287513481276
Landauer, M., & Sievänen, T. (2011). Suomalaisten maastohiihtäjien sopeutuminen ilmastonmuutokseen. In T. Sievänen & M. Neuvonen (Eds.), Luonnon virkistyskäyttö 2010 (pp. 91–101). Vantaa: Working Papers of the Finnish Forest Research Institute, 212.
Landauer, M., Sievänen, T., & Neuvonen, M. (2009). Adaptation of Finnish cross-country skiers to climate change. Fennia 187 (2), pp. 99–113. http://ojs.tsv.fi/index.php/fennia/article/view/3697
Neuvonen, M., Sievänen, T., Fronzek, S., Lahtinen, I., Veijalainen, N., & Carter, T. R. (2015). Vulnerability of cross-country skiing to climate change in Finland – An interactive mapping tool. Journal of Outdoor Recreation and Tourism, 11, 64–79. doi:10.1016/j.jort.2015.06.010
Neuvonen, M. & Sievänen,T. (2011). Ulkoilutilastot 2010 (Outdoor Recreation Statistics 2010). In: Sievänen, T. & Neuvonen, M. (toim.). Luonnon virkistyskäyttö 2010. Metlan työraportteja / Working Papers of the Finnish Forest Research Institute 212: 133–190
Perch-Nielsen, S. L. (2010). The vulnerability of beach tourism to climate change – An index approach. Climatic Change, 100(3–4), 579–606. doi:10.1007/s10584-009-9692-1
Note: This article gives the views of the author, and not the position of the Nexus blog, nor of the International Institute for Applied Systems Analysis.
Oct 1, 2015 | Citizen Science
By Linda See, IIASA Ecosystems Services and Management Program
We had another very hot summer this year in Europe and many other parts of the world. Many European cities, including London, Madrid, Frankfurt, Paris and Geneva, broke new temperature records.
Cities are particularly vulnerable to increasing temperatures because of a phenomenon known as the urban heat island effect. First measured more than a half a century ago by Tim Oke, the increased temperatures measured in urban areas are a result of urban land use, or higher amounts of impervious surfaces such as concrete and concentrated urban structures. The urban heat island effect impacts human health and well-being. It’s not just a matter of comfort: during the heat wave in 2003, more than 70,000 people in Europe are estimated to have perished, mostly urban dwellers.

Summer 2015 in Ljubljana, Slovenia. ©K. Leitzell | IIASA
While climate models have many uncertainties, they do all agree that the urban heat island effect will increase in frequency and duration in the future. A recent article by Hannah Hoag in Nature paints a bleak picture of just how unprepared cities are for dealing with increasing temperatures. The paper cites positive and negative examples of mitigation from various cities but it falls short of suggesting a more widely applicable solution.
What we need is a standardized way of approaching the problem. Underlying this lack of standards is the paucity of data on the form and function of cities. By form I mean the geometry of the city–a 3D model of the buildings and road network, and information on the building materials—as well as a map of the basic land cover including impervious surfaces like roads and sidewalks, and areas of vegetation such as gardens, parks, and fields. Function refers to the building use, road types, use of irrigation and air conditioning and other factors that affect local atmospheric conditions. As climate models become more highly resolved, they will need vast amounts of such information to feed into them.
These issues are what led me and my colleagues (Prof Gerald Mills of UCD, Dr Jason Ching of UNC and many others) to conceive the World Urban Database and Access Portal Tools (WUDAPT) initiative (www.wudapt.org). WUDAPT is a community-driven data collection effort that draws upon the considerable network of urban climate modelers around the world. We start by dividing a city into atmospherically distinct areas, or Local Climate Zones (LCZs) developed by Stewart and Oke, which provides a standard methodology for characterizing cities that can improve the parameters needed for data-hungry urban climate models.
Using freely available satellite imagery of the Earth’s surface, the success of the approach relies on local urban experts to provide representative examples of different LCZs across their city. We are currently working towards creating an LCZ classification for all C40 cities (a network of cities committed to addressing climate change) but are encouraging volunteers to work on any cities that are of interest to them. We refer to this as Level 0 data collection because it provides a basic classification for each city. Further detailed data collection efforts (referred to as Levels 1 and 2) will use a citizen science approach to gather information on building materials and function, landscape morphology and vegetation types.

The Local Climate Zone (LCZ) map for Kiev.
WUDAPT will equip climate modelers and urban planners with the data needed to examine a range of mitigation and adaptation scenarios: For example what effect will green roofs, changes in land use or changes in the urban energy infrastructure have on the urban heat island and future climate?
The ultimate goal of WUDAPT is to develop a very detailed open access urban database for all major cities in the world, which will be valuable for many other applications from energy modelling to greenhouse gas assessment. If we want to improve the science of urban climatology and help cities develop their own urban heat adaptation plans, then WUDAPT represents one concrete step towards reaching this goal. Contact us if you want to get involved.
About the WUDAPT Project
The WUDAPT concept has been developed during two workshops, one held in Dublin Ireland in July 2014 and the second in conjunction with the International Conference on Urban Climate in Toulouse; a third workshop is set to take place in Hong Kong in December 2015. More information can be found on the WUDAPT website at: http://www.wudapt.org.
References
Bechtel, B., Alexander, P., Böhner, J., Ching, J., Conrad, O., Feddema, J., Mills, G., See, L. and Stewart, I. 2015. Mapping local climate zones for a worldwide database of form and function of cities. International Journal of Geographic Information, 4(1), 199-219.
Hoag, H. 2015. How cities can beat the heat. Nature, 524, 402-404.
See, L., Mills, G. and Ching. J. 2015. Community initiative counters urban heat. Nature, 526,43 (01 October 2015) doi:10.1038/526043b
Stewart, I.D. and Oke, T.R. 2012. Local Climate Zones for urban temperature studies. Bulletin of the American Meteorological Society, 93(12), 1879-1900.
Wake, B. 2012. Defining local zones. Nature Climate Change, 2, 487.
Note: This article gives the views of the author, and not the position of the Nexus blog, nor of the International Institute for Applied Systems Analysis.
Sep 22, 2015 | Energy & Climate
By Nebojsa Nakicenovic, Deputy Director General, International Institute for Applied Systems Analysis (IIASA), Austria (Originally published on the World Economic Forum Agenda Blog.)

Nebojsa Nakicenovic
Goal 7 of the Sustainable Development Goals is ambitious: Ensure access to affordable, reliable, sustainable and modern energy for all. This must be accomplished without compromising Goal 13: climate. This is achievable.
In spite of ups-and-downs and outright shocks in the global economy, some quite recent, the economic success stories of the industrialized countries are role models for the countries that are still developing. This puts the entire global community in the dichotomous position of needing to fire up the engine of growth, without producing the greenhouse gases it has been emitting since the beginning of the Industrial Revolution. What is the answer?
Very few questions in the complex area of energy and climate change can have a simplistic answer, but I am going to attempt one here: decarbonization, namely, drastic reduction of carbon dioxide and other greenhouse gas emissions per unit of economic activity.
Back in 1993, I wrote this:
“The possibility of less carbon-intensive and even carbon-free energy as major sources of energy during the next century is consistent with the long-term dynamic transformation and structural change of the energy system.”
My view in 2015 is the same; however, the scientific community 22 years later has a much better understanding of “the decarbonization challenge” and how it can be addressed. I will sketch out a 10-step approach to the removal of carbon from the global economy, but first I’d like to paint in a bit of the background.
Carbon dioxide is the main greenhouse gas and contributor to climate change. The largest source is our use of fossil fuels to drive development. Carbon dioxide emissions have increased exponentially since 1850 at about 2% per year, while decarbonization of the global economy is only around 0.3% per year.
The 2012 Global Energy Assessment, in which IIASA played a leading role, puts the current decarbonization rate at approximately six times too low to offset the increase in global energy use of about 2% per year. To meet the goal of the 2009 climate agreement (the Copenhagen Accord), namely, “the scientific view that the increase in global temperature should be below 2 degrees Celsius” to prevent dangerous anthropogenic interference with the climate system, global net emissions of carbon dioxide and other greenhouse gases will need to approach zero by the second half of this century, implying deep, deep decarbonization rates.

“Carbon dioxide is the main greenhouse gas and contributor to climate change. The largest source is our use of fossil fuels to drive development.” © Kokhanchikov | Dollar Photo Club
But we need deep decarbonization while energy needs are increasing to meet the demand of the developing world, including the three billion without access today to sustainable energy. All scenarios in the academic literature that lead to further economic development in the world, universal access to sustainable energy, and the stabilization of climate change to less than 2 degrees Celsius, anticipate deep and urgent decarbonization. Here’s my 10-point plan for doing that.
- Change attitudes
Attitudes to energy use are based on many factors, from cultural norms to overall infrastructure design. We need much greater political will to affect a change in attitudes: it is critical that policy interventions should communicate to citizens the ethical notion of improved well-being and health now and for future generations of a zero-carbon economy. .
- Transform governance
The transformation needed this century is more fundamental than previous transformations, like the replacement of coal by oil, because of the significantly shorter time needed to achieve it. Thus, government policies are essential, and are needed particularly in changing buildings codes, fuel efficiency standards for transportation, mandates for the introduction of renewables, and carbon pricing.
- Improve energy efficiency
More efficient provision of energy services, or doing more with less, and radical improvements in energy efficiency, especially in end use, will reduce the amount of primary energy required and represents a cost-effective, near-term option for reducing carbon dioxide emissions, as well as having multiple benefits in different areas of life.
- Ramp up renewable use
We can show that the share of renewable non-fossil energy from solar, wind, rain, tides, waves, and geothermal sources in global primary energy could increase from the current 17% to between 30% and 75%. In some regions it could exceed 90% by 2050, provided that public attitudes change and efficiency increases.
- Reduce global energy intensity
The energy intensity in the industrial sector in different countries is steadily declining due to improvements in energy efficiency and a change in the structure of the industrial output. Far greater reductions are feasible by combining these improvements with adoption of the best-achievable technology.
- Use known technologies
Carbon dioxide capture and storage (CCS), now being piloted, is a pathway that leads to decarbonization with continued use of fossil energy. It requires: reducing costs, supporting scale-up, assuring carbon storage integrity and environmental capability, and securing approval of storage sites. Nuclear energy could make a significant contribution in some parts of the world, or it could be phased out as, for instance, in Germany.
- Improve buildings
Retrofitting buildings can reduce heating and cooling energy requirements by 50–90%; new buildings can be designed and built using close to zero energy for heating and cooling. Passive energy houses and those that produce energy onsite are another great opportunity to achieve vigorous decarbonization. In conjunction with compatible lifestyles oriented toward rational energy use, efficient buildings are an important decarbonization option.
- Cut transport carbon
A major transformation of transportation is possible over the next 30–40 years and will require improving vehicle designs, infrastructure, fuels and behavior. Electrically powered transportation reduces final energy use by more than a factor of three over gasoline-powered vehicles. A shift toward collective mobility is an essential option. This also implies behavioral changes and new business models like car-sharing, and self-driving cars to replace individual mobility.
- Clean industrial processes
Overall, global industry efficiency is only 30%. Improved energy efficiency in industry results in significant energy productivity gains and, in turn, improved productivity boosts employment and corporate competitiveness. A shift toward low to zero emission energy sources in industry is another important and much-needed change. For example, with an aggressive renewables strategy, near-zero growth in GHG emissions in the industrial sector would be possible. Finally, decarbonization would also involve changes of industrial processes, for example, from high to low temperatures.
- Stranded assets and ‘derisking’ renewables.
The flow of investment needs to be changed away from fossil fuels and toward efficiency, renewables, decarbonization of fossil energy sources, and especially efficient end-use in buildings, transport, and industry. Sustainable energy futures require relatively high up-front investments with the benefit of low long-term costs. They are attractive in the long run, but the up-front investments need derisking and other forms of support, such as feed-in tariffs.
Note: This article gives the views of the author, and not the position of the Nexus blog, nor of the International Institute for Applied Systems Analysis.
Sep 2, 2015 | Systems Analysis
By Matthias Wildemeersch, IIASA Advanced Systems Analysis and Ecosystems Services and Management Programs
FotoQuest Austria is a citizen science campaign initiated by the IIASA Ecosystems Services & Management Program that aims to involve the general public in mapping land use in Austria. Understanding the evolution of urban sprawl is important to estimate the risk of flooding, while the preservation of wetlands has important implications for climate change.
But how can we engage people in environmental monitoring, in particular when they are growing increasingly resistant to traditional forms of advertising? Viral marketing makes use of social networks to spread messages, and takes advantage of the trust that we have in the recommendation coming from a friend rather than from a stranger or a company.
Network science and the formal description of spreading phenomena can shed light on the propagation of messages through communities and can be applied to inform and design viral marketing campaigns.

Viral spreading © kittitee550 | Dollar Photo Club
Network science is a multi-disciplinary field of research that draws on graph theory, statistical mechanics, inference, and other theories to study the behavior of agents in various networks. The spreading phenomena in viral marketing show similarities with well-studied spreading processes over biological, social, physical, and financial networks. For instance, we can think about epidemics,which are well understood and allow for the design of optimal strategies to contain viruses. Another example is opinion dynamics, which received renewed research attention over the last years in the context of social media. In contrast to diseases or computer viruses, which we aim to contain and stop, the goal of viral marketing is to spread widely, reaching the largest possible fraction of a community.
What makes viral marketing unique?
But some aspects of viral marketing are very different from what we see in other spreading phenomena. First of all, there are many platforms that can be used to spread information at the same time, and the interaction between these platforms is not always transparent. Human psychology is a crucial factor in social networks, as repeated interaction and saturation can decrease the willingness to further spread viral content. Marketing campaigns have a limited budget, and therefore it is meaningful to understand how we can use incentives and how efficient they are. This also means that it is essential to find the group of most influential people that can be used as seeds for the viral campaign.
Network science has addressed to a great extent all these individual questions, mostly under the assumption of full knowledge of the connections between the agents and their influence. Currently, so-called multiplexes are an active research field that studies the behavior of multi-layer networks. This research unveils the relationships between the dynamics of viral marketing, the connection pattern, and strength between the network layers. Although viral spreading may be unachievable in a single layer, for example a social network like Facebook, the critical threshold may be exceeded by joining different platforms. Within a given platform, people alike can be clustered using community detection algorithms. Once the communities are identified, influence maximization algorithms have been established to select these persons that maximize the spread of viral content. Although this discrete optimization problem is computationally difficult—or NP-hard—mathematicians have proposed algorithms that can efficiently predict who to target to give a campaign the best chance of going viral. On top of that, optimal pricing strategies have been developed to reward recommenders.

The FotoQuest Austria app aims to engage citizen scientists in their campaign – network theory may help them go “viral.” © IIASA
Although the literature is extensive, the nature of the results is often theoretical and involves mathematically complex models and algorithms. Considering that only partial information on the network is usually available, it is not straightforward to bring this knowledge back to a practical marketing campaign. So researchers in this field are trying to bridge the gap between theoretical results and practical problems. The generic, powerful methods of network science are sufficiently versatile to capture the specifics of real-world applications. As such, network science can provide guidelines that can bring great value for the design of heuristic methods in marketing strategies.
Note: This article gives the views of the author, and not the position of the Nexus blog, nor of the International Institute for Applied Systems Analysis.


You must be logged in to post a comment.