Jun 2, 2016 | Climate Change
By Katherine Leitzell, IIASA science writer and press officer (and cyclist)
In May over 50 IIASA staff members took part in the Austrian Bike to Work month (Osterreich Radelt zur Arbeit), logging 11,681 kilometers riding to and from the institute in Laxenburg. The institute took fifth place in Austria in terms of kilometers ridden, and first place in Lower Austria.
According to the Austrian initiative’s calculations, this effort translated into saving over 1900 kg of CO2 emissions, or on average 36 kg per person—which is approximately 4% of an average Austrian’s monthly CO2 emissions. However, this calculation assumed that each of the IIASA cyclists would have been otherwise driving alone in a car. Since many people ride the bus or take public transport if they’re not biking, the actual emission savings from our cycling efforts in May were in fact much less. In fact, since buses and trains run anyway, cycling to work may make no impact whatsoever on emissions of air pollution and greenhouse gas emissions. Does that mean it’s not worth it to make the effort?

The author’s route to the office. © Katherine Leitzell | IIASA
IIASA researcher Jens Borken has analyzed the impacts that our daily travel has on the individual climate footprint. Personal mobility—all kinds of travel—make up about one third of the average European’s annual greenhouse gas emissions: the rest come from consumption choices and household heating and energy use. Of the carbon footprint from mobility, he says, commuting generally only makes up 10-15% of that. The largest part of the mobility budget is related to shorter and longer distance leisure travel, and in particular from air travel.
“From a quantitative perspective, the climate benefit of riding your bike is small, but it can be one step on a path to a low-carbon lifestyle.” says Borken. “As researchers who work on climate change, riding a bike to work (and possibly further) brings one piece of our lives in line with the message that avoiding fossil fuel consumption is imperative. I think that that is valuable. But it need not stop there. Travel choices are important, especially for longer distances, but so are consumption choices and energy usage and efficiency.”
Charlie Wilson, a researcher at the Tyndall Centre and IIASA, recently won a grant from the European Research Council to explore the role that social influence plays in spreading climate innovations. He says, “As social animals we are strongly influenced by what others do; as psychological beings we strive for consistency. Changing a behavior – like cycling to work – may have a small impact in isolation. But this impact is magnified through positive spillover effects. Others may imitate or be inspired by our commitment to cycling. And this change in behavior may also strengthen the pro-environmental aspects of our own self-identity, reducing dissonance between our work and domestic lives, and supporting further changes in behavior.”
Of course there are benefits of cycling beyond the environmental or climate impact, which is one reason that once they start, many people keep it up. Cycling regularly can save money compared to commuting by car or public transport, and like any regular form of exercise, it can bring health benefits and stress relief. It also brings autonomy and flexibility compared to public transport.
Borken points to research showing that the health benefits of cycling outweigh the exposure to air pollutants that a cyclist might experience on busy city streets—and that automobile drivers are exposed to even higher levels of air pollution within their cars. Cyclists who ride to IIASA, located about 15km outside Vienna, probably have even lower exposure to air pollution riding along tree-lined bike paths.
“Riding to work in the morning wakes me up and prepares me for the day ahead. Even if windy and challenging, the return in the evening calms the mind while riding with colleagues at a pace that allows us to chat at the end of a busy workday. It’s truly one of the best ways to get exercise and stay healthy – good for the heart, good for the environment and, most importantly, good for the soul,” says Michaela Rossini, manager of the IIASA library and a co-organizer of Bike to Work Month at the institute.

For some staff members, one side benefit of cycling to IIASA is the beautiful sunrise along the Danube River ©Michaela Rossini | IIASA
Note: This article gives the views of the author, and not the position of the Nexus blog, nor of the International Institute for Applied Systems Analysis.
May 4, 2016 | Risk and resilience
By Junko Mochizuki, Research Scholar, IIASA Risk and Resilience Program
Experts in the field of emergency management like to emphasize that there are important “lessons learned” in the aftermath of disaster situations. After large disaster events such as the 2015 earthquake in Nepal, and 2013 super typhoon Yolanda in Philippines, forensic investigations are often conducted to reveal ”what went wrong” in the chains of command, identifying what we can do differently when the next big one strikes. Such forensic investigations are not only relevant for the field of emergency management, but also for the field of disaster and climate risk management, which seeks to identify the underlying causes of what went wrong in the long chains of developmental policy intervention.
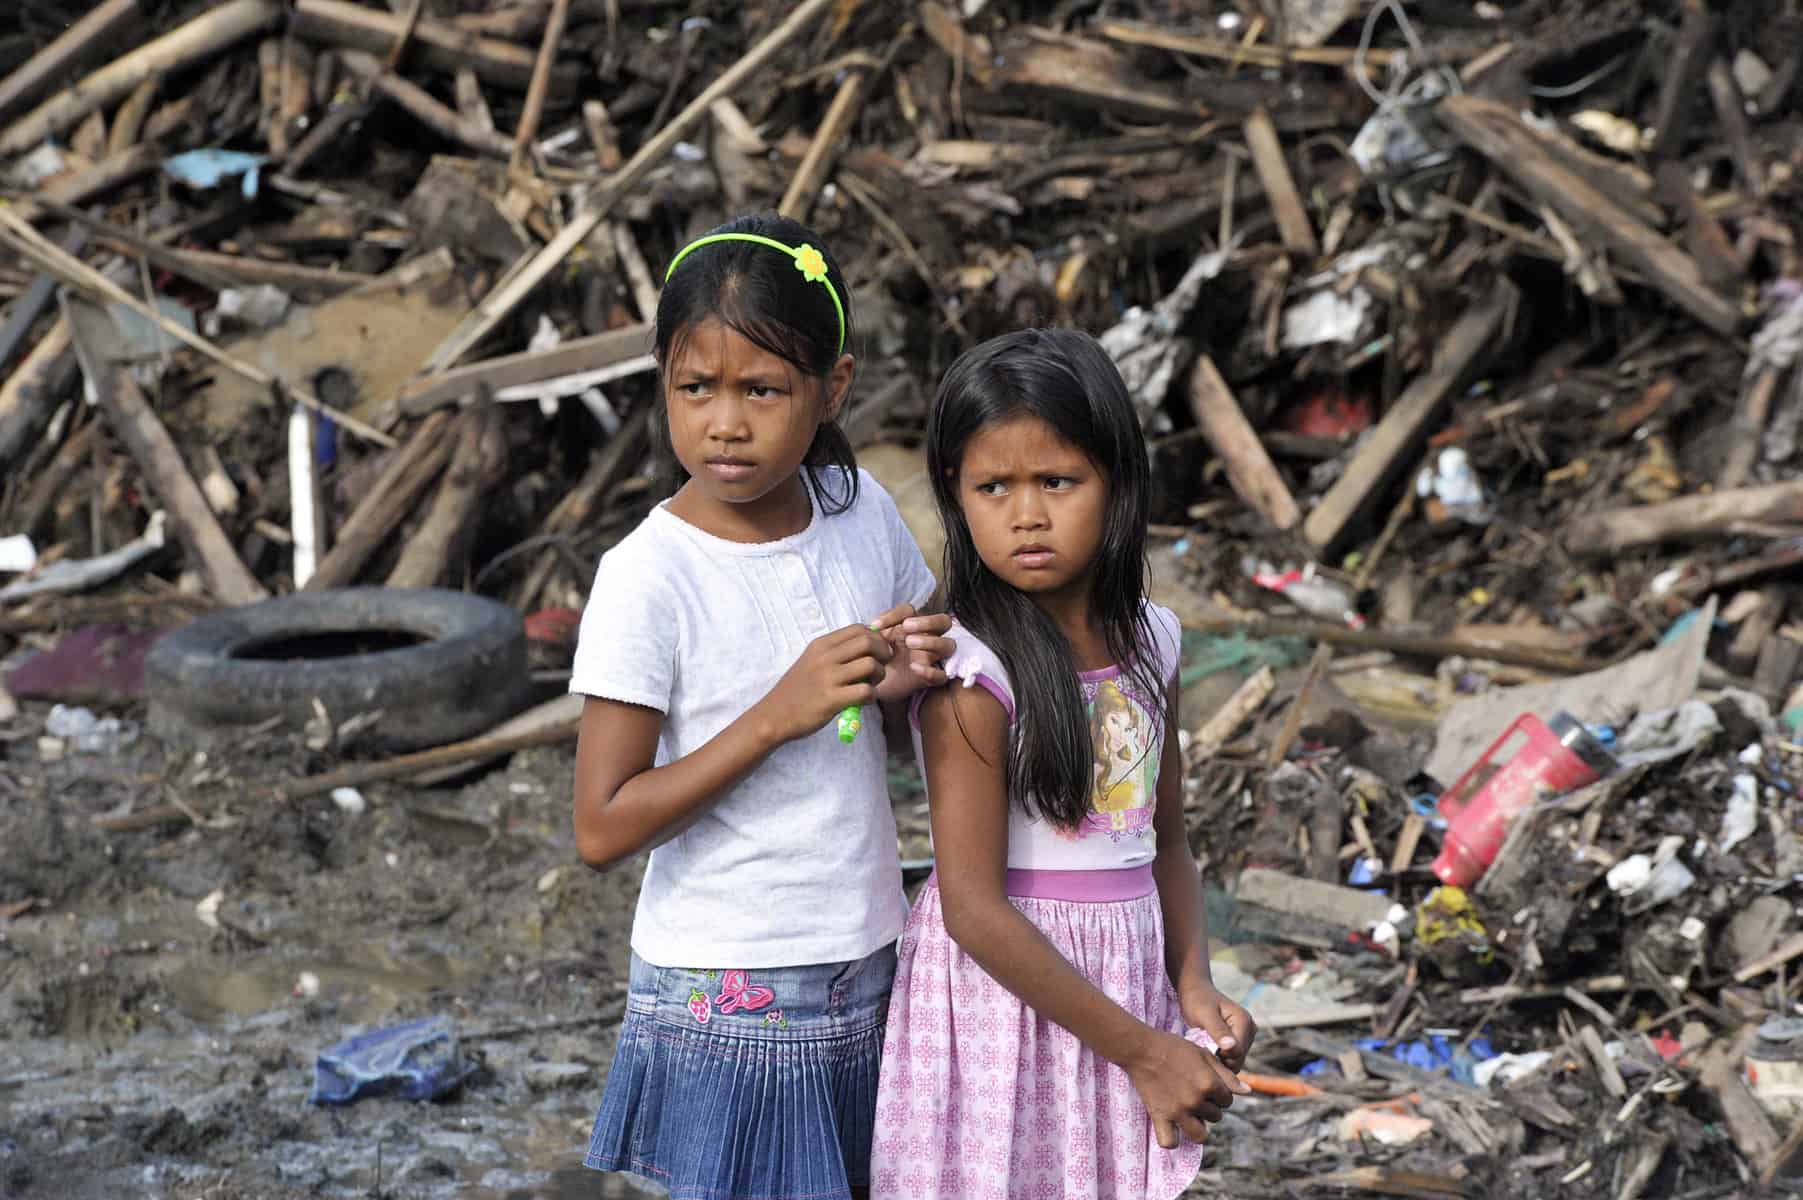
Survivors of Super Typhoon Yolanda in Tacloban City, Philippines, 2013. (cc) UN Photo/Evan Schneider
Over the years, researchers have identified a number of root causes that increase disaster risk—such as weak building codes and land use policy enforcement and overemphasis on ex-post emergency response as opposed to proactive management of disaster risk. Also, decades of economic studies looking at the costs and benefits of risk reduction investment show that such investment often pays off in the longer run. Yet, as the recent global trends of rising disaster risk unfortunately testify—we are far from learning these lessons effectively, or at least fast enough to beat the rising risk posed by future climate change: Global annual average disaster loss is estimated to have risen to approximately $300 billion in 2015 according to the UN Office for Disaster Risk Reduction (UNISDR).
As the special representative of the secretary general for disaster risk reduction, Robert Glasser wrote in the Guardian last week, “Every time there’s a mega disaster, there are lessons learned… The key question is always, how do you keep up the awareness after a couple of years?”
That is why the IIASA Risk and Resilience program’s research is increasingly focused on cognitive, behavioral, and governance aspects of societal learning on disaster risk reduction. We are currently working with public, private, and civil society stakeholders, asking the questions of why we, as a collective society, continue to fail to act on these lessons learned in disaster risk management and what we can do to change it. By combining both quantitative and qualitative systems analysis approaches, we are untangling why we make decisions the way we do, and what processes and institutional mechanisms directly and indirectly affect disaster risk and developmental outcome over the long term.
Given that catastrophic disasters are by definition rare events (hence opportunities for learning is naturally limited), we are doing this using novel methods such as participatory gaming or policy exercises in which we create virtual opportunities for stakeholders to experience complex decision-making in a safe learning environment. By creating stylized context for common decision-making (such as rural farmers making longer-term decisions on livelihood diversification, or urban planners addressing rising disaster risk due to rapid population growth), these gaming spaces serve as mechanisms through which stakeholders can not only learn about their cognitive and behavioral assumptions, but also through which learning can be accelerated, repeated, and shared among different communities facing similar development and disaster risk reduction challenges. We are running such policy exercises in the context of our flood resilience project and internal gaming project .
Decades of research have shown that there are common global lessons on development and disaster risk reduction but they are not so easily learned in practice. It is too often that that the windows of opportunities for policy learning are limited and we continue with business-as-usual of “lessons unlearned.” Creating an enabling environment for iterative learning is no easy task under these pragmatic constraints, but we hope that a bit of creativity and lots of hard work will eventually pay off in the long run.
Note: This article gives the views of the author, and not the position of the Nexus blog, nor of the International Institute for Applied Systems Analysis.
Apr 27, 2016 | Demography
By Sergei Scherbov, IIASA World Population Program (This post was originally published on The Conversation)
The populations of most countries of the world are aging, prompting a deluge of news stories about slower economic growth, reduced labor force participation, looming pension crises, exploding health care costs and the reduced productivity and cognitive functioning of the elderly.
These stories are dire, in part because the most widely used measure of aging – the old-age dependency ratio, which measures the number of older dependents relative to working-age people – was developed a century ago and implies the consequences of aging will be much worse than they are likely to be. On top of that, this ratio is used in political and economic discussions of topics such as health care costs and the pension burden – things it was not designed to address.
Turning 65 in 2016 doesn’t mean the same thing as hitting 65 in 1916. So instead of relying on the old-age dependency ratio to figure out the impact of aging, we propose using a series of new measures that take changes in life expectancy, labor participation and health spending into account. When you take these new realities into account, the picture looks a lot brighter.

How facts from the census questionnaire were tabulated into statistics in 1950. © The U.S. National Archives/Flickr
Our tools to measure aging have aged
The most commonly used measure of population aging is the “old-age dependency ratio,” which is the ratio of the number of people 65 years or older to those 20 to 64.
But, since the old-age dependency ratio was introduced in the early 1900s, most countries have experienced a century of rising life expectancy, and further increases are anticipated.
For instance, in 1914, life expectancy at birth in Sweden was 58.2 years (average for both sexes). By 2014, it had risen to 82.2 years. In 1935, when the U.S Social Security Act was signed into law, 65-year-olds were expected to live 12.7 more years, on average. In 2013, 65 year-olds may expect to live 19.5 years more.
But these changes aren’t reflected in the conventional statistics on aging. Nor is the fact that many people don’t just stop working when they turn 65, and that people are staying healthier for longer.
To get a better sense of what population aging really means today, we decided to develop a new set of measures that take these new realities into account to replace the old-age dependency ratio. And instead of one ratio, we created several ratios to evaluate health care costs, labor force participation and pensions.
Who retires at 65 anymore?
One of these new realities is that the number of people working into their late 60’s and beyond is going up. In 1994, 26.8% of American men aged 65-69 participated in the labor force. That figure climbed to 36.1% in 2014 and is forecast to reach 40% by 2024. And the trend is similar for even older men, with 17% of those aged 75-79 expected to still be working in a decade, up from just 10% in 1994.
Clearly, these older people did not get the message that they were supposed to become old-age dependents when they turned 65.
This isn’t unique to the U.S. Rates like these in many countries have been rising. In the U.K., for instance, the labor force participation rate of 65- to 69-year-old men was 24.2% in 2014, and in Israel it was 50.2%, up from 14.8% and 27.4%, respectively, in 2000. In part this is because older people now often have better cognitive functioning than their counterparts who were born a decade earlier.
So, instead of assuming that people work only from ages 20 to 64 and become old-age dependents when they hit 65, we have computed “economic dependency ratios” that take into account observations and forecasts of labor force participation rates. This tells us how many adults not in the labor force there are for every adult in the labor force, giving us a more accurate picture than using 65 as a cutoff point. We used forecasts produced by the International Labor Organization to figure this out.
The old-age dependency ratio in the U.S. is forecast to increase by 61% from 2013 to 2030. But using our economic dependency ratio, the ratio of adults in the labor force to adults not in the labor force increases by just 3% over that period.
Clearly, doom and gloom stories about U.S. workers having to support so many more non-workers in the future may need to be reconsidered.
Is the health care burden going to be so high?
Another reality is that while health care costs will go up with an older population, they won’t rise as much as traditional forecasts estimate.
Instead of assuming that health care costs rise dramatically on people’s 65th birthdays, as the old-age dependency ratio implicitly does, we have produced an indicator that takes into account the fact that most of the health care costs of the elderly are incurred in their last few years of life. Increasing life expectancy means those final few years happen at ever later ages.
In Japan, for example, when the burden of the health care costs of people aged 65 and up on those 20-64 years old is assessed using only the conventional old-age dependency ratio, that burden is forecast to increase 32% from 2013 to 2030. When we compute health care costs based on whether people are in the last few years of their lives, the burden increases only 14%.
Pension ages are going up
The last reality we considered concerns pensions.
In most OECD countries, the age at which someone can begin collecting a full public pension is rising. In a number of countries, such as Sweden, Norway and Italy, pension payouts are now explicitly linked to life expectancy.
In Germany, the full pension age will rise from 65 to 67 in 2029. In the U.S., it used to be 65, is now 66 and will soon rise to 67.
Instead of assuming that everyone receives a full public pension at age 65, which is what the old-age dependency ratio implicitly does, we have computed a more realistic ratio, called the pension cost dependency ratio, that incorporates a general relationship between increases in life expectancy and the pension age. The pension cost dependency ratio shows how fast the burden of paying public pensions is likely to grow.
For instance, in Germany, the old-age dependency ratio is forecast to rise by 49% from 2013 to 2030, but 65-year-old Germans will not be eligible for a full pension in 2030. Our pension cost dependency ratio increases by 26% over the same period. Instead of indicating that younger Germans will have to pay 49% more to support pensioners in 2030 compared to what they paid in 2013, taking planned increases in the full pension age into account, we see that the increase is 26%.

Pranom Chartyothin, a 72-year-old bus conductor, sells and collects bus tickets in downtown Bangkok, Thailand. Photo Credit: Jorge Silva/Reuters, CC BY
Sixty-five just isn’t that old anymore
In addition to this suite of measures focused on particular aspects of population aging, it is also useful to have a general measure of population aging. We call our general measure of population aging the prospective old-age dependency ratio.
People do not suddenly become old-age dependents on their 65th birthdays. From a population perspective, it makes more sense to classify people as being old when they are getting near the end of their lives. Failing to adjust who is categorized as old based on the changing characteristics of people and their longevity can make aging seem faster than it will be.
In our prospective old-age dependency ratio, we define people as old when they are in age groups where the remaining life expectancy is 15 years or less. As life expectancy increases, this threshold of old age increases.
In the U.K., for instance, the conventional old-age dependency ratio is forecast to increase by 33% by 2030. But when we allow the old-age threshold to change with increasing life expectancy, the resulting ratio increases by just 13 percent.
Populations are aging in many countries, but the conventional old-age dependency ratio makes the impact seem worse than it will be. Fortunately, better measures that do not exaggerate the effects of aging are now just a click away.
Note: This article gives the views of the author, and not the position of the Nexus blog, nor of the International Institute for Applied Systems Analysis.
Apr 7, 2016 | Environment
By Andrey Krasovskii, IIASA Ecosystems Services and Management Program
By 2090, the area burned by forest fires in the European Union could increase by 200% because of climate change. However, preventive fires could keep that increase to below 50%. Improved firefighting response could provide additional protection against forest fires. These findings were the result of modeling work we did for the EU Mediation project on projecting future burned areas and adaptation options in Europe. When we talk about these results, people often want to know more about how our model works, what assumptions it makes, and how reliable it is.
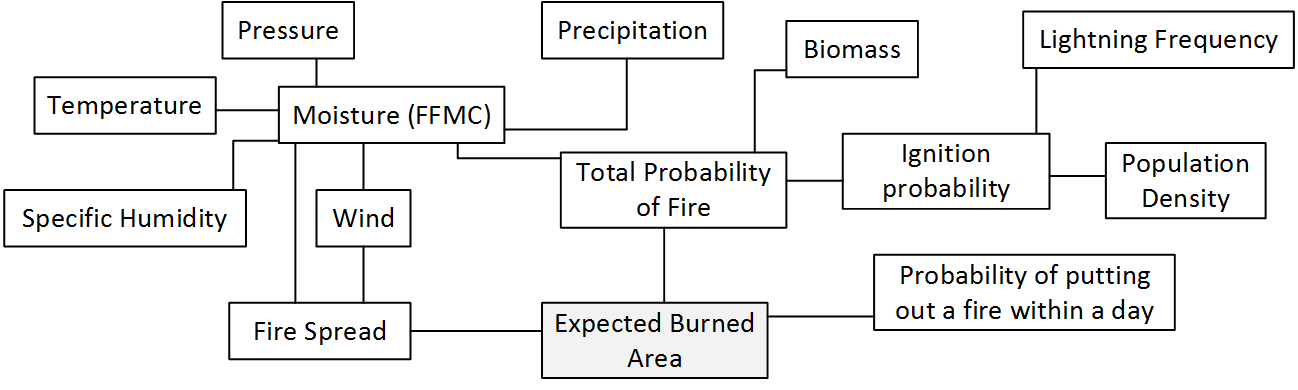
Figure 1. The WildFire cLimate impacts and Adaptation Model (FLAM) schematic – estimation of expected burned area.
The model is complex: every link in the schematic shown above represents a specific mathematical formula. These formulas have been developed by many researchers who studied how wildfire occurrence is related to climate, population, and biomass available for burning. Their results have been aggregated into mathematical relations and functions attempting to replicate real processes. The model code runs through the scheme with daily weather inputs in order to calculate the potential for fire ignition, spread, and burned areas. The model transforms spatial and intertemporal inputs into expected burned areas for 25km squares across the entirety of Europe. These squares can be summed up into geographic regions, e.g. countries, as well as burned areas can be aggregated over a given time period, e.g. 10 years.
It took days for our colleague Mirco Migliavacca to run the model during his work at the Joint Research Center of the European Commission. In fact, the scheme depicted in Figure 1 shows only a small piece of a larger picture reflecting the Community Land Model with the integrated fire module (CLM-AB), which he used. CLM-AB calculates all inputs in the indicated fire module, based on modeling processes in the global vegetation system. To speed up the running times for the case study focused on the wildfires in Europe, my colleague Nikolay Khabarov developed a standalone version of the fire model by decoupling the fire module from CLM-AB. When I joined the study, we had also found alternatives for input data, e.g. IIASA’s Global Forest Database, and implemented additional procedures in order to create our wildfire climate impacts and adaptation model (FLAM).
We used the historical data from satellite observations in order to validate modeling results. At the beginning many numerical experiments in CLM and FLAM did not give satisfactory results – there was either overestimation or underestimation of modeled burned areas compared to those reported in available datasets. One day a purely mathematical insight happened. We realized that in the fire algorithm implemented in FLAM, there is a parameter that can be factorized, mathematically speaking. This parameter, a probability of extinguishing a fire in a pixel in one day, was constant for Europe and set to 0.5. It became obvious that this parameter should vary with respect to a region. Factorization of this variable gave a possibility to avoid routine calculations, and use it for calibrating the model over a historical period. This can be done analytically by solving a corresponding polynomial equation. Analytical findings allowed us to introduce an effective calibration procedure and at the same time to estimate a firefighting efficiency on a country level. Further, using the advice of our colleagues Anatoly Shvidenko and Dmitry Schepaschenko, we have introduced adaptation options in the model, for example prescribed burnings, which firefighters use to reduce the fuel availability and, consequently, potential of a major fire.

Prescribed burnings are one tool that can help prevent major wildfires. (cc) US Bureau of Land Management via Flickr
Once we had calibrated the model so that it adequately performed on the historical period (using historical climate data), we used climate scenarios to produce future projections. Currently, we are working on further improvements in modeling accuracy in annual burned areas by introducing additional regionally specific factors in the model. In the recent study published in the International Journal of Wildland Fire, we suggested improving the original model by modifying the fire probability function reflecting fuel moisture. This modification allows for a dramatic improvement of accuracy in modelled burned areas for a range of European countries.
Despite some success in modeling annual burned areas in Europe, we still have difficulties in predicting the extreme fires, in particular in some more arid and hence vulnerable regions such as Spain. However, we accept the challenge, because credible modeling results in terms of burned areas provide important information for assessing economic damages and CO2 emissions, due to climate and human activities. Our research has the potential to help society to realize these risks and undertake preventive measures. It also delivers an additional scientific value due to the fact, that fire risks must be included in forest management models.
I would like to thank all the study co-authors for their valuable contributions and efficient collaboration.
Reference
Krasovskii, A., Khabarov, N., Migliavacca, M., Kraxner, F. and Obersteiner, M. (2016) Regional aspects of modelling burned areas in Europe. International Journal of Wildland Fire. http://dx.doi.org/10.1071/WF15012
Note: This article gives the views of the interviewee, and not the position of the Nexus blog, nor of the International Institute for Applied Systems Analysis.
Mar 18, 2016 | Alumni, Systems Analysis, Young Scientists
By Célian Colon, PhD student at the Ecole Polytechnique in France & IIASA Mikhalevich award winner
How can we best tackle risks in our complex and interconnected economies? With globalization and information technologies, people and processes are increasingly interdependent. Great ideas and innovations can spread like wildfire. However, so can turbulence and crises. The propagation of risks is a key concern for policymakers and business leaders. Take the example of production disruption: with global supply chains, local disasters or man-made accidents can propagate from one place to another, and generate significant impact. How can this be prevented?

Risk propagation is like a domino effect. Credit: Martin Fisch (cc) via Flickr
As part of my PhD research, I met professionals on the ground and realized that supply risk propagation is a particularly tricky issue, since most parts of the chains are out of their control. Supply chains can be very long, and change with time. It is difficult to keep track of who is working with whom, and who is exposed to which hazard. How then can individual decisions mitigate systemic risks? This question directly connects to the deep nature of systemic problems: everyone is in the same boat, shaping it and interacting with each other, but no one is individually able to steer it. Surprising phenomena can emerge from such interactions, wonderfully illustrated by bird flocking and fish schooling.
As an applied mathematician thrilled by such complexities, I was enthusiastic to work on this question. I built a model where firms produce and interact through supply chain relationships. Pen and paper analyses helped me understand how a few firms could optimally react to disruptions. But to study the behavior of truly complex chains, I needed the calculation power of computers. I programmed networks involving a large number of firms, and I analyzed how localized failures spread throughout these networks, and generate aggregate losses. Given the supply strategy adopted by each firm, how could systemic risk be mitigated?
With my collaborators at IIASA, Åke Brännström, Elena Rovenskaya, and Ulf Dieckmann, we have highlighted the key role of coordination in managing risks. Each individual firm affects how risks propagate along the chain. If they all solely focus on maximizing their own profit, significant amounts of risk remain. But if they cooperate, and take into account the impact of their decisions on the risk profile of their trade partners, risk can be effectively mitigated. Reducing systemic risks can thus be seen as a common good: costs are heterogeneously borne by firms while benefits are shared. Interestingly, even in long supply chains, most systemic risks can be mitigated if firms only cooperate with only one or two partners. By facilitating coordination along critical supply chains, policy-makers can therefore contribute to the reduction of risk propagation.
Colon’s model analyzes how firms produce and interact through supply chain relationships. Credit: Jan Buchholtz (cc) via Flickr
Drawing robust conclusions from such models is a real challenge. On this matter, I benefited from the experience of my IIASA supervisors. Their scientific intuitions greatly helped me focusing on the most fertile ground. It was particularly exciting to borrow techniques from evolutionary ecology and apply them to an economic context. Conceptually, how economic agents co-adapt and influence each other shares many similarities with the co-evolution of individuals in an ecological environment. To address such complex issues, I strongly believe in the plurality of approaches: by illuminating a problem from different angles, we can hope to see it more clearly!
Note: This article gives the views of the author, and not the position of the Nexus blog, nor of the International Institute for Applied Systems Analysis.
You must be logged in to post a comment.