Nov 10, 2020 | Air Pollution, China, Climate Change, Energy & Climate, Young Scientists
By Xu Wang, IIASA Young Scientists Summer Program (YSSP) alumnus and Assistant Professor at Beijing University of Technology and Pallav Purohit, researcher in the IIASA Air Quality and Greenhouse Gases Program.
Xu Wang and Pallav Purohit write about their recent study in which they found that accelerating the transition to climate-friendly and energy-efficient air conditioning in the Chinese residential building sector could expedite building a low-carbon society in China.

© Shao-chun Wang | Dreamstime.com
China saw the fastest growth worldwide in energy demand for space cooling in buildings over the last two decades, increasing at 13% per year since 2000 and reaching nearly 400 terawatt-hours (TWh) of electricity consumption in 2017. This growth was largely driven by increasing income and growing demand for thermal comfort. As a result, space cooling accounted for more than 10% of total electricity growth in China since 2010 and around 16% of peak electricity load in 2017. That share can reach as much as 50% of peak electricity demand on extremely hot days, as seen in recent summers. Cooling-related carbon dioxide (CO2) emissions from electricity consumption consequently increased fivefold between 2000 and 2017, given the strong reliance on coal-fired power generation in China [1].
In our recent publication in the journal Environmental Science and Technology, we used a bottom-up modeling approach to predict the penetration rate of room air conditioners in the residential building sector of China at the provincial level, taking urban-rural heterogeneity into account. Our results reveal that increasing income, growing demand for thermal comfort, and warmer climatic conditions, could drive an increase in the stock of room air conditioners in China from 568 million units in 2015 to 997 million units in 2030, and 1.1 billion units in 2050. In urban China, room air conditioner ownership per 100 households is expected to increase from 114 units in 2015 to 219 units in 2030, and 225 units in 2050, with slow growth after 2040 due to the saturation of room air conditioners in the country’s urban households. Ownership of room air conditioners per 100 households in rural China could increase from 48 units in 2015 to 147 units in 2030 and 208 units in 2050 [2].
The Kigali Amendment to the Montreal Protocol on Substances that Deplete the Ozone Layer will help protect the climate by phasing down high global warming potential (GWP) hydrofluorocarbons (HFCs), which are commonly used as refrigerants in cooling technologies [3]. Promoting energy efficiency of cooling technologies together with HFC phase-down under the amendment can significantly increase those climate co-benefits. It is in this context that we assessed the co-benefits associated with enhanced energy efficiency improvement of room air conditioners (e.g., using efficient compressors, heat exchangers, valves, etc.) and the adoption of low-GWP refrigerants in air conditioning systems. The annual electricity saving from switching to more efficient room air conditioners using low-GWP refrigerants is estimated at almost 1000 TWh in 2050 when taking account of the full technical energy efficiency potential. This is equivalent to approximately 4% of the expected total energy consumption in the Chinese building sector in 2050, or the avoidance of 284 new coal-fired power plants of 500 MW each.
Our results indicate that the cumulative greenhouse gas mitigation associated with both the electricity savings and the substitution of high-GWP refrigerants makes up 2.6% of total business-as-usual CO2 equivalent emissions in China over the period 2020 to 2050. Therefore, the transition towards the uptake of low-GWP refrigerants is as vital as the energy efficiency improvement of new room air conditioners, which can help and accelerate the ultimate objective of building a low-carbon society in China. The findings further show that reduced electricity consumption could mean lower air pollution emissions in the power sector, estimated at about 8.8% for sulfur dioxide (SO2), 9.4% for nitrogen oxides (NOx), and 9% for fine particulate matter (PM2.5) emissions by 2050 compared with a pre-Kigali baseline.
China can deliver significant energy savings and associated reductions in greenhouse gas and air pollution emissions in the building sector by developing and implementing a comprehensive national policy framework, including legislation and regulation, information programs, and incentives for industry. Energy efficiency and refrigerant standards for room air conditioning systems should be an integral part of such a framework. Training and awareness raising can also ensure proper installation, operation, and maintenance of air conditioning equipment and systems, and mandatory good practice with leakage control of the refrigerant during the use and end-of-life recovery. Improved data collection, research, and cooperation with manufacturers can equally help to identify emerging trends, technology needs, and energy efficiency opportunities that enable sustainable cooling.
References:
[1] IEA (2019). The Future of Cooling in China: Delivering on Action Plans for Sustainable Air Conditioning, International Energy agency (IEA), Paris.
[2] Wang X, Purohit P, Höglund Isaksson L, Zhang S, Fang H (2020). Co-benefits of energy-efficient air conditioners in the residential building sector of China, Environmental Science & Technology, 54 (20): 13217–13227 [pure.iiasa.ac.at/16823]
[3] Purohit P, Höglund-Isaksson L, Dulac J, Shah N, Wei M, Rafaj P, Schöpp W (2020). Electricity savings and greenhouse gas emission reductions from global phase-down of hydrofluorocarbons, Atmospheric Chemistry and Physics, 20 (19): 11305-11327 [pure.iiasa.ac.at/16768]
Note: This article gives the views of the author, and not the position of the Nexus blog, nor of the International Institute for Applied Systems Analysis (IIASA).
Oct 2, 2020 | Climate Change, Economics, Food, Poverty & Equity
By Charlotte Janssens, guest researcher in the IIASA Ecosystems Services and Management Program and researcher at the University of Leuven and Petr Havlík, Acting Ecosystems Services and Management Program Director.
Charlotte Janssens and Petr Havlik write about their recent study in which they found that world trade can relieve regional impacts of climate change on food production and provide a way to reduce the risk of hunger.

© Alisali | Dreamstime.com
In a warmer world, decreasing crop yields and rising food prices are expected to strongly jeopardize the achievement of Sustainable Development Goal (SDG) 2 – ending global hunger. Climate change has consequences for food production worldwide, but there are clear differences between regions. Sufficient food is expected to remain available in the Northern hemisphere, while in regions such as sub-Saharan Africa or South Asia, falling crop yields may lead to higher food prices and a sharp rise in hunger.
In our recent publication in Nature Climate Change, we find that world trade can relieve these regional differences and provide a way to reduce hunger risks under climate change. For example, if regions like Europe and Latin America where wheat and corn thrive increase their production and export food to regions under heavy pressure from the warming of the Earth, food shortages can be reduced.
Global Hunger by 2050
The State of Food and Nutrition Security in the World 2020 reports that globally almost 690 million people were at risk of hunger in 2019. Many factors determine how global hunger will develop in the future, including population growth and economic development, as demonstrated in a study in Environmental Research Letters. Our article uses the “middle-of-the-road” socioeconomic pathway where population reaches 9.2 billion, income grows according to historical trends, and the number of undernourished people decreases to 122 million by 2050. Within this socioeconomic setting, we investigate the impact of different climate change scenarios and trade policies on global hunger by 2050.
The worst-case climate scenario of a 4°C warming leads to an extra 55 million people enduring hunger – a 45% increase compared to the situation without climate change. In a protectionist trade environment where vulnerable regions cannot increase their food imports as a response to climate impacts, this effect rises to 73 million. The largest hunger risks are located in South Asia and sub-Saharan Africa, with respectively a 33 million and 15 million increase in people at risk of hunger in the worst-case climate scenario.
Where barriers to trade are eliminated, “only” 20 million people endure food shortages due to climate change. While this number is high, it is a vast improvement on the 73 million people that would potentially be exposed to hunger without the suggested measures. In the milder climate change scenarios, an intensive liberalization of trade may prevent even more people from enduring hunger owing to global warming. Yet a liberalization of international trade may also involve potential dangers. If Asian countries increase rice exports without making more imports of other products possible, they could well end up with a food shortage within their own borders.
Mobilizing Investment
Our study shows not only that the challenge of ending global hunger is strongly determined by the extent of progress on SDG 13 (climate action), but also that achievement of SDG 2 (zero hunger) is affected by developments articulated in SDG 9 (resilient infrastructure). We find that international trade can relieve regional food shortages and reduce hunger, particularly where trade barriers are eliminated. Such trade integration requires phasing out import tariffs as well as the facilitation of trade through investment in transport infrastructure and technology. Especially in low-income regions such as sub-Saharan Africa infrastructure is weak. In its 2018 African Economic Outlook, the African Development Bank (AfDB) estimates that between USD 130 billion and 170 billion a year is needed to bridge the infrastructure gap in the region by 2025. Given that infrastructure finance averaged only USD 75 billion in recent years, and the largest contribution is coming from budget-constrained national governments, alternative financing through institutional and private investments could be crucial in the face of climate change.
Crisis and Protectionism
In times of crisis, countries are inclined to adopt a protectionist stance. For example, in the face of the current COVID-19 pandemic, several countries have temporarily closed their borders for the export of important food crops (see IFPRI Food Trade Policy Tracker for updated information). Some commentators warn that such measures can have large detrimental effects on food security. Our study finds that also in the context of climate change, a well-thought-out liberalization of trade is needed in order to be able to relieve food shortages properly.
Reference
Janssens C, Havlík P, Krisztin T, Baker J, Frank S, Hasegawa T, Leclère D, Ohrel S, et al. (2020). Global hunger and climate change adaptation through international trade.
Nature Climate Change [
pure.iiasa.ac.at/16575]
This blog post first appeared on the SDG Knowledge Hub website. Read the original post here.
Note: This article gives the views of the authors, and not the position of the Nexus blog, nor of the International Institute for Applied Systems Analysis.
Sep 23, 2020 | Alumni, Data and Methods, Environment, IIASA Network
By Victor Maus, alumnus of the IIASA Ecosystems Services and Management Program and researcher at the Vienna University of Economics and Business
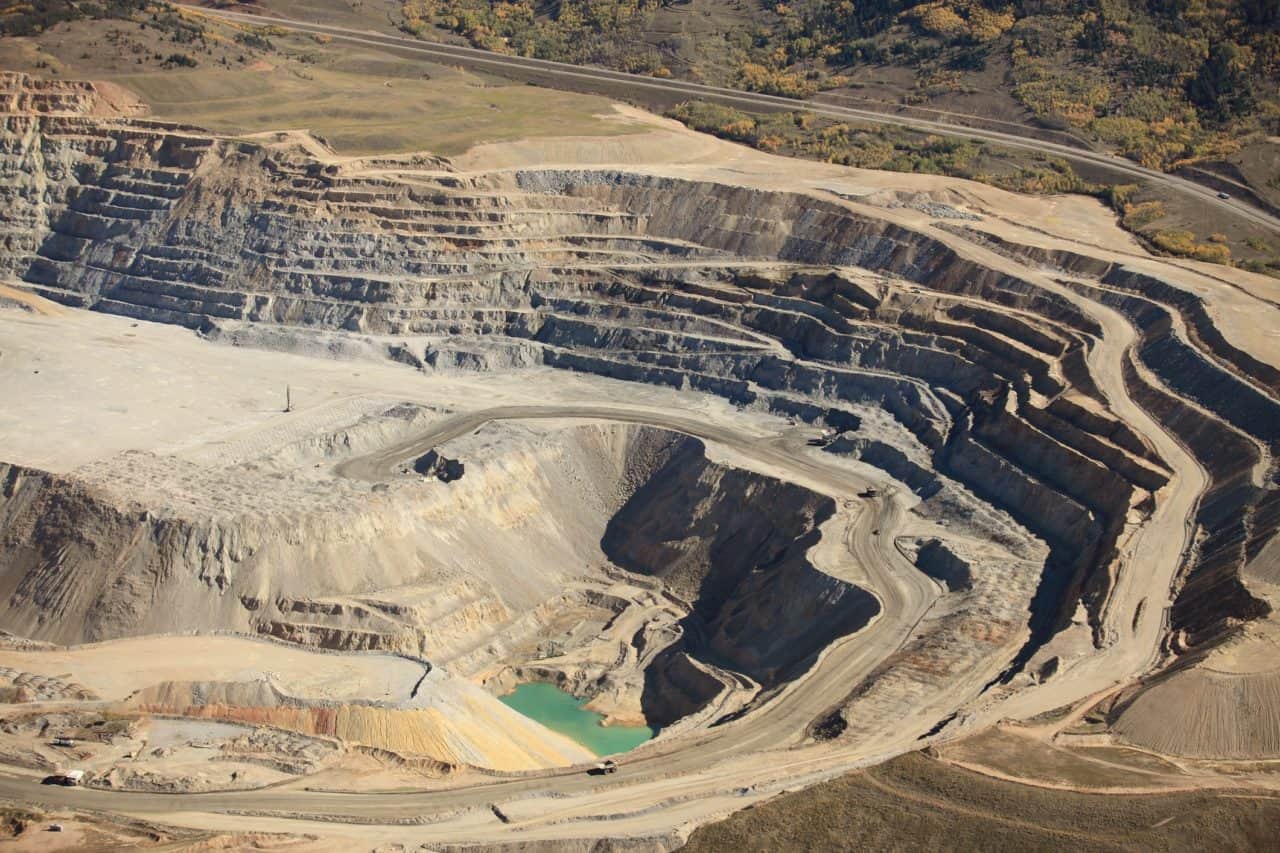
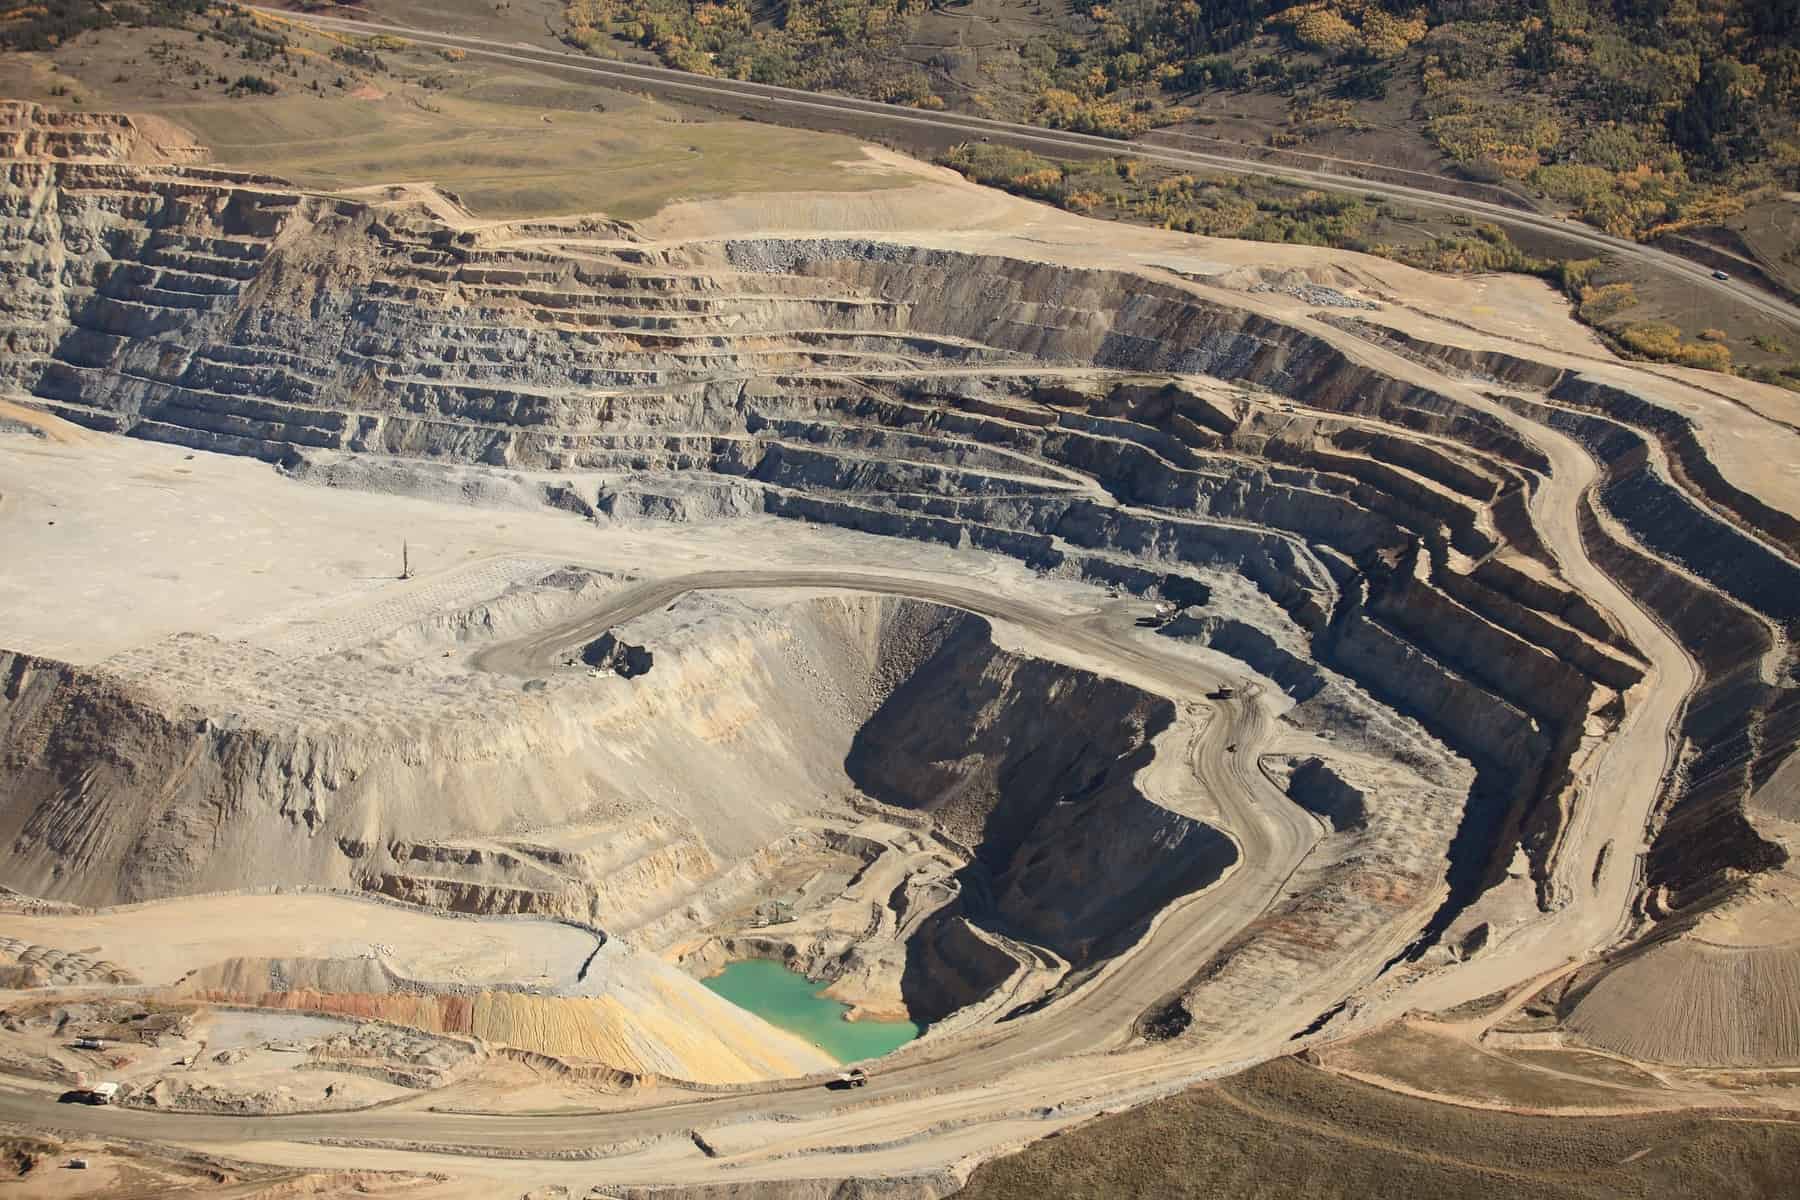
The mining of coal, metals, and other minerals causes loss of natural habitats across the entire globe. However, available data is insufficient to measure the extent of these impacts. IIASA alumnus Victor Maus and his colleagues mapped more than 57,000 km² of mining areas over the whole world using satellite images.
© Pix569 | Dreamstime.com
Our modern lifestyles and consumption patterns cause environmental and social impacts geographically displaced in production sites thousands of kilometres away from where the raw materials are extracted. Complex supply chains connecting mineral mining regions to consumers often obscure these impacts. Our team at the Vienna University of Economics and Business is investigating these connections and associated impacts on a global-scale www.fineprint.global.
However, some mining impacts are not well documented across the globe, for example, where and how much area is used to extract metals, coal, and other essential minerals are unknown. This information is necessary to assess the environmental implications, such as forest and biodiversity loss associated with mining activities. To cover this data gap, we analyzed the satellite images of more than 6,000 known mining regions all around the world.
Visually identifying such a large number of mines in these images is not an easy task. Imagine you are flying and watching from the window of a plane, how many objects on the Earth’s surface can you identify and how fast? Using satellite images, we searched and mapped mines over the whole globe. It was a very time-consuming and exhausting task, but we also learned a lot about what is happening on the ground. Besides, it was very interesting to virtually visit a vast range of mining places across the globe and realize the large variety of ecosystems that are affected by our increasing demand for nature’s resources.
The result of our adventure is a global data set covering more than 21,000 mapped areas adding up to around 57,000 km² (that is about the size of Croatia or Togo). These mapped areas cover open cuts, tailings dams, piles of rocks, buildings, and other infrastructures related to the mining activities — some of them extending to almost 10 km (see figure below). We also learned that around 50 % of the mapped mining area is concentrated in only five countries, China, Australia, the United States, Russia, and Chile.

Examples of mines viewed from Google Satellite images. (a) Caraj\'{a}s iron ore mine in Brazil, (b) Batu Hijau copper-gold mine in Indonesia, and (c) Super Pit gold mine in Australia. In purple is the data collected for these mines (Figure source: www.nature.com/articles/s41597-020-00624-w).
Using these data, we can improve the calculation of environmental indicators of global mineral extraction and thus support the development of less harmful ways to extract natural resources. Further, linking these impacts to supply chains can help to answer questions related to our consumption of goods. For example, which impacts the extraction of minerals used in our smartphones cases and where on the planet they occur? We hope that many others will use the mining areas data for their own research and applications. Therefore, the data is fully open to everyone. You can explore the global mining areas using our visualization tool at www.fineprint.global/viewer or you can download the full data set from doi.pangaea.de/10.1594/PANGAEA.910894. The complete description of the data and methods is in our paper available from www.nature.com/articles/s41597-020-00624-w.
This blog post first appeared on the Springer Nature “Behind the paper” website. Read the original post here.
Note: This article gives the views of the authors, and not the position of the Nexus blog, nor of the International Institute for Applied Systems Analysis.
Sep 18, 2020 | Data and Methods, Science and Policy, Systems Analysis
By Daniel Huppmann, research scholar in the IIASA Energy Program
Daniel Huppmann sheds light on how open-source scientific software and FAIR data can bring us one step closer to a community of open science.

© VectorMine | Dreamstime.com
Over the past decade, the open-source movement (e.g., the Free Software Foundation (FSF) and the Open Source Initiative (OSI)) has had a tremendous impact on the modeling of energy systems and climate change mitigation policies. It is now widely expected – in particular by and of early-career researchers – that data, software code, and tools supporting scientific analysis are published for transparency and reproducibility. Many journals actually require that authors make the underlying data available in line with the FAIR principles – this acronym stands for findable, accessible, interoperable, and reusable. The principles postulate best-practice guidance for scientific data stewardship. Initiatives such as Plan S, requiring all manuscripts from projects funded by the signatories to be released as open-access publications, lend further support to the push for open science.
Alas, the energy and climate modeling community has so far failed to realize and implement the full potential of the broader movement towards collaborative work and best practice of scientific software development. To live up to the expectation of truly open science, the research community needs to move beyond “only” open-source.
Until now, the main focus of the call for open and transparent research has been on releasing the final status of scientific work under an open-source license – giving others the right to inspect, reuse, modify, and share the original work. In practice, this often means simply uploading the data and source code for generating results or analysis to a service like Zenodo. This is obviously an improvement compared to the previously common “available upon reasonable request” approach. Unfortunately, the data and source code are still all too often poorly documented and do not follow best practice of scientific software development or data curation. While the research is therefore formally “open”, it is often not easily intelligible or reusable with reasonable effort by other researchers.
What do I mean by “best practice”? Imagine I implement a particular feature in a model or write a script to answer a specific research question. I then add a second feature – which inadvertently changes the behavior of the first feature. You might think that this could be easily identified and corrected. Unfortunately, given the complexity and size to which scientific software projects tend to quickly evolve, one often fails to spot the altered behavior immediately.
One solution to this risk is “continuous integration” and automated testing. This is a practice common in software development: for each new feature, we write specific tests in an as-simple-as-possible example at the same time as implementing the function or feature itself. These tests are then executed every time that a new feature is added to the model, toolbox, or software package, ensuring that existing features continue to work as expected when adding a new functionality.
Other practices that modelers and all researchers using numerical methods should follow include using version control and writing documentation throughout the development of scientific software rather than leaving this until the end. In addition, not just the manuscript and results of scientific work should be scrutinized (aka “peer review”), but such appraisal should also apply to the scientific software code written to process data and analyze model results. In addition, like the mentoring of early-career researchers, such a review should not just come at the end of a project but should be a continuous process throughout the development of the manuscript and the related analysis scripts.
In the course that I teach at TU Wien, as well as in my work on the MESSAGEix model, the Intergovernmental Panel on Climate Change Special Report on Global Warming of 1.5°C scenario ensemble, and other projects at the IIASA Energy Program, I try to explain to students and junior researchers that following such best-practice steps is in their own best interest. This is true even when it is just a master’s thesis or some coursework assignment. However, I always struggle to find the best way to convince them that following best practice is not just a noble ideal in itself, but actually helps in doing research more effectively. Only when one has experienced the panic and stress caused by a model not solving or a script not running shortly before a submission deadline can a researcher fully appreciate the benefits of well-structured code, explicit dependencies, continuous integration, tests, and good documentation.
A common trope says that your worst collaborator is yourself from six months ago, because you didn’t write enough explanatory comments in your code and you don’t respond to emails. So even though it sounds paradoxical at first, spending a bit more time following best practice of scientific software development can actually give you more time for interesting research. Moreover, when you then release your code and data under an open-source license, it is more likely that other researchers can efficiently build on your work – bringing us one step closer to a community of open science!
Note: This article gives the views of the authors, and not the position of the Nexus blog, nor of the International Institute for Applied Systems Analysis.
Sep 15, 2020 | Biodiversity, Ecosystems, Environment
IIASA researchers Michael Obersteiner, David Leclère, and Piero Visconti discuss the findings of their latest paper, which proposes pathways to reverse the current trend of biodiversity loss and shows that the next 30 years will be pivotal for the Earth’s wildlife.
Species are going extinct at an unprecedented rate. Wildlife populations have fallen by more than two-thirds over the last 50 years, according to a new report from the World Wildlife Fund. The sharpest declines have occurred throughout the world’s rivers and lakes, where freshwater wildlife has plummeted by 84% since 1970 – about 4% per year.
But why should we care? Because the health of nature is intimately linked to the health of humans. The emergence of new infectious diseases like COVID-19 tend to be related to the destruction of forests and wilderness. Healthy ecosystems are the foundation of today’s global economies and societies, and the ones we aspire to build. As more and more species are drawn towards extinction, the very life support systems on which civilization depends are eroded.
Even for hard-nosed observers like the World Economic Forum, biodiversity loss is a disturbing threat with few parallels. Of the nine greatest threats to the world ranked by the organization, six relate to the ongoing destruction of nature.
© Chris Van Lennep | Dreamstime.com
Economic systems and lifestyles which take the world’s generous stocks of natural resources for granted will need to be abandoned, but resisting the catastrophic declines of wildlife that have occurred over the last few decades might seem hopeless. For the first time, we’ve completed a science-based assessment to figure out how to slow and even reverse these trends.
Our new paper in Nature featured the work of 60 coauthors and built on efforts steered by the Intergovernmental Panel on Biodiversity and Ecosystem Services. We considered ambitious targets for rescuing global biodiversity trends and produced pathways for the international community to follow that could allow us to meet these goals.
Bending the curve
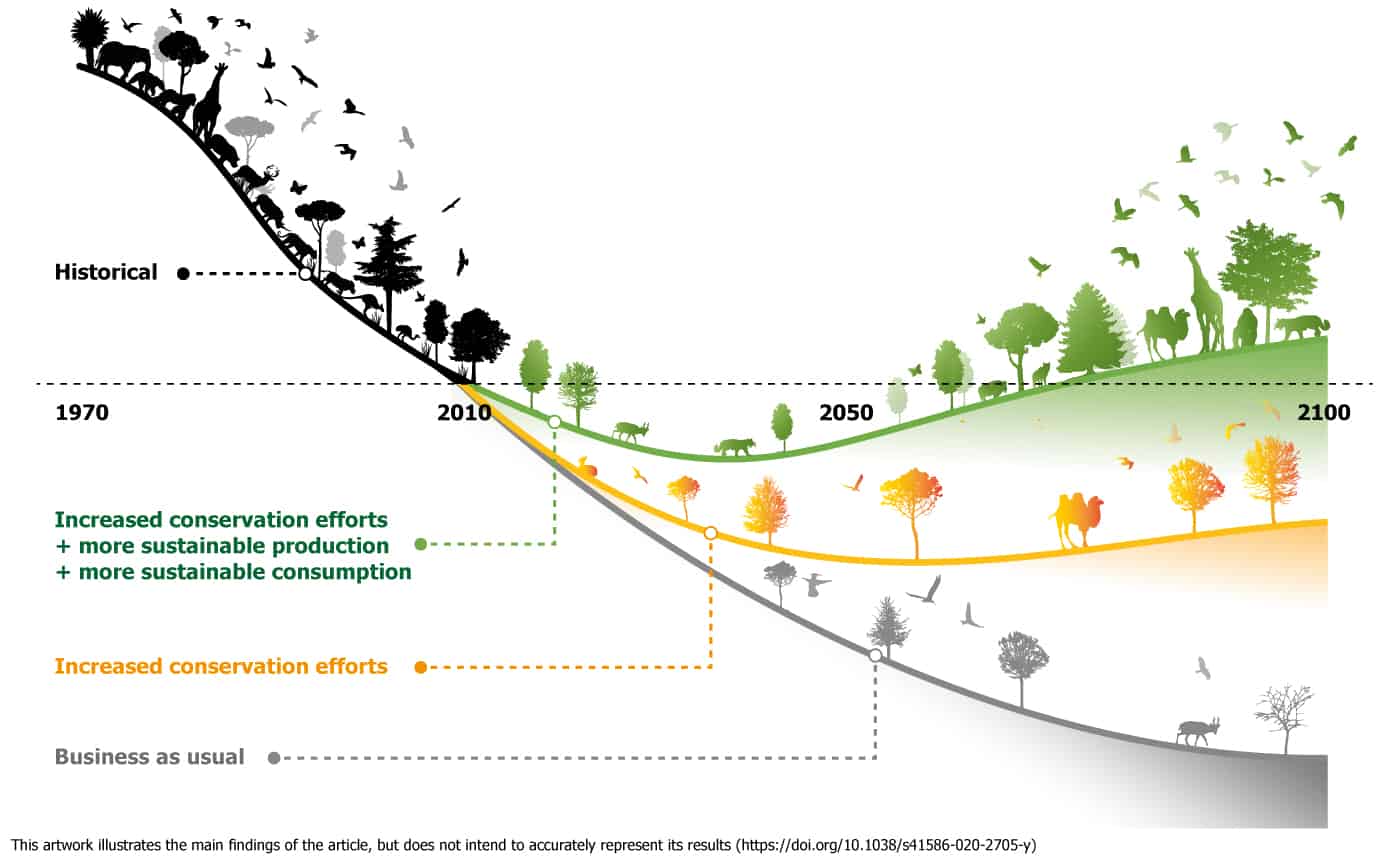
The targets of the UN Convention on Biological Diversity call for global trends of terrestrial wildlife to stop declining and start recovering by 2050 or earlier. Changes in how land is used – from pristine forest to cropland or pasture – rank among the greatest threats to biodiversity on land worldwide. So what are the necessary conditions for biodiversity to recover during the 21st century while still supporting growing and affluent human societies?
Two key areas of action stand out from the rest. First, there must be renewed ambition from the world’s governments to establish large-scale conservation areas, placed in the most valuable hotspots for biodiversity worldwide, such as small islands with species found nowhere else. These reserves, in which wildlife will live and roam freely, will need to cover at least 40% of the world’s land surface to help bend the curve from decline to recovery for species and entire ecosystems.
The location of these areas, and how well they are managed, is often more important than how big they are. Habitat restoration and conservation efforts need to be targeted where they are needed most – for species and habitats on the verge of extinction.

The next 30 years will prove pivotal for Earth’s biodiversity. Leclère et al. (2020) © IIASA
Second, we must transform our food systems to produce more on less land. If every farmer on Earth used the best available farming practices, only half of the total area of cropland would be needed to feed the world. There are lots of other inefficiencies that could be ironed out too, by reducing the amount of waste produced during transport and food processing, for example. Society at large can help in this effort by shifting towards healthier and more sustainable diets, and reducing food waste.
This should happen alongside efforts to restore degraded land, such as farmland that’s becoming unproductive as a result of soil erosion, and land that’s no longer needed as agriculture becomes more efficient and diets shift. This could return 8% of the world’s land to nature by 2050. It will be necessary to plan how the remaining land is used, to balance food production and other uses with the conservation of wild spaces.
Without a similar level of ambition for reducing greenhouse gas emissions, climate change will ensure the world’s wildlife fares badly this century. Only a comprehensive set of policy measures that transform our relationship with the land and rapidly scale down pollution can build the necessary momentum. Our report concludes that transformative changes in our food systems and how we plan and use land will have the biggest benefits for biodiversity.
But the benefits wouldn’t end there. While giving back to nature, these measures would simultaneously slow climate change, reduce pressure on water, limit nitrogen pollution in the world’s waterways and boost human health. When the world works together to halt and eventually reverse biodiversity loss, it’s not only wildlife that will thrive.
This article originally appeared on The Conversation. Read the original article here.
Note: This article gives the views of the authors, and not the position of the Nexus blog, nor of the International Institute for Applied Systems Analysis.


You must be logged in to post a comment.