Jan 24, 2019 | Data and Methods, Systems Analysis, Women in Science
By Sibel Eker, IIASA postdoctoral research scholar
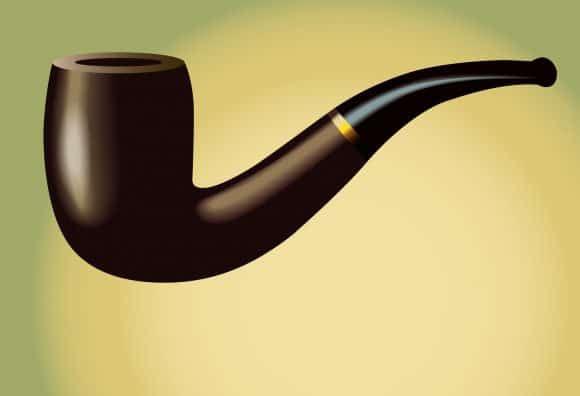
Ceci n’est pas une pipe – This is not a pipe © Jaka Vukotič | Dreamstime.com
Quantitative models are an important part of environmental and economic research and policymaking. For instance, IIASA models such as GLOBIOM and GAINS have long assisted the European Commission in impact assessment and policy analysis2; and the energy policies in the US have long been guided by a national energy systems model (NEMS)3.
Despite such successful modelling applications, model criticisms often make the headlines. Either in scientific literature or in popular media, some critiques highlight that models are used as if they are precise predictors and that they don’t deal with uncertainties adequately4,5,6, whereas others accuse models of not accurately replicating reality7. Still more criticize models for extrapolating historical data as if it is a good estimate of the future8, and for their limited scopes that omit relevant and important processes9,10.
Validation is the modeling step employed to deal with such criticism and to ensure that a model is credible. However, validation means different things in different modelling fields, to different practitioners and to different decision makers. Some consider validity as an accurate representation of reality, based either on the processes included in the model scope or on the match between the model output and empirical data. According to others, an accurate representation is impossible; therefore, a model’s validity depends on how useful it is to understand the complexity and to test different assumptions.
Given this variety of views, we conducted a text-mining analysis on a large body of academic literature to understand the prevalent views and approaches in the model validation practice. We then complemented this analysis with an online survey among modeling practitioners. The purpose of the survey was to investigate the practitioners’ perspectives, and how it depends on background factors.
According to our results, published recently in Eker et al. (2018)1, data and prediction are the most prevalent themes in the model validation literature in all main areas of sustainability science such as energy, hydrology and ecosystems. As Figure 1 below shows, the largest fraction of practitioners (41%) think that a match between the past data and model output is a strong indicator of a model’s predictive power (Question 3). Around one third of the respondents disagree that a model is valid if it replicates the past since multiple models can achieve this, while another one third agree (Question 4). A large majority (69%) disagrees with Question 5, that models cannot provide accurate projects, implying that they support using models for prediction purposes. Overall, there is no strong consensus among the practitioners about the role of historical data in model validation. Still, objections to relying on data-oriented validation have not been widely reflected in practice.
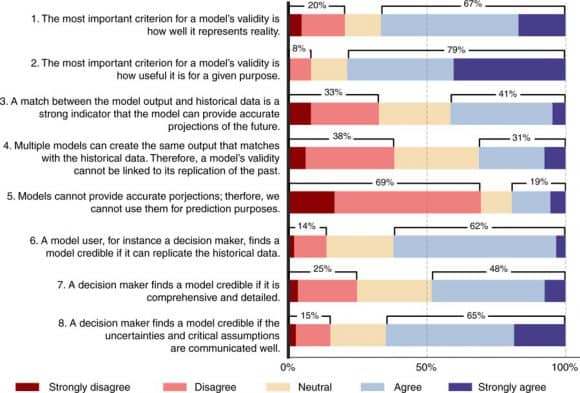
Figure 1: Survey responses to the key issues in model validation. Source: Eker et al. (2018)
According to most practitioners who participated in the survey, decision-makers find a model credible if it replicates the historical data (Question 6), and if the assumptions and uncertainties are communicated clearly (Question 8). Therefore, practitioners think that decision makers demand that models match historical data. They also acknowledge the calls for a clear communication of uncertainties and assumptions, which is increasingly considered as best-practice in modeling.
One intriguing finding is that the acknowledgement of uncertainties and assumptions depends on experience level. The practitioners with a very low experience level (0-2 years) or with very long experience (more than 10 years) tend to agree more with the importance of clarifying uncertainties and assumptions. Could it be because a longer engagement in modeling and a longer interaction with decision makers help to acknowledge the necessity of communicating uncertainties and assumptions? Would inexperienced modelers favor uncertainty communication due to their fresh training on the best-practice and their understanding of the methods to deal with uncertainty? Would the employment conditions of modelers play a role in this finding?
As a modeler by myself, I am surprised by the variety of views on validation and their differences from my prior view. With such findings and questions raised, I think this paper can provide model developers and users with reflections on and insights into their practice. It can also facilitate communication in the interface between modelling and decision-making, so that the two parties can elaborate on what makes their models valid and how it can contribute to decision-making.
Model validation is a heated topic that would inevitably stay discordant. Still, one consensus to reach is that a model is a representation of reality, not the reality itself, just like the disclaimer of René Magritte that his perfectly curved and brightly polished pipe is not a pipe.
References
- Eker S, Rovenskaya E, Obersteiner M, Langan S. Practice and perspectives in the validation of resource management models. Nature Communications 2018, 9(1): 5359. DOI: 10.1038/s41467-018-07811-9 [pure.iiasa.ac.at/id/eprint/15646/]
- EC. Modelling tools for EU analysis. 2019 [cited 16-01-2019]Available from: https://ec.europa.eu/clima/policies/strategies/analysis/models_en
- EIA. ANNUAL ENERGY OUTLOOK 2018: US Energy Information Administration; 2018. https://www.eia.gov/outlooks/aeo/info_nems_archive.php
- The Economist. In Plato’s cave. The Economist 2009 [cited]Available from: http://www.economist.com/node/12957753#print
- The Economist. Number-crunchers crunched: The uses and abuses of mathematical models. The Economist. 2010. http://www.economist.com/node/15474075
- Stirling A. Keep it complex. Nature 2010, 468(7327): 1029-1031. https://doi.org/10.1038/4681029a
- Nuccitelli D. Climate scientists just debunked deniers’ favorite argument. The Guardian. 2017. https://www.theguardian.com/environment/climate-consensus-97-per-cent/2017/jun/28/climate-scientists-just-debunked-deniers-favorite-argument
- Anscombe N. Models guiding climate policy are ‘dangerously optimistic’. The Guardian 2011 [cited]Available from: https://www.theguardian.com/environment/2011/feb/24/models-climate-policy-optimistic
- Jogalekar A. Climate change models fail to accurately simulate droughts. Scientific American 2013 [cited]Available from: https://blogs.scientificamerican.com/the-curious-wavefunction/climate-change-models-fail-to-accurately-simulate-droughts/
- Kruger T, Geden O, Rayner S. Abandon hype in climate models. The Guardian. 2016. https://www.theguardian.com/science/political-science/2016/apr/26/abandon-hype-in-climate-models
Jan 15, 2018 | Data and Methods, Demography
By Dilek Yildiz, Wittgenstein Center for Demography and Global Human Capital (IIASA, VID/ÖAW and WU), Vienna Institute of Demography, Austrian Academy of Sciences, International Institute for Applied Systems Analysis
Social media offers a promising source of data for social science research that could provide insights into attitudes, behavior, social linkages and interactions between individuals. As of the third quarter of 2017, Twitter alone had on average 330 million active users per month. The magnitude and the richness of this data attract social scientists working in many different fields with topics studied ranging from extracting quantitative measures such as migration and unemployment, to more qualitative work such as looking at the footprint of second demographic transition (i.e., the shift from high to low fertility) and gender revolution. Although, the use of social media data for scientific research has increased rapidly in recent years, several questions remain unanswered. In a recent publication with Jo Munson, Agnese Vitali and Ramine Tinati from the University of Southampton, and Jennifer Holland from Erasmus University, Rotterdam, we investigated to what extent findings obtained with social media data are generalizable to broader populations, and what constitutes best practice for estimating demographic information from Twitter data.
A key issue when using this data source is that a sample selected from a social media platform differs from a sample used in standard statistical analysis. Usually, a sample is randomly selected according to a survey design so that information gathered from this sample can be used to make inferences about a general population (e.g., people living in Austria). However, despite the huge number of users, the information gathered from Twitter and the estimates produced are subject to bias due to its non-random, non-representative nature. Consistent with previous research conducted in the United States, we found that Twitter users are more likely than the general population to be young and male, and that Twitter penetration is highest in urban areas. In addition, the demographic characteristics of users, such as age and gender, are not always readily available. Consequently, despite its potential, deriving the demographic characteristics of social media users and dealing with the non-random, non-representative populations from which they are drawn represent challenges for social scientists.
Although previous research has explored methods for conducting demographic research using non-representative internet data, few studies mention or account for the bias and measurement error inherent in social media data. To fill this gap, we investigated best practice for estimating demographic information from Twitter users, and then attempted to reduce selection bias by calibrating the non-representative sample of Twitter users with a more reliable source.
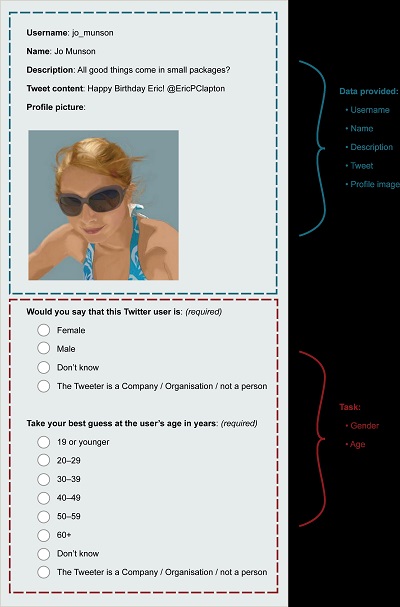
Exemplar of CrowdFlower task © Jo Munson.
We gathered information from 979,992 geo-located Tweets sent by 22,356 unique users in South-East England and estimated their demographic characteristics using the crowd-sourcing platform CrowdFlower and the image-recognition software Face++. Our results show that CrowdFlower estimates age more accurately than Face++, while both tools are highly reliable for estimating the sex of Twitter users.
To evaluate and reduce the selection bias, we ran a series of models and calibrated the non-representative sample of Twitter users with mid-year population estimates for South-East England from the UK Office of National Statistics. We then corrected the bias in age-, sex-, and location-specific population counts. This bias correction exercise shows promise for unbiased inference when using social media data and can be used to further reduce selection bias by including other sociodemographic variables of social media users such as ethnicity. By extending the modeling framework slightly to include an additional variable, which is only available through social media data, it is also possible to make unbiased inferences for broader populations by, for example, extracting the variable of interest from Tweets via text mining. Lastly, our methodology lends itself for use in the calculation of sample weights for Twitter users or Tweets. This means that a Twitter sample can be treated as an individual-level dataset for micro-level analysis (e.g., for measuring associations between variables obtained from Twitter data).
Reference:
Yildiz, D., Munson, J., Vitali, A., Tinati, R. and Holland, J.A. (2017). Using Twitter data for demographic research, Demographic Research, 37 (46): 1477-1514. doi: 10.4054/DemRes.2017.37.46
Note: This article gives the views of the author, and not the position of the Nexus blog, nor of the International Institute for Applied Systems Analysis.
Jun 21, 2017 | Data and Methods
By Luke Kirwan, IIASA open access manager
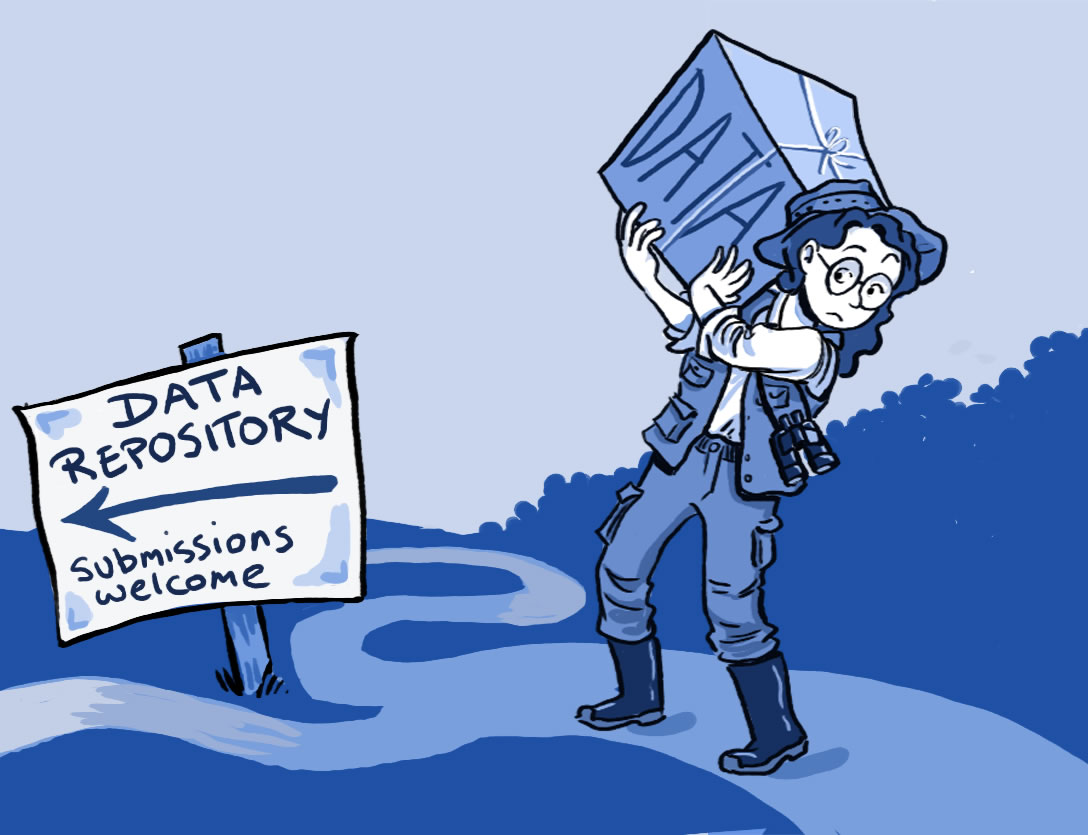
At this year’s European Geosciences Union a panel of experts convened to debate the benefits of open science. Open science means making as much of the scientific output and processes publicly visible and accessible, including publications, models, and data sets.

Open science includes not just open access to research findings, but the idea of sharing data, methods, and processes. ©PongMoji | Shutterstock
In terms of the benefits of open science the panelists—who included representatives from academia, government, and academic publishing—generally agreed that openness favors increased collaboration and the development of large networks, especially in terms of geoscience data, which improves precision in the interpretation of results. There is evidence that sharing data and linking to publications increases both readership and citations. A growing number of funding bodies and journals are also requiring researchers to make the data underlining a publication as publicly available as possible. In the context of Horizon 2020, researchers are instructed to make their data ‘as open as possible, as closed as necessary.’
This statement was intentionally left vague, because the European Research Council (ERC) realized that a one size fits all approach would not be able to cover the entirety of research practices across the scientific community, said Jean-Paul Bourguignon, president of the ERC.
Barbara Romanowicz from Collège de France and Institut de Physique du Glove de Paris also pointed to the need for disciplines to develop standardized metadata standards and a community ethic to facilitate interoperability. She also pointed out that the requirements for making raw data openly accessible are quite different to those for making models accessible. These problems require increased resources to be adequately addressed.
Roche DG, Lanfear R, Binning SA, Haff TM, Schwanz LE, Cain KE, Kokko H, Jennions MD, Kruuk LEB (2014). Troubleshooting public data archiving: suggestions to increase participation. PLOS Biology. 12 (1): e1001779. doi:10.1371/journal.pbio.1001779.
Playing devil’s advocate, Helen Glaves from the British Geological Survey pointed to several areas of potential concern. She questioned whether the costs involved in providing long-term preservation and access to data are the most efficient use of taxpayers money. She also suggested that charging for access could be used to generate revenues to fund future research. However, possibly a more salient concern for researchers that she raised was the fear of scientists that making their data and research available in good faith, could allow their hard work to be passed off by another researcher as their own.
Many of these issues were raised by audience members during the questions and answer session. Scientists pointed out that research data involved a lot of hard work to collate, they had concerns about inappropriate secondary reuse, jobs and research grants are highly competitive. However, the view was also expressed that paying for access to research fundamentally amounts to ‘double taxation’ if the research has been funded by public money, and that even restrictive sharing is better than not sharing at all. It was also argued that incentivising sharing through increased citations and visibility would both help encourage researchers to make their research more open and aide researchers in the pursuit of grants or research positions. To bring about these changes in research practices will involve investing in training the next generation of scientists in these new processes.
Here at IIASA we are fully committed to open access and in the library, we assist our researchers with any queries or issues they may have with widely sharing their research. As well as improving the visibility of research publications through Pure, our institutional repository, we can also assist with making research data discoverable and citable.
A video of the discussion is available on YouTube.
This article gives the views of the author, and not the position of the Nexus blog, nor of the International Institute for Applied Systems Analysis.
Jun 12, 2017 | Citizen Science
By Linda See, IIASA Ecosystems Services and Management Program
Satellites have changed the way that we see the world. For more than 40 years, we have had regular images of the Earth’s surface, which have allowed us to monitor deforestation, visualize dramatic changes in urbanization, and comprehensively map the Earth’s surface. Without satellites, our understanding of the impacts that humans are having on the terrestrial ecosystem would be much diminished.
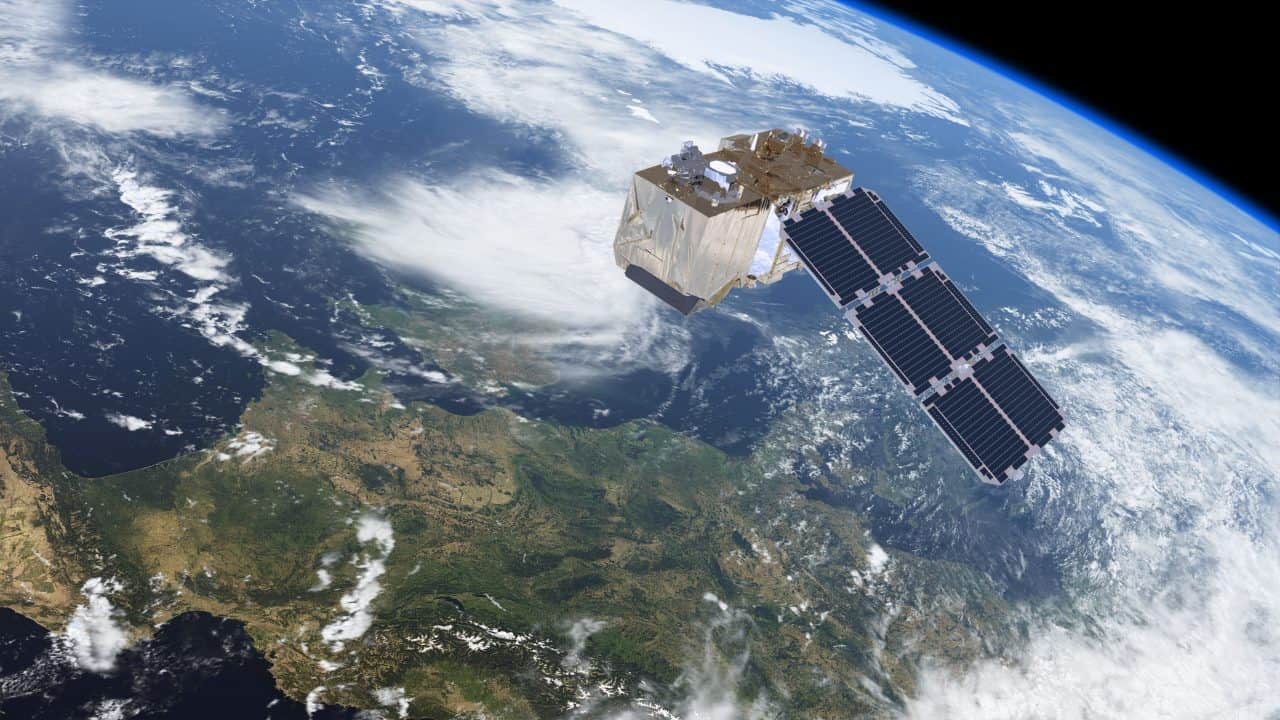
The Sentinel-2 satellite provides high-resolution land-cover data. © ESA/ATG medialab
Over the past decade, many more satellites have been launched, with improvements in how much detail we can see and the frequency at which locations are revisited. This means that we can monitor changes in the landscape more effectively, particularly in areas where optical imagery is used and cloud cover is frequent. Yet perhaps even more important than these technological innovations, one of the most pivotal changes in satellite remote sensing was when NASA opened up free access to Landsat imagery in 2008. As a result, there has been a rapid uptake in the use of the data, and researchers and organizations have produced many new global products based on these data, such as Matt Hansen’s forest cover maps, JRC’s water and global human settlement layers, and global land cover maps (FROM-GLC and GlobeLand30) produced by different groups in China.
Complementing Landsat, the European Space Agency’s (ESA) Sentinel-2 satellites provide even higher spatial and temporal resolution, and once fully operational, coverage of the Earth will be provided every five days. Like NASA, ESA has also made the data freely available. However, the volume of data is much higher, on the order of 1.6 terabytes per day. These data volumes, as well as the need to pre-process the imagery, can pose real problems to new users. Pre-processing can also lead to incredible duplication of effort if done independently by many different organizations around the world. For example, I attended a recent World Cover conference hosted by ESA, and there were many impressive presentations of new applications and products that use these openly available data streams. But most had one thing in common: they all downloaded and processed the imagery before it was used. For large map producers, control over the pre-processing of the imagery might be desirable, but this is a daunting task for novice users wanting to really exploit the data.
In order to remove these barriers, we need new ways of providing access to the data that don’t involve downloading and pre-processing every new data point. In some respects this could be similar to the way in which Google and Bing provide access to very high-resolution satellite imagery in a seamless way. But it’s not just about visualization, or Google and Bing would be sufficient for most user needs. Instead it’s about being able to use the underlying spectral information to create derived products on the fly. The Google Earth Engine might provide some of these capabilities, but the learning curve is pretty steep and some programming knowledge is required.
Instead, what we need is an even simpler system like that produced by Sinergise in Slovenia. In collaboration with Amazon Web Services, the Sentinel Hub provides access to all Sentinel-2 data in one place, with many different ways to view the imagery, including derived products such as vegetation status or on-the-fly creation of user-defined indices. Such a system opens up new possibilities for environmental monitoring without the need to have either remote sensing expertise, programming ability, or in-house processing power. An exemplary web application using Sentinel Hub services, the Sentinel Playground, allows users to browse the full global multi-spectral Sentinel-2 archive in matter of seconds.
This is why we have chosen Sentinel Hub to provide data for our LandSense Citizen Observatory, an initiative to harness remote sensing data for land cover monitoring by citizens. We will access a range of services from vegetation monitoring through to land cover change detection and place the power of remote sensing within the grasp of the crowd.
Without these types of innovations, exploitation of the huge volumes of satellite data from Sentinel-2, and other newly emerging sources of satellite data, will remain within the domain of a small group of experts, creating a barrier that restricts many potential applications of the data. Instead we must encourage developments like Sentinel Hub to ensure that satellite remote sensing becomes truly usable by the masses in ways that benefits everyone.
This article gives the views of the author, and not the position of the Nexus blog, nor of the International Institute for Applied Systems Analysis.
Feb 21, 2017 | Citizen Science
By Linda See, IIASA Ecosystems Services and Management Program
One of the biggest questions when it comes to citizen science is the quality of the data. Scientists worry that citizens are not as rigorous in their data collection as professionals might be, which calls into question the reliability of the data. At a meeting this month in Brussels on using citizen science to track invasive species, we grappled with the question: what it will take to trust this data source, particularly if it’s going to be used to alert authorities regarding the presence of an invasive species in a timely manner.
This discussion got me thinking about what other types of data are supplied by citizens that authorities simply trust, for example, when a citizen calls the emergency services to report an incident, such as a fire. Such reports are investigated by the authorities and the veracity of the alert is not questioned. Instead authorities are obliged to investigate such reports.
Yet the statistics show that false alarms do occur. For example, in 2015, there were more than 2.5 million false fire alarms in the United States, of which just under a third were due to system malfunctions. The remaining calls were unintentional, malicious, or other types of false alarms, such as a bomb scare. Statistics for calls to the emergency services more generally show similar trends in different European countries, where the percentage of false reports range from 40% in Latvia up to 75% in Lithuania and Norway. So why is it that we inherently trust this data source, despite the false alarm rate, and not data from citizen scientists? Is it because life is threatened or because fires are easier to spot than invasive species, or simply because emergency services are mandated with the requirement to investigate?
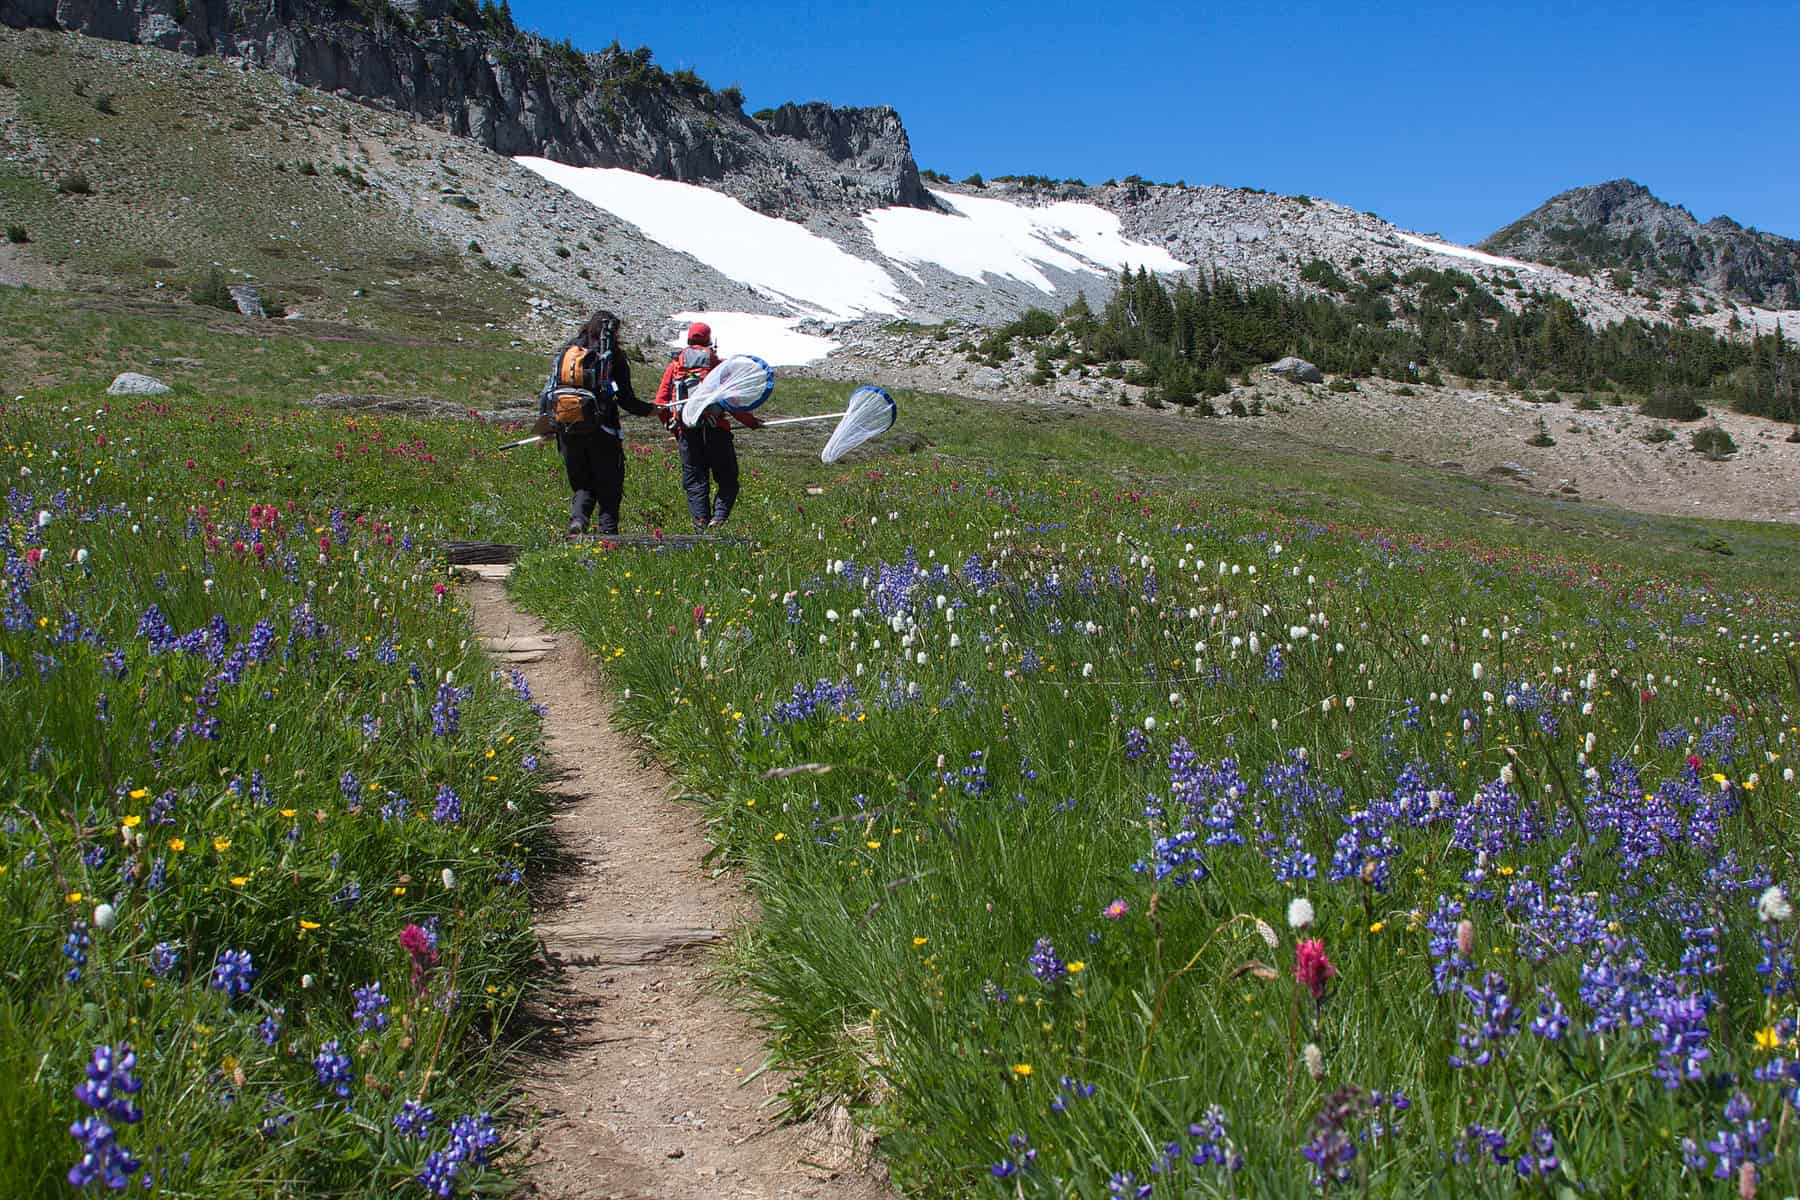
Volunteers monitor butterflies in Mount Rainier National Park, as part of the Cascade Butterfly Project, a citizen science effort organized by the US National Park Service © Kevin Bacher | US National Park Service
A recent encouraging development for citizen science was the signing of an executive order by President Obama on 6 January 2017, which gave federal agencies the jurisdiction to use citizen science and crowdsourced data in their operations. Do we need something similar in the EU or at the level of member states? And what will it really take for authorities to trust scientific data from citizens?
To move from the current situation of general distrust in citizen science data to one in which the data are viewed as a potentially useful source of information, we need further action. First we need to showcase examples of where data collected by citizens are already being used for monitoring. At the meeting in Brussels, Kyle Copas of the Global Biodiversity Information Facility (GBIF) noted that up to 40% of the data records in GBIF are supplied by citizens, which surprised many of the meeting participants. Data from GBIF are used for national and international monitoring of biodiversity. Secondly, we need to quantify the value of information coming from citizen scientists. For example, how much money could have been saved if reports on invasive species from citizens were acted upon? Third, we need to forge partnerships with government agencies to institutionally embed citizen science data streams into everyday operations. For example, the LandSense citizen observatory, a new project, aims to do exactly this. We are working with the National Mapping Agency in France to use citizen science data to update their maps but there are many other similar examples with other local and national agencies that will be tested over the next 3.5 years.
Finally, we need to develop quality assurance systems that can be easily plugged into the infrastructure of existing organizations. The EU-funded COBWEB project began building such a citizen science-based quality assurance system, which we are continuing to develop in LandSense as a service. Providing out-of-the-box tools may be one solution to help organizations to begin working with citizen science data more seriously at an institutional level.
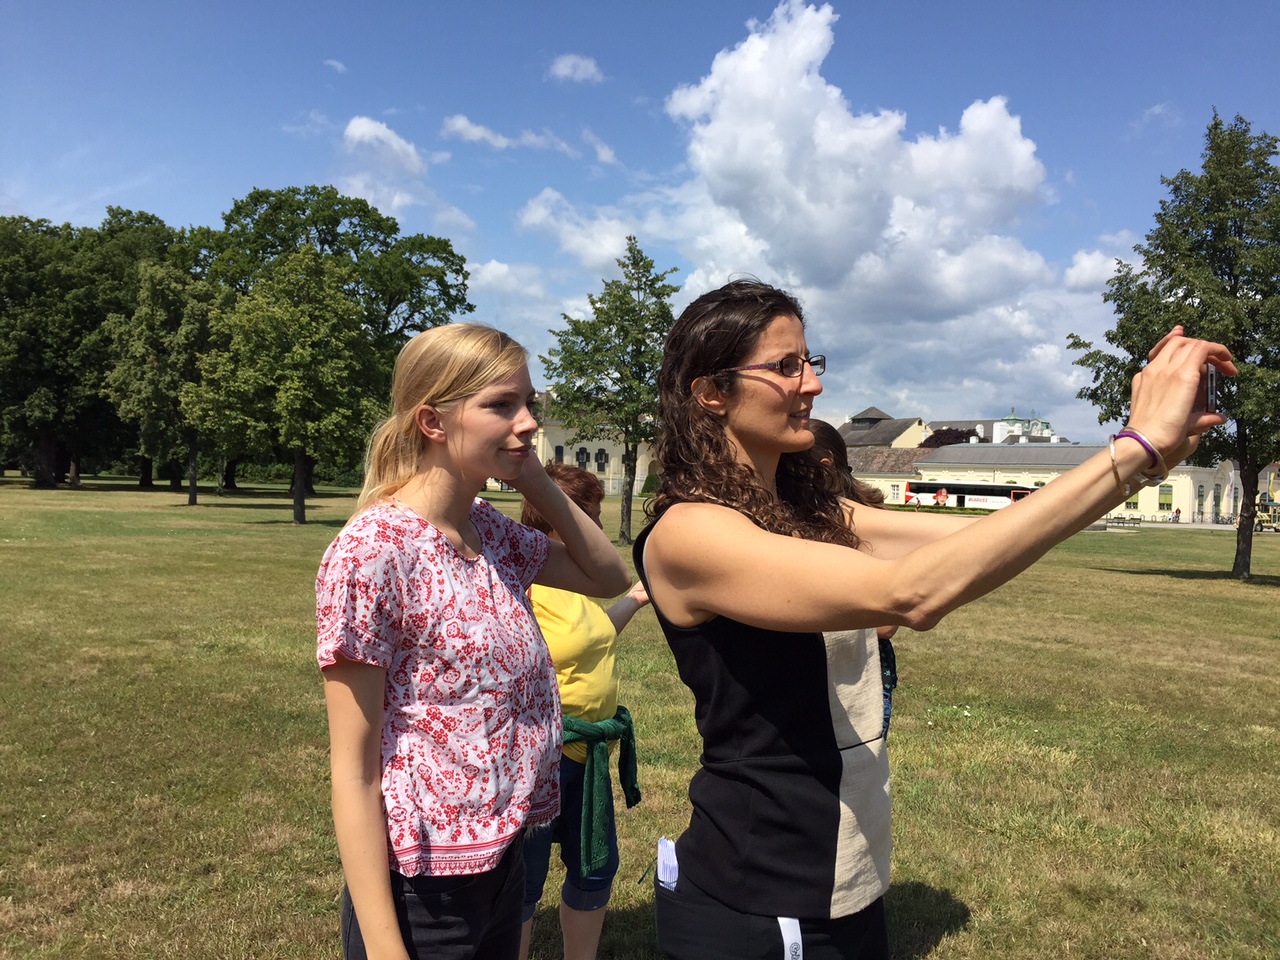
IIASA researchers test the Fotoquest app, a citizen science game developed at IIASA. ©Katherine Leitzell | IIASA
These measures will clearly take time to implement so I don’t expect that the discussion on the quality of the data will be removed from any agenda for some time to come. However, I look forward to the day when the main issue revolves around how we can possibly handle the masses of big data coming from citizens, a situation that many of us would like to be in.
More Information about the meeting: https://ec.europa.eu/jrc/en/event/workshop/citizen-science-open-data-model-invasive-alien-species-europe
This article gives the views of the author, and not the position of the Nexus blog, nor of the International Institute for Applied Systems Analysis.


You must be logged in to post a comment.