Jan 12, 2017 | Citizen Science, Risk and resilience
By Ian McCallum, IIASA Ecosystems Services and Management Program
Communities need information to prepare for and respond to floods – to inform risk reduction strategies and strengthen resilience, improve land use planning, and generally prepare for when disaster strikes. But across much of the developing world, data are sparse at best for understanding the dynamics of flood risk. When and if disaster strikes, massive efforts are required in the response phase to develop or update information about basic infrastructure, for example, roads, bridges and buildings. In terms of strengthening community resilience it is important to know about the existence and location of such features as community shelters, medical clinics, drinking water, and more.
The risk Geo-Wiki platform
The Risk Geo-Wiki is online platform established in 2014, which acts not only as a repository of available flood related spatial information, but also provides for two-way information exchange. You can use the platform to view available information about flood risk at any location on the globe, along with geo-tagged photos uploaded by yourself or other users via a mobile application Geo-Wiki Pictures. The portal is intended to be of practical use to community leaders and NGOs, governments, academia, industry and citizens who are interested in better understanding the information available to strengthen flood resilience.
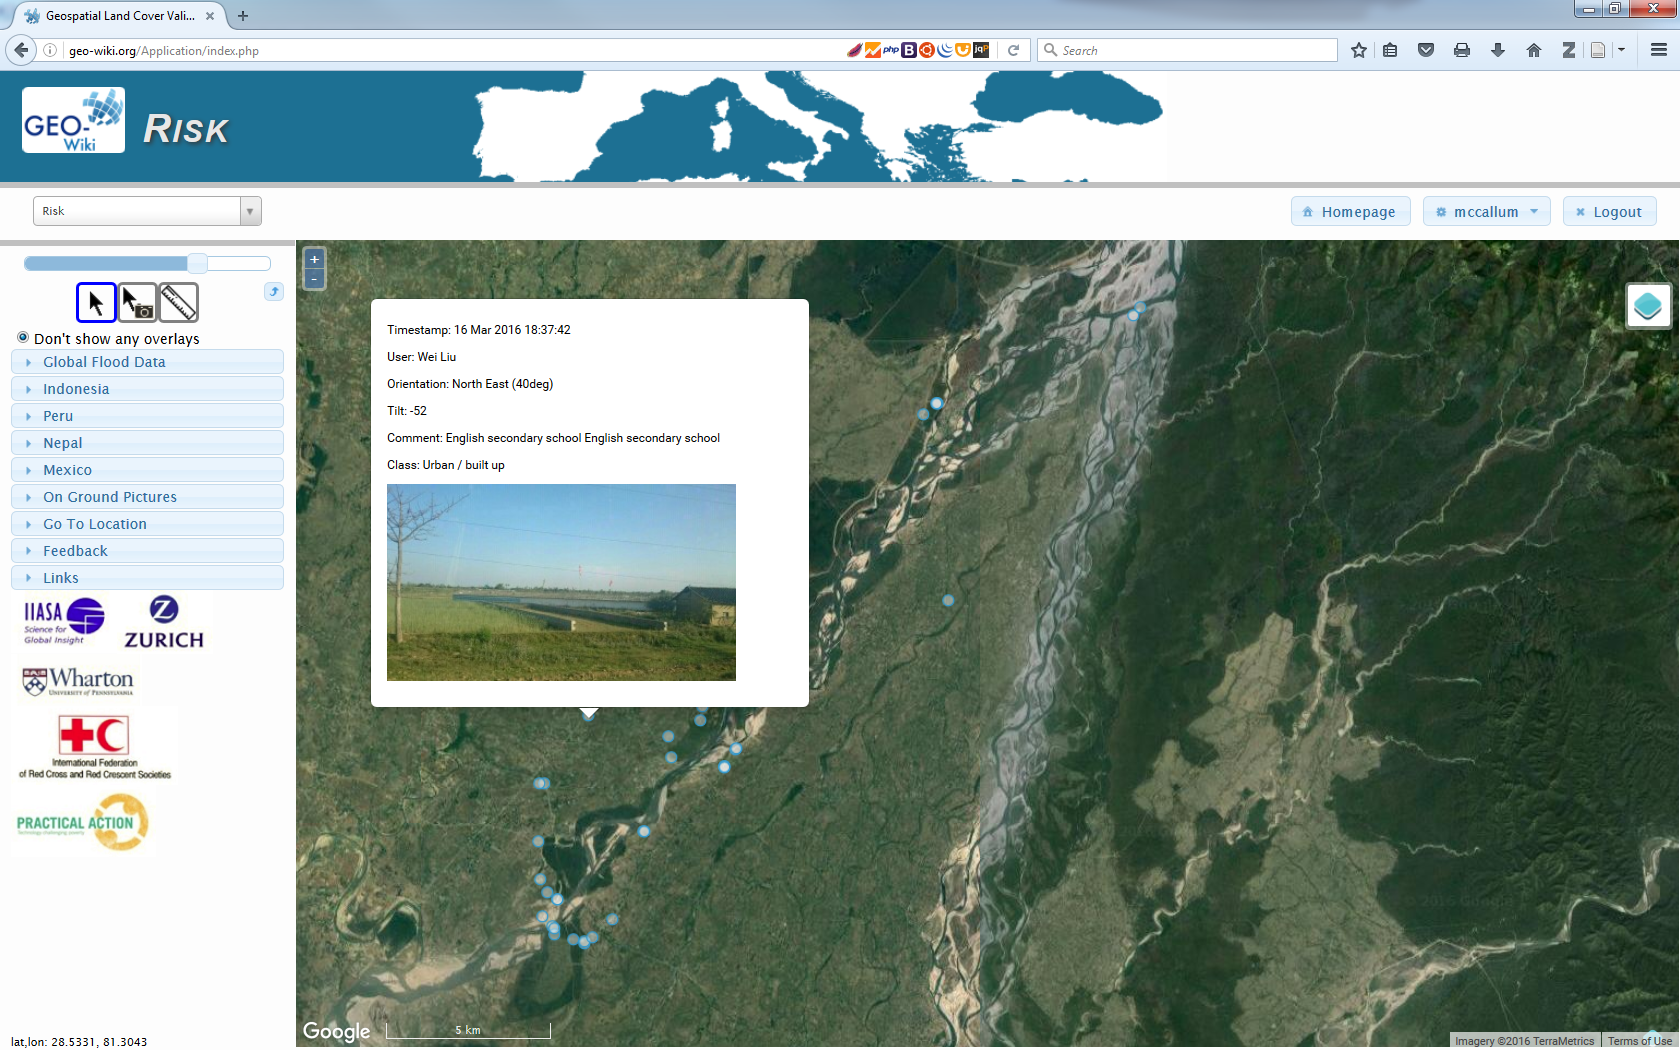
The Risk Geo-Wiki showing geo-tagged photographs overlaid upon satellite imagery across the Karnali basin, Nepal. © IIASA
With only a web browser, and a simple registration, anyone can access flood-related spatial information worldwide. Available data range from flood hazard, exposure and risk information, to biophysical and socioeconomic data. All of this information can be overlaid upon satellite imagery or OpenStreetMap, along with on-ground pictures taken with the related mobile application Geo-Wiki Pictures. You can use these data to understand the quality of available global products or to visualize the numerous local datasets provided for specific flood affected communities. People interested in flood resilience will benefit from visiting the platform and are welcome to provide additional information to fill many of the existing gaps in information.
Flood resilience and data gaps
One of the aims of the Risk Geo-Wiki is to identify and address data gaps on flood resilience and community-based disaster risk reduction. For example, there is a big disconnect between information suitable for global flood risk modelling and that necessary for community planning. Global modelers need local information with which to validate their forecasts while community planners want both detailed local information and an understanding of their communities in the wider region. The Flood Resilience Alliance is working with many interested groups to help fill this gap and at the same time help strengthen community resilience against floods and to develop and disseminate knowledge and expertise on flood resilience.
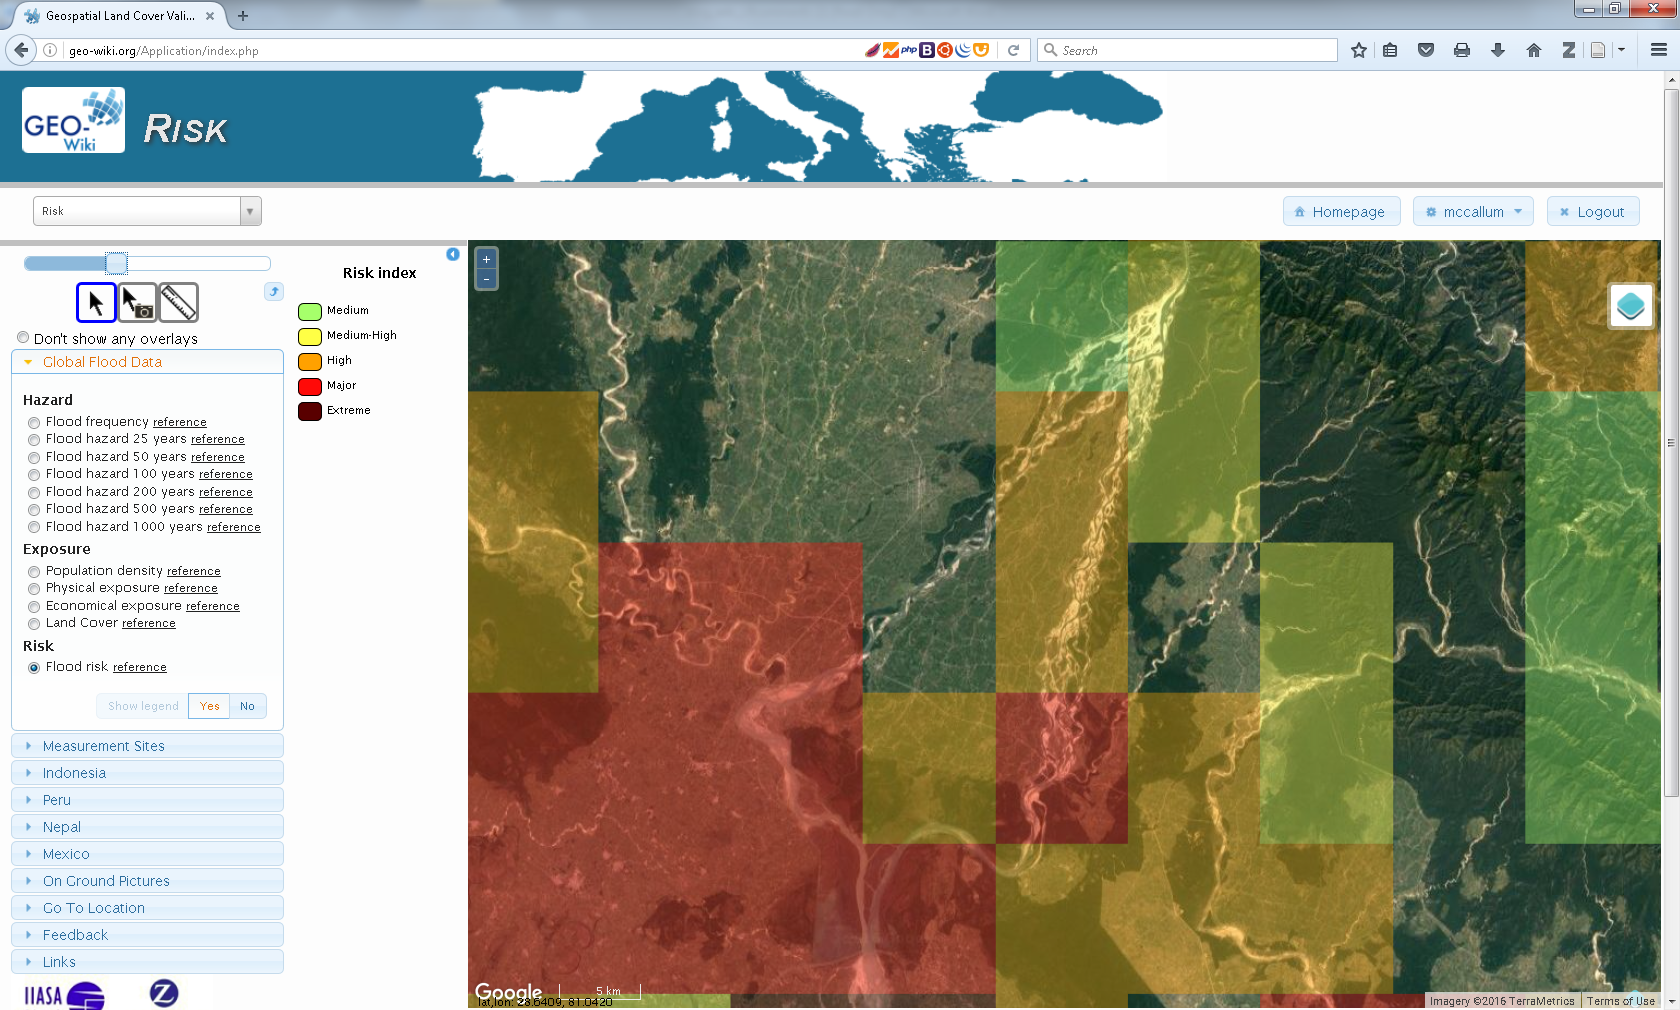
The Risk Geo-Wiki showing modelled global flood risk data overlaid at community level. While this data is suitable at the national and regional level, it is too coarse for informing community level decisions. © IIASA
Practical applications for local communities
Already, communities in Nepal, Peru, and Mexico have uploaded data to the site and are working with us on developing it further. For local communities who have uploaded spatial information to the site, it allows them to visualize their information overlaid upon satellite imagery or OpenStreetMap. Furthermore, if they have used Geo-Wiki Pictures to document efforts in their communities, these geo-tagged photos will also be available.
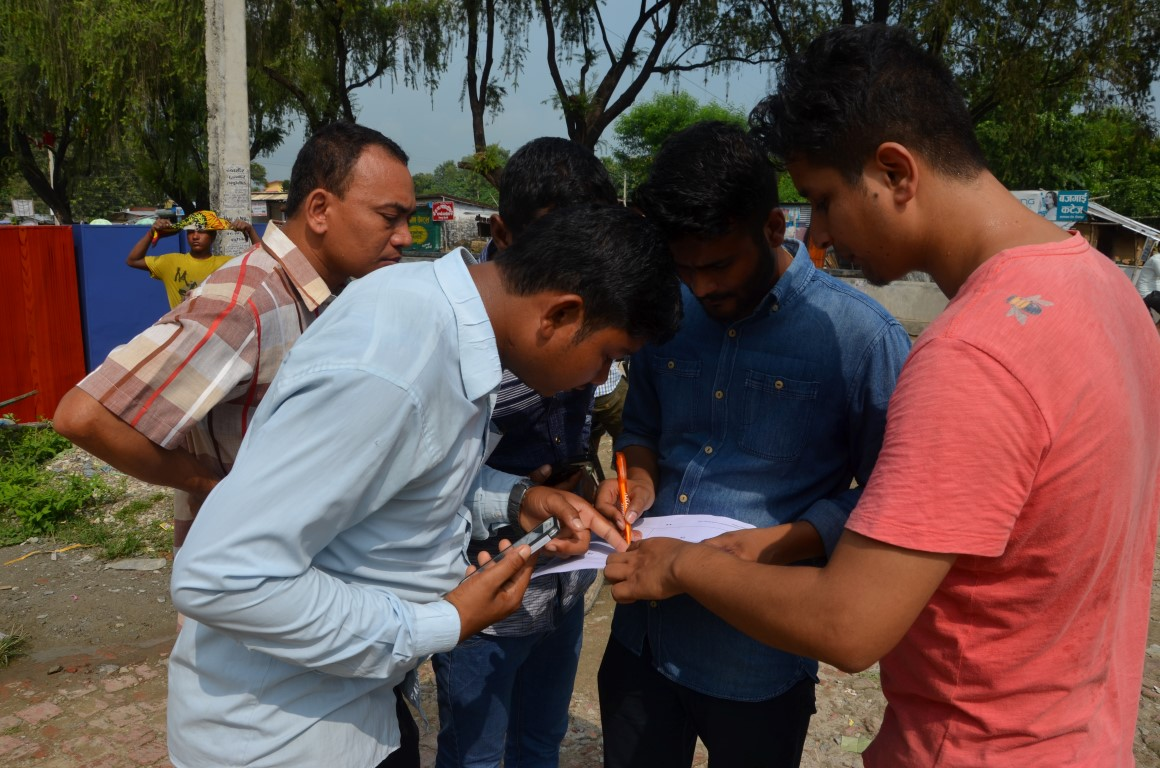
Community and NGO members mapping into OSM with mobile devices in the Karnali basin, Nepal. © Wei Liu, IIASA
In addition to local communities who have uploaded information, the Risk Geo-Wiki will provide important data to others interested in flood risk, including researchers, the insurance industry, NGOs, and donors. The portal provides a source of information that is both easily visualized and overlaid on satellite imagery with local images taken on the ground if available. Such a platform allows anyone interested to better understand flood events over their regions and communities of interest. It is, however, highly dependent upon the information that is made available to the platform, so we invite you to contribute. In particular if you have geographic information related to flood exposure, hazard, risk and vulnerability in the form of images or spatial data we would appreciate you getting in contact with us.
About the portal:
The Risk Geo-Wiki portal was established by the International Institute for Applied Systems Analysis (IIASA) in the context of the Flood Resilience Alliance. It was developed by the Earth Observation Systems Group within the Ecosystems Services and Management Program at IIASA.
Further information
- Risk Geo-Wiki
- Collection of geo-tagged photos with Geo-Wiki Pictures
- Mapping flood resilience in rural Nepal
- Flood Resilience Portal
- McCallum, I., Liu, W., See, L., Mechler, R., Keating, A., Hochrainer-Stigler, S., Mochizuki, J., Fritz, S., Dugar, S., Arestegui, M., Szoenyi, M., Laso Bayas, J.C., Burek, P., French, A. and Moorthy, I. (2016) Technologies to Support Community Flood Disaster Risk Reduction. International Journal of Disaster Risk Science, 7 (2). pp. 198-204.http://pure.iiasa.ac.at/13299/
This article gives the views of the author, and not the position of the Nexus blog, nor of the International Institute for Applied Systems Analysis.
Oct 1, 2015 | Citizen Science
By Linda See, IIASA Ecosystems Services and Management Program
We had another very hot summer this year in Europe and many other parts of the world. Many European cities, including London, Madrid, Frankfurt, Paris and Geneva, broke new temperature records.
Cities are particularly vulnerable to increasing temperatures because of a phenomenon known as the urban heat island effect. First measured more than a half a century ago by Tim Oke, the increased temperatures measured in urban areas are a result of urban land use, or higher amounts of impervious surfaces such as concrete and concentrated urban structures. The urban heat island effect impacts human health and well-being. It’s not just a matter of comfort: during the heat wave in 2003, more than 70,000 people in Europe are estimated to have perished, mostly urban dwellers.

Summer 2015 in Ljubljana, Slovenia. ©K. Leitzell | IIASA
While climate models have many uncertainties, they do all agree that the urban heat island effect will increase in frequency and duration in the future. A recent article by Hannah Hoag in Nature paints a bleak picture of just how unprepared cities are for dealing with increasing temperatures. The paper cites positive and negative examples of mitigation from various cities but it falls short of suggesting a more widely applicable solution.
What we need is a standardized way of approaching the problem. Underlying this lack of standards is the paucity of data on the form and function of cities. By form I mean the geometry of the city–a 3D model of the buildings and road network, and information on the building materials—as well as a map of the basic land cover including impervious surfaces like roads and sidewalks, and areas of vegetation such as gardens, parks, and fields. Function refers to the building use, road types, use of irrigation and air conditioning and other factors that affect local atmospheric conditions. As climate models become more highly resolved, they will need vast amounts of such information to feed into them.
These issues are what led me and my colleagues (Prof Gerald Mills of UCD, Dr Jason Ching of UNC and many others) to conceive the World Urban Database and Access Portal Tools (WUDAPT) initiative (www.wudapt.org). WUDAPT is a community-driven data collection effort that draws upon the considerable network of urban climate modelers around the world. We start by dividing a city into atmospherically distinct areas, or Local Climate Zones (LCZs) developed by Stewart and Oke, which provides a standard methodology for characterizing cities that can improve the parameters needed for data-hungry urban climate models.
Using freely available satellite imagery of the Earth’s surface, the success of the approach relies on local urban experts to provide representative examples of different LCZs across their city. We are currently working towards creating an LCZ classification for all C40 cities (a network of cities committed to addressing climate change) but are encouraging volunteers to work on any cities that are of interest to them. We refer to this as Level 0 data collection because it provides a basic classification for each city. Further detailed data collection efforts (referred to as Levels 1 and 2) will use a citizen science approach to gather information on building materials and function, landscape morphology and vegetation types.

The Local Climate Zone (LCZ) map for Kiev.
WUDAPT will equip climate modelers and urban planners with the data needed to examine a range of mitigation and adaptation scenarios: For example what effect will green roofs, changes in land use or changes in the urban energy infrastructure have on the urban heat island and future climate?
The ultimate goal of WUDAPT is to develop a very detailed open access urban database for all major cities in the world, which will be valuable for many other applications from energy modelling to greenhouse gas assessment. If we want to improve the science of urban climatology and help cities develop their own urban heat adaptation plans, then WUDAPT represents one concrete step towards reaching this goal. Contact us if you want to get involved.
About the WUDAPT Project
The WUDAPT concept has been developed during two workshops, one held in Dublin Ireland in July 2014 and the second in conjunction with the International Conference on Urban Climate in Toulouse; a third workshop is set to take place in Hong Kong in December 2015. More information can be found on the WUDAPT website at: http://www.wudapt.org.
References
Bechtel, B., Alexander, P., Böhner, J., Ching, J., Conrad, O., Feddema, J., Mills, G., See, L. and Stewart, I. 2015. Mapping local climate zones for a worldwide database of form and function of cities. International Journal of Geographic Information, 4(1), 199-219.
Hoag, H. 2015. How cities can beat the heat. Nature, 524, 402-404.
See, L., Mills, G. and Ching. J. 2015. Community initiative counters urban heat. Nature, 526,43 (01 October 2015) doi:10.1038/526043b
Stewart, I.D. and Oke, T.R. 2012. Local Climate Zones for urban temperature studies. Bulletin of the American Meteorological Society, 93(12), 1879-1900.
Wake, B. 2012. Defining local zones. Nature Climate Change, 2, 487.
Note: This article gives the views of the author, and not the position of the Nexus blog, nor of the International Institute for Applied Systems Analysis.
Sep 24, 2015 | Air Pollution

© kichigin19 | dreamstime.com
By Jens Borken-Kleefeld, IIASA Mitigation of Air Pollution and Greenhouse Gases Program
Earlier this week, Volkswagen admitted fraudulent software causing high exhaust emissions of nitrogen oxides (NOx) from several of its diesel car models during normal driving. That diesel cars emit many times more NOx in normal driving than their legal limit has been known for more than a decade in Europe. The surprise to me is that the enforcement of these legal limits is pursued now from the USA and not from a European authority, and that – in the face of a public outcry – the automaker admitted the same software was not only in US models.
Following this announcement, I took a second look into the on-road emission data from Europe and compared it with data collected by colleagues in the USA. We find that VW diesel cars in Europe emit as much NOx as the incriminated models in the USA, as shown in the chart for VW Golf, Jetta and Passat models model years 2009 to 2013.

On-road data US: Peter McClintock, remote sensing campaign by Envirotest Inc. for Colorado (2013). On-road data Europe: Jens Borken-Kleefeld, analyzing remote sensing campaigns by AWEL Zurich (2009-2013). Each filtered for normal driving conditions.
We measured significant differences between manufacturers, yet on the whole the gap between officially certified and real-driving NOx emissions from diesel cars in Europe has been growing. The few models with low emissions are by far outnumbered by cars with high NOx emissions. Yet, VW’s emission levels are not even the worst in class.
References:
US EPA Notice of Violation, 18 Sept 2015. http://www3.epa.gov/otaq/cert/documents/vw-nov-caa-09-18-15.pdf
Announcement by VW: http://www.volkswagenag.com/content/vwcorp/info_center/en/news/2015/09/Volkswagen_AG_has_issued_the_following_information.html
Chen and J. Borken-Kleefeld, “Real-Driving Emissions from Cars and Light Commercial Vehicles – Results from 13 Years Remote Sensing at Zurich/CH,” Atmospheric Environment 88 (May 2014): 157–64. http://dx.doi.org/10.1016%2Fj.atmosenv.2014.01.040
Note: This article gives the views of the author, and not the position of the Nexus blog, nor of the International Institute for Applied Systems Analysis.
Nov 5, 2014 | Demography
By Samir K.C., IIASA World Population Program
How old are you? This is the most basic demographic question about an individual, and an easy one to answer. What is the population of the world or your country? Well, many who read the news roughly know the number, about seven billion for the world and more than a billion in China and India. But when asked more detailed questions about demography, “What percentage of people are younger than you in the world or your country?” or “What’s the remaining life expectancy for you in your country and the world?” the eyes start rolling. Such questions are important because they lead to better knowledge and awareness about the population, especially the question of life expectancy.

(Photo: UN Photo/Sebastiao Barbosa)
This is why I, with my colleagues Wolfgang Fengler (World Bank), Benedikt Gross (data visualization designer), and many others, have developed a website where people can find out their respective place in the world population or the country population: population.io. The website was launched last Saturday at the TEDxVienna.
How long will we live? Most of us in the general public do not know the answer. But demographers and actuaries can actually project the expected date of death for populations, based on factors such as place of residence, age, and sex. Demographers use data on deaths occurring during a period and the population structure to estimate death rates. These death rates are then included in the life table calculations that show, among other details, expected number of years of remaining life given one’s place of residence, age, and sex.
On population.io, you can find your own expected death date, based on population projections and details such as where you were born, where you live, and your sex. Of course, this date is just an average with a distribution. If the remaining life expectancy for a 40-year-old is 30 more years, that does not mean that all today’s 40-year-olds will die in 2044: roughly half will die earlier and half later. But we hope that exploring this tool will give people some insight into the world and their country’s population and their place within it.
How do we know how long you will live?
To answer this question, we use population projections. To make good population projections, demographers need information about the demographic structure, including current age and sex structure and assumptions about the future scenarios of mortality, fertility, and migration. A “cohort component” method is then applied to calculate the future population size and structure and to obtain number of births, deaths, and migration. This method projects each cohort born in the same one- or five-year period forward in time, to replace the older cohort occupying the age. In the process some die or migrate out (population decreases) and some migrate in (population increases), while women in reproductive age groups might give birth to children, who will then enter the population as a new cohort. All of these numbers and assumptions are needed for many purposes within and outside the discipline of population studies including for a proper answer to our question, “How long will I live?”
Here’s how the calculations behind population.io work. As an example, I’ll take myself: For a male of my age, 40 years old, on average according to the current global mortality rates, my remaining life expectancy would be about 37 years. This is bit scary for me – that means as an average “global citizen, I would die at age 77. In Nepal, where I am from, my life expectancy would be a little more than one year less. However, since I will most likely live in Austria, my remaining life expectancy increases to 43 years, an increase of 7.4 years due to migration.

On population.io, you can explore–among lots of other population data–how living in a different country would affect your life expectancy. Click to try it yourself!
Now, if I add that I belong to the highest category in terms of education, what will happen to my life expectancy? Though education is not yet included in the population.io, it turns out that that also depends to a large degree on where I live. In Portugal or Italy, a person with a university degree would have lesser advantage compared to those with lower secondary education or below (2.5 and 2.6 years more respectively) than someone living in Estonia (13.8 years more) or the Czech Republic (12.5 years), Hungary and Bulgaria (12.1 years).
What if I am a smoker? Do not exercise? These factors too play an important role in future life expectancy, and we plan to add them soon to the population.io Web site.
Note: This article gives the views of the author, and not the position of the Nexus blog, nor of the International Institute for Applied Systems Analysis.


You must be logged in to post a comment.