Jun 24, 2016 | Climate, Food
By Daniel Mason-D’Croz, Senior Research Analyst at International Food Policy Research Institute (IFPRI)
(This post was originally published on the IFPRI Research Blog)
There are many challenges confronting decision makers in building robust and effective policies. They must balance pressing short-term needs with long-run challenges. They must confront these varying demands while facing imperfect knowledge of the complex systems (i.e. the economy, the environment, etc.) in which their policies will have impact. Above all, they also face the same uncertainty about the future as the rest of us, making perfect prediction about future outcomes impossible.
Nevertheless, decision makers must make choices in response to future challenges; inaction itself is an implicit choice, as change is inevitable. The challenge is to find a way to improve decision making, and in Multi-factor, multi-state, multi-model scenarios: exploring food and climate futures for Southeast Asia, recently published in Environmental Modelling Software, we believe we have presented a unique methodology to improve the decision-making process, by leveraging a participatory stakeholder-driven scenario development process with a multi-model ensemble to interactively explore future uncertainty with regional stakeholders.
This methodology was first applied in a workshop in Vietnam, where a diverse set of stakeholders from a wide range of sectors in Cambodia, Laos, and Vietnam collaborated to develop four multidimensional scenarios focusing on future agricultural development, food security, and climate change. Through building these multidimensional scenarios, stakeholders were challenged to consider potential interactions between varied parts of complex systems, like society and the environment. By doing this with a diverse set of stakeholders from public and private sectors, participants considered the future in a holistic and multidisciplinary manner. They were asked not only how different the future might look from the present, but also how they might respond to and shape future change. In so doing, regional stakeholders gained a better understanding of future uncertainty, while introspectively reviewing their own assumptions on the drivers of change, while creating four diverse scenarios that presented challenging plausible futures.
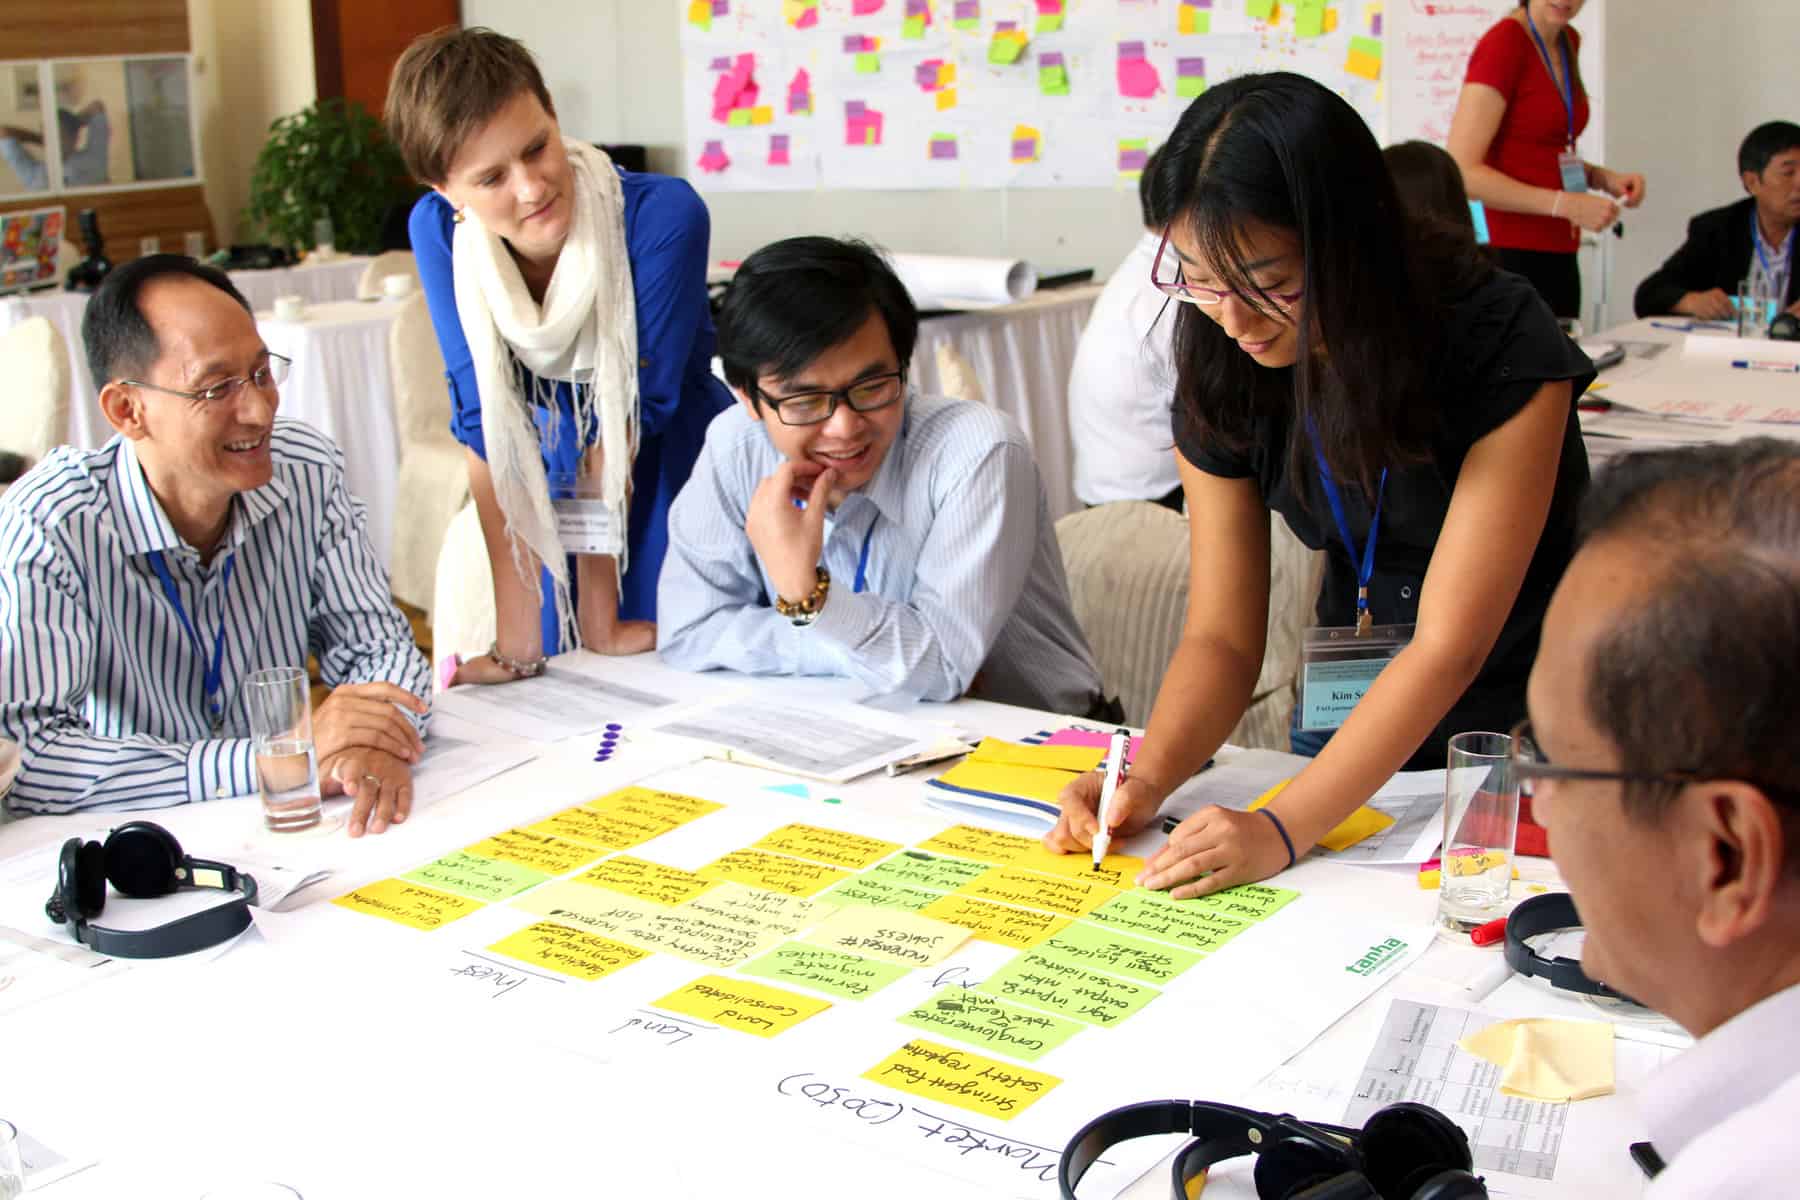
Participants at a 2013 workshop in Ha Long Bay, Vietnam – including regional stakeholders from development organizations, governments, the private sector, civil society, and academia – game out policies for the future of agriculture in Southeast Asia under different climate change scenarios, in an innovative approach combining collaboration with predictive modeling. © CGIAR photo
These scenarios were then quantified and simulated using a series of climate models, crop simulation models, and economic models including IFPRI’s IMPACT model and IIASA’s GLOBIOM model. Quantifying the scenarios in models can assist decision makers by pairing the qualitative aspects of the scenarios with quantitative analysis that systematically considers complex interactions and potential unintended consequences. Doing this quantification across a multi-model ensemble maintains the scenario diversity and richness, which in turn ensures that a broad possibility space is maintained throughout the process. This offers decision makers a larger test bed in which to evaluate potential policies. This multidimensionality and diversity of scenario outputs has been well received in the region, allowing them to be adapted and reused in a variety of policy engagements in Cambodia, Laos, and Vietnam.
- In Cambodia, scenario results were used to inform their Climate Change Priorities Action Plan (CCPAP) to better target and prioritize the spending of its 164 million U.S. dollar projected budget, a policy engagement that was done over 6 to 8 months as scenario analysis and use were embedded in the CCPAP
- In Laos, scenario results were presented in a regional workshop led by CCAFS and UNEP WCMC to evaluate regional policies for economic development, agricultural development, and climate change and consider potential environmental tradeoffs
- In Vietnam, scenario results were shared in a workshop led by CCAFS and FAO to review and revise climate-smart agriculture investments proposals by considering the potential effectiveness of different investments under various climatic and socioeconomic conditions
The regional scenarios were a collaborative effort that involved colleagues from many institutions including IFPRI, IIASA, FAO, UNEP WCMC, the CGIAR research program on Climate Change, Agriculture and Food Security (CCAFS), and the University of Oxford, among others. It would not have been possible without the funding and support from CCAFS, the CGIAR research program on Policies, Institutions, and Markets (PIM),Global Futures and Strategic Foresight, the FAO’s program on Economic and Policy Innovations for Climate-Smart Agriculture (EPIC), and UNEP WCMC through a MacArthur Foundation grant.
Reference
Mason-D’Croz D, et. al. (2016). Multi-factor, multi-state, multi-model scenarios: Exploring food and climate futures for Southeast Asia. Environmental Modelling & Software
Volume 83, September 2016, Pages 255–270. doi:10.1016/j.envsoft.2016.05.008
Note: This article gives the views of the author, and not the position of the Nexus blog, nor of the International Institute for Applied Systems Analysis.
Jun 2, 2016 | Climate Change
By Katherine Leitzell, IIASA science writer and press officer (and cyclist)
In May over 50 IIASA staff members took part in the Austrian Bike to Work month (Osterreich Radelt zur Arbeit), logging 11,681 kilometers riding to and from the institute in Laxenburg. The institute took fifth place in Austria in terms of kilometers ridden, and first place in Lower Austria.
According to the Austrian initiative’s calculations, this effort translated into saving over 1900 kg of CO2 emissions, or on average 36 kg per person—which is approximately 4% of an average Austrian’s monthly CO2 emissions. However, this calculation assumed that each of the IIASA cyclists would have been otherwise driving alone in a car. Since many people ride the bus or take public transport if they’re not biking, the actual emission savings from our cycling efforts in May were in fact much less. In fact, since buses and trains run anyway, cycling to work may make no impact whatsoever on emissions of air pollution and greenhouse gas emissions. Does that mean it’s not worth it to make the effort?
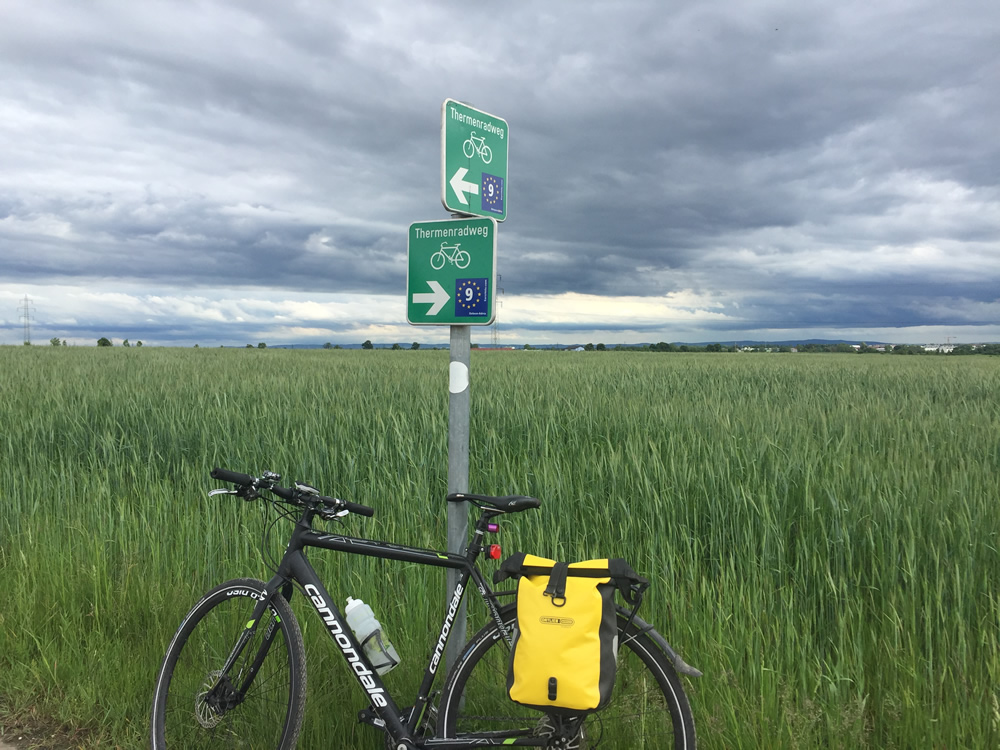
The author’s route to the office. © Katherine Leitzell | IIASA
IIASA researcher Jens Borken has analyzed the impacts that our daily travel has on the individual climate footprint. Personal mobility—all kinds of travel—make up about one third of the average European’s annual greenhouse gas emissions: the rest come from consumption choices and household heating and energy use. Of the carbon footprint from mobility, he says, commuting generally only makes up 10-15% of that. The largest part of the mobility budget is related to shorter and longer distance leisure travel, and in particular from air travel.
“From a quantitative perspective, the climate benefit of riding your bike is small, but it can be one step on a path to a low-carbon lifestyle.” says Borken. “As researchers who work on climate change, riding a bike to work (and possibly further) brings one piece of our lives in line with the message that avoiding fossil fuel consumption is imperative. I think that that is valuable. But it need not stop there. Travel choices are important, especially for longer distances, but so are consumption choices and energy usage and efficiency.”
Charlie Wilson, a researcher at the Tyndall Centre and IIASA, recently won a grant from the European Research Council to explore the role that social influence plays in spreading climate innovations. He says, “As social animals we are strongly influenced by what others do; as psychological beings we strive for consistency. Changing a behavior – like cycling to work – may have a small impact in isolation. But this impact is magnified through positive spillover effects. Others may imitate or be inspired by our commitment to cycling. And this change in behavior may also strengthen the pro-environmental aspects of our own self-identity, reducing dissonance between our work and domestic lives, and supporting further changes in behavior.”
Of course there are benefits of cycling beyond the environmental or climate impact, which is one reason that once they start, many people keep it up. Cycling regularly can save money compared to commuting by car or public transport, and like any regular form of exercise, it can bring health benefits and stress relief. It also brings autonomy and flexibility compared to public transport.
Borken points to research showing that the health benefits of cycling outweigh the exposure to air pollutants that a cyclist might experience on busy city streets—and that automobile drivers are exposed to even higher levels of air pollution within their cars. Cyclists who ride to IIASA, located about 15km outside Vienna, probably have even lower exposure to air pollution riding along tree-lined bike paths.
“Riding to work in the morning wakes me up and prepares me for the day ahead. Even if windy and challenging, the return in the evening calms the mind while riding with colleagues at a pace that allows us to chat at the end of a busy workday. It’s truly one of the best ways to get exercise and stay healthy – good for the heart, good for the environment and, most importantly, good for the soul,” says Michaela Rossini, manager of the IIASA library and a co-organizer of Bike to Work Month at the institute.

For some staff members, one side benefit of cycling to IIASA is the beautiful sunrise along the Danube River ©Michaela Rossini | IIASA
Note: This article gives the views of the author, and not the position of the Nexus blog, nor of the International Institute for Applied Systems Analysis.
May 17, 2016 | Citizen Science
By Dilek Fraisl, IIASA Ecosystems Services and Management Program
In October 2015, we launched our latest game, Picture Pile. The idea is simple: look at a pair of satellite images from different years and tell us if you can see any evidence of deforestation. Thanks to the participation of many volunteers, 2.69 million pictures have already been sorted in our pile of 5 million pairs. But we still have a long way to go, and we need your help to get us there!
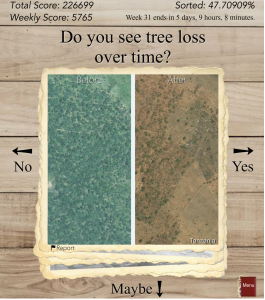
Screenshot from the game: click for more information (Image credit Tobias Sturn)
Deforestation is one of the most serious environmental problems in the world today. Forests cover a third of the land area on Earth, producing vital oxygen, habitats for a diversity of wildlife, and important ecosystem services. According to the World Wildlife Fund (WWF), some 46,000 to 58,000 square miles of forest are lost each year, which is equivalent to 48 football fields every minute. But this is a rough estimate since deforestation is very difficult to track. Reasons why are that satellite imagery can be of insufficient spatial resolution to map deforestation accurately, deforestation mostly occurs in small chunks that may not be visible from medium-resolution imagery, and very high-resolution data sets are expensive and can require big data processing capabilities, so can only be used for limited areas.
To help contribute to better mapping of deforestation, researchers in IIASA’s Earth Observation Systems (EOS) group, led by Steffen Fritz, have been working on novel projects to engage citizens in scientific data collection that can complement satellite-based traditional deforestation monitoring. One of the latest applications is Picture Pile, a game that makes use of very high-resolution satellite images spanning the last decade. Designed by Tobias Sturn, the aim is to provide data that can help researchers build a better map of deforestation. Players are provided with a pair of images that span two time periods and are then asked to answer a simple question: “Do you see tree loss over time?” After examining the image, the player drags the images to the right for “yes,” left for “no,” or down to indicate “maybe” when the deforestation is not clearly visible.
Every image is sorted multiple times by numerous independent players, in order to build confidence in the results, and also to gain an understanding of how good the players are at recognizing visible patterns of deforestation. Once enough data are collected at a single location, the images are taken out of the game and new ones are added, thereby increasing the spatial coverage of our mapped area over time. Right now we are focusing on Tanzania and Indonesia, two regions where we know there are problems with existing maps of deforestation.
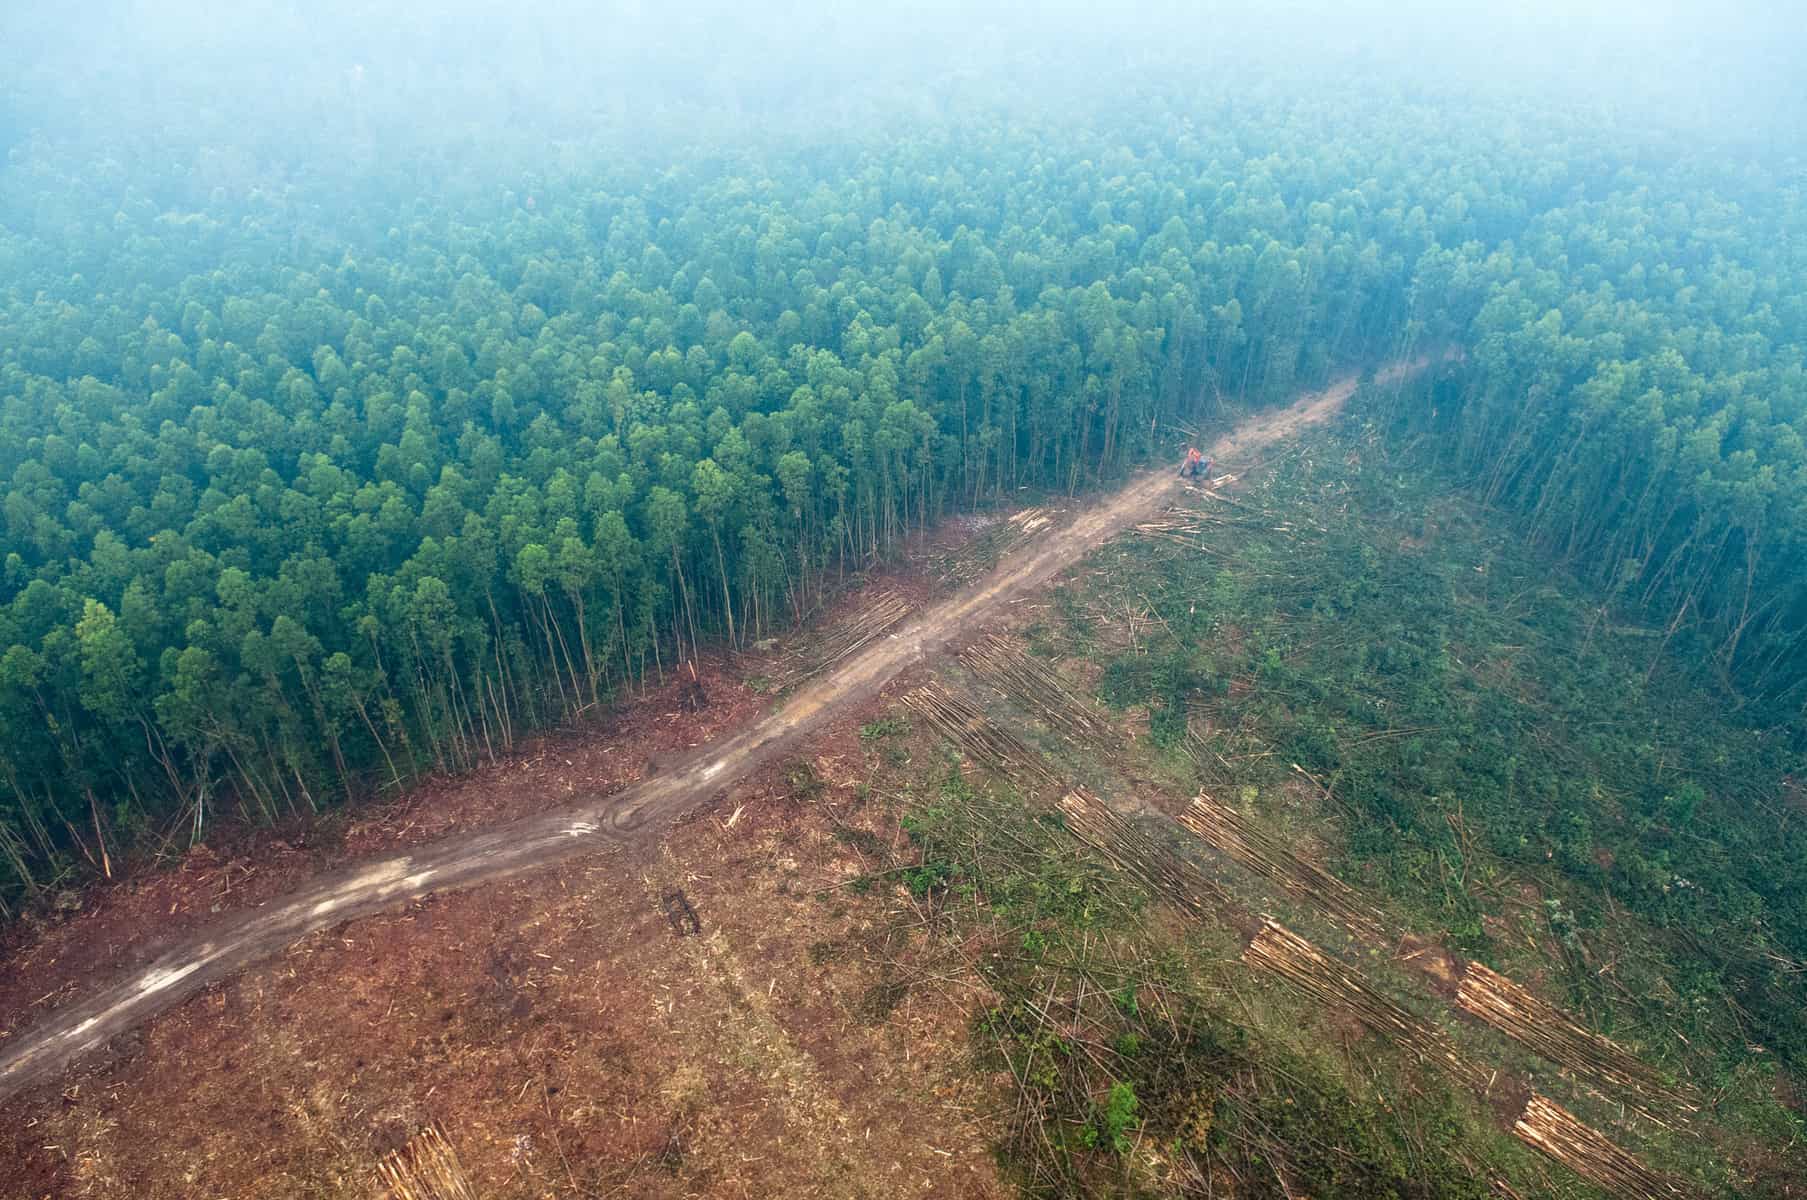
Picture Pile is focusing first on Indonesia (pictured) and Tanzania – two regions where there are problems with existing maps of deforestation. Photo (cc) Aulia Erlangga for Center for International Forestry Research (CIFOR).
Once the pile is fully sorted, the 5 million photos in the data set will be used to develop better maps of forest cover and forest loss using hybrid techniques developed by the group as well as inputs to classification algorithms. We will also use the data to validate the accuracy of existing global land cover maps. Finally, we will mine the data set to look for patterns regarding quality (for example, how many samples do we need to provide to the “crowd” before we can be confident enough to use their data in further research). In short, by integrating citizens in scientific research, Picture Pile will also help us improve the science of land cover monitoring through crowdsourcing mechanisms.
So please join in and help us get to the finish line. You can play Picture Pile in your browser or you can download the free iOS/Android app from the Apple and Google Play stores and play on your smartphone or tablet. Your contributions will help scientists like those at IIASA to tackle global problems such as deforestation and environmental degradation. At the same time you may win some great prizes: a brand new smartphone, a tablet, or a mini tablet.
More information:
Reference
Schepaschenko D, See L, Lesiv M, McCallum I, Fritz S, Salk C, Perger C, Schepaschenko M, Shvidenko A, Kovalevskyi S, Albrecht F, Kraxner F, Bun A, Maksyutov S, Sokolov A, Dürauer M, Obersteiner M. (2015) Global hybrid forest mask: synergy of remote sensing, crowd sourcing and statistics. Remote Sensing of the Environment, 162, 208-220. doi:10.1016/j.rse.2015.02.011
Note: This article gives the views of the author, and not the position of the Nexus blog, nor of the International Institute for Applied Systems Analysis.
May 4, 2016 | Risk and resilience
By Junko Mochizuki, Research Scholar, IIASA Risk and Resilience Program
Experts in the field of emergency management like to emphasize that there are important “lessons learned” in the aftermath of disaster situations. After large disaster events such as the 2015 earthquake in Nepal, and 2013 super typhoon Yolanda in Philippines, forensic investigations are often conducted to reveal ”what went wrong” in the chains of command, identifying what we can do differently when the next big one strikes. Such forensic investigations are not only relevant for the field of emergency management, but also for the field of disaster and climate risk management, which seeks to identify the underlying causes of what went wrong in the long chains of developmental policy intervention.
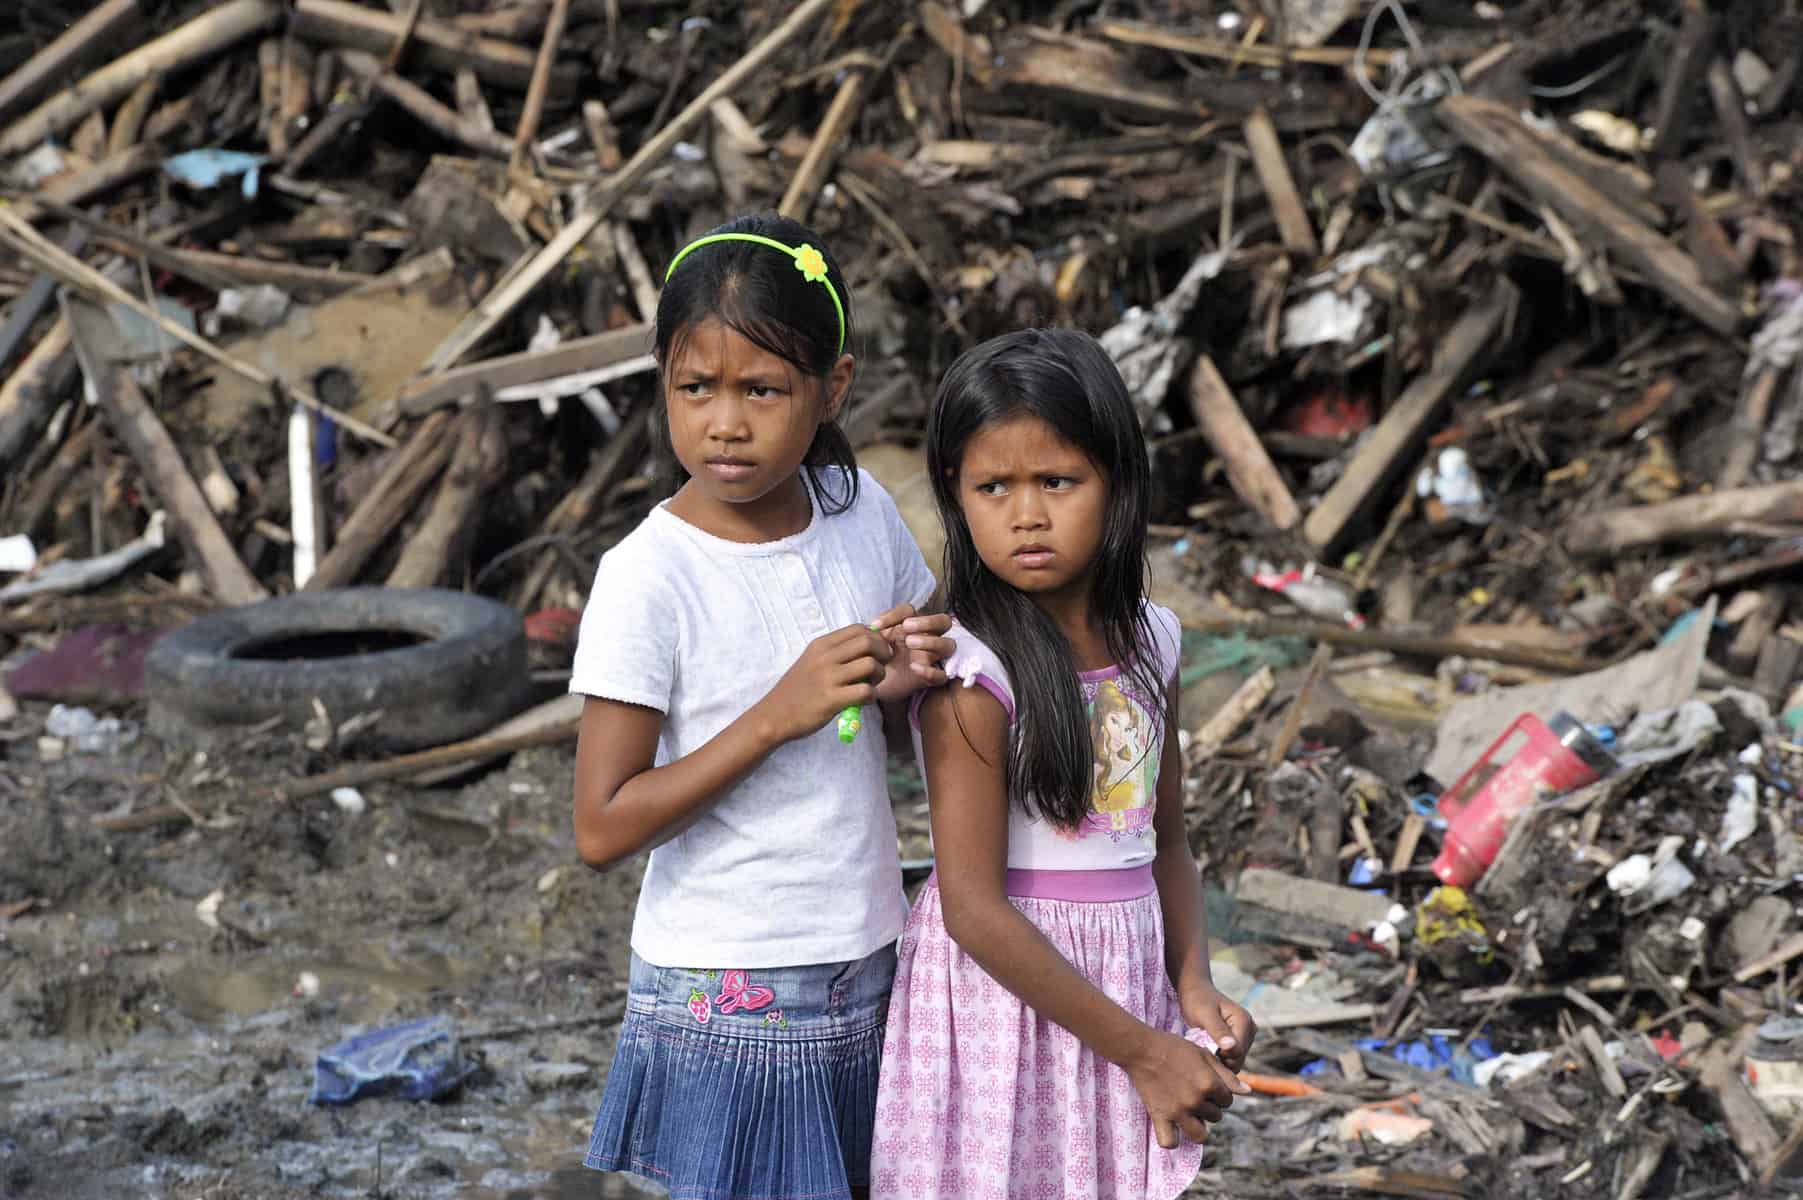
Survivors of Super Typhoon Yolanda in Tacloban City, Philippines, 2013. (cc) UN Photo/Evan Schneider
Over the years, researchers have identified a number of root causes that increase disaster risk—such as weak building codes and land use policy enforcement and overemphasis on ex-post emergency response as opposed to proactive management of disaster risk. Also, decades of economic studies looking at the costs and benefits of risk reduction investment show that such investment often pays off in the longer run. Yet, as the recent global trends of rising disaster risk unfortunately testify—we are far from learning these lessons effectively, or at least fast enough to beat the rising risk posed by future climate change: Global annual average disaster loss is estimated to have risen to approximately $300 billion in 2015 according to the UN Office for Disaster Risk Reduction (UNISDR).
As the special representative of the secretary general for disaster risk reduction, Robert Glasser wrote in the Guardian last week, “Every time there’s a mega disaster, there are lessons learned… The key question is always, how do you keep up the awareness after a couple of years?”
That is why the IIASA Risk and Resilience program’s research is increasingly focused on cognitive, behavioral, and governance aspects of societal learning on disaster risk reduction. We are currently working with public, private, and civil society stakeholders, asking the questions of why we, as a collective society, continue to fail to act on these lessons learned in disaster risk management and what we can do to change it. By combining both quantitative and qualitative systems analysis approaches, we are untangling why we make decisions the way we do, and what processes and institutional mechanisms directly and indirectly affect disaster risk and developmental outcome over the long term.
Given that catastrophic disasters are by definition rare events (hence opportunities for learning is naturally limited), we are doing this using novel methods such as participatory gaming or policy exercises in which we create virtual opportunities for stakeholders to experience complex decision-making in a safe learning environment. By creating stylized context for common decision-making (such as rural farmers making longer-term decisions on livelihood diversification, or urban planners addressing rising disaster risk due to rapid population growth), these gaming spaces serve as mechanisms through which stakeholders can not only learn about their cognitive and behavioral assumptions, but also through which learning can be accelerated, repeated, and shared among different communities facing similar development and disaster risk reduction challenges. We are running such policy exercises in the context of our flood resilience project and internal gaming project .
Decades of research have shown that there are common global lessons on development and disaster risk reduction but they are not so easily learned in practice. It is too often that that the windows of opportunities for policy learning are limited and we continue with business-as-usual of “lessons unlearned.” Creating an enabling environment for iterative learning is no easy task under these pragmatic constraints, but we hope that a bit of creativity and lots of hard work will eventually pay off in the long run.
Note: This article gives the views of the author, and not the position of the Nexus blog, nor of the International Institute for Applied Systems Analysis.
Apr 27, 2016 | Demography
By Sergei Scherbov, IIASA World Population Program (This post was originally published on The Conversation)
The populations of most countries of the world are aging, prompting a deluge of news stories about slower economic growth, reduced labor force participation, looming pension crises, exploding health care costs and the reduced productivity and cognitive functioning of the elderly.
These stories are dire, in part because the most widely used measure of aging – the old-age dependency ratio, which measures the number of older dependents relative to working-age people – was developed a century ago and implies the consequences of aging will be much worse than they are likely to be. On top of that, this ratio is used in political and economic discussions of topics such as health care costs and the pension burden – things it was not designed to address.
Turning 65 in 2016 doesn’t mean the same thing as hitting 65 in 1916. So instead of relying on the old-age dependency ratio to figure out the impact of aging, we propose using a series of new measures that take changes in life expectancy, labor participation and health spending into account. When you take these new realities into account, the picture looks a lot brighter.

How facts from the census questionnaire were tabulated into statistics in 1950. © The U.S. National Archives/Flickr
Our tools to measure aging have aged
The most commonly used measure of population aging is the “old-age dependency ratio,” which is the ratio of the number of people 65 years or older to those 20 to 64.
But, since the old-age dependency ratio was introduced in the early 1900s, most countries have experienced a century of rising life expectancy, and further increases are anticipated.
For instance, in 1914, life expectancy at birth in Sweden was 58.2 years (average for both sexes). By 2014, it had risen to 82.2 years. In 1935, when the U.S Social Security Act was signed into law, 65-year-olds were expected to live 12.7 more years, on average. In 2013, 65 year-olds may expect to live 19.5 years more.
But these changes aren’t reflected in the conventional statistics on aging. Nor is the fact that many people don’t just stop working when they turn 65, and that people are staying healthier for longer.
To get a better sense of what population aging really means today, we decided to develop a new set of measures that take these new realities into account to replace the old-age dependency ratio. And instead of one ratio, we created several ratios to evaluate health care costs, labor force participation and pensions.
Who retires at 65 anymore?
One of these new realities is that the number of people working into their late 60’s and beyond is going up. In 1994, 26.8% of American men aged 65-69 participated in the labor force. That figure climbed to 36.1% in 2014 and is forecast to reach 40% by 2024. And the trend is similar for even older men, with 17% of those aged 75-79 expected to still be working in a decade, up from just 10% in 1994.
Clearly, these older people did not get the message that they were supposed to become old-age dependents when they turned 65.
This isn’t unique to the U.S. Rates like these in many countries have been rising. In the U.K., for instance, the labor force participation rate of 65- to 69-year-old men was 24.2% in 2014, and in Israel it was 50.2%, up from 14.8% and 27.4%, respectively, in 2000. In part this is because older people now often have better cognitive functioning than their counterparts who were born a decade earlier.
So, instead of assuming that people work only from ages 20 to 64 and become old-age dependents when they hit 65, we have computed “economic dependency ratios” that take into account observations and forecasts of labor force participation rates. This tells us how many adults not in the labor force there are for every adult in the labor force, giving us a more accurate picture than using 65 as a cutoff point. We used forecasts produced by the International Labor Organization to figure this out.
The old-age dependency ratio in the U.S. is forecast to increase by 61% from 2013 to 2030. But using our economic dependency ratio, the ratio of adults in the labor force to adults not in the labor force increases by just 3% over that period.
Clearly, doom and gloom stories about U.S. workers having to support so many more non-workers in the future may need to be reconsidered.
Is the health care burden going to be so high?
Another reality is that while health care costs will go up with an older population, they won’t rise as much as traditional forecasts estimate.
Instead of assuming that health care costs rise dramatically on people’s 65th birthdays, as the old-age dependency ratio implicitly does, we have produced an indicator that takes into account the fact that most of the health care costs of the elderly are incurred in their last few years of life. Increasing life expectancy means those final few years happen at ever later ages.
In Japan, for example, when the burden of the health care costs of people aged 65 and up on those 20-64 years old is assessed using only the conventional old-age dependency ratio, that burden is forecast to increase 32% from 2013 to 2030. When we compute health care costs based on whether people are in the last few years of their lives, the burden increases only 14%.
Pension ages are going up
The last reality we considered concerns pensions.
In most OECD countries, the age at which someone can begin collecting a full public pension is rising. In a number of countries, such as Sweden, Norway and Italy, pension payouts are now explicitly linked to life expectancy.
In Germany, the full pension age will rise from 65 to 67 in 2029. In the U.S., it used to be 65, is now 66 and will soon rise to 67.
Instead of assuming that everyone receives a full public pension at age 65, which is what the old-age dependency ratio implicitly does, we have computed a more realistic ratio, called the pension cost dependency ratio, that incorporates a general relationship between increases in life expectancy and the pension age. The pension cost dependency ratio shows how fast the burden of paying public pensions is likely to grow.
For instance, in Germany, the old-age dependency ratio is forecast to rise by 49% from 2013 to 2030, but 65-year-old Germans will not be eligible for a full pension in 2030. Our pension cost dependency ratio increases by 26% over the same period. Instead of indicating that younger Germans will have to pay 49% more to support pensioners in 2030 compared to what they paid in 2013, taking planned increases in the full pension age into account, we see that the increase is 26%.

Pranom Chartyothin, a 72-year-old bus conductor, sells and collects bus tickets in downtown Bangkok, Thailand. Photo Credit: Jorge Silva/Reuters, CC BY
Sixty-five just isn’t that old anymore
In addition to this suite of measures focused on particular aspects of population aging, it is also useful to have a general measure of population aging. We call our general measure of population aging the prospective old-age dependency ratio.
People do not suddenly become old-age dependents on their 65th birthdays. From a population perspective, it makes more sense to classify people as being old when they are getting near the end of their lives. Failing to adjust who is categorized as old based on the changing characteristics of people and their longevity can make aging seem faster than it will be.
In our prospective old-age dependency ratio, we define people as old when they are in age groups where the remaining life expectancy is 15 years or less. As life expectancy increases, this threshold of old age increases.
In the U.K., for instance, the conventional old-age dependency ratio is forecast to increase by 33% by 2030. But when we allow the old-age threshold to change with increasing life expectancy, the resulting ratio increases by just 13 percent.
Populations are aging in many countries, but the conventional old-age dependency ratio makes the impact seem worse than it will be. Fortunately, better measures that do not exaggerate the effects of aging are now just a click away.
Note: This article gives the views of the author, and not the position of the Nexus blog, nor of the International Institute for Applied Systems Analysis.

You must be logged in to post a comment.