Jul 29, 2016 | Air Pollution, Young Scientists
By Anneke Brand, IIASA science communication intern 2016.
Accidents, lane closures, and congestion all affect the flow of road traffic and harmful emissions from vehicles. Live traffic data allow congestion to be detected more accurately and provide a more precise overview of vehicle emissions at different times and places. In his project for the Young Scientists Summer Program (YSSP), Fabian Heidegger investigates how road traffic affects air pollution in cities, using Vienna and surrounding areas as a case study.
Air pollution is a major problem in Europe and globally. Health impacts of air pollution include a range of respiratory and cardiovascular diseases. “10-20% of Europe’s urban population is exposed to excessive levels of nitrogen dioxide (NO2), along with several other air pollutants. NO2 pollution is highest along busy roads. Technical measures have so far often been circumvented, so cities are looking for other measures to reduce the pollution load. Traffic management has therefore gained interest as a way to reduce air pollution,” says Jens Borken-Kleefeld, Heidegger’s study leader at IIASA.
To calculate the amount of air pollution that cars and other vehicles release into the air, researchers use models that apply various sets of data: traffic networks, where and how far people drive, and emission factors of different vehicle categories. Input data for the model may include how many people live in a certain area, how many of them use cars, where they normally drive, and how many grams of pollutants (such as nitric oxide and NO2 gases) their type of cars emit per kilometer.

Inner city Vienna. © Radub85 | Dreamstime.com
Most of these models rely on average daily traffic data. For Heidegger’s YSSP project, which is related to his PhD work at the University of Natural Resources and Life Sciences in Vienna, he is incorporating real-time data, measured every five minutes, into a traffic simulation model developed by Intelligent Transport Systems Vienna Region. A set of detectors in and around the city record the number and speed of vehicles. In addition, location data from the taxi fleet is incorporated into the traffic simulation. Heidegger can therefore immediately identify adverse traffic conditions like stop-and-go traffic, which has a high impact on emissions. This allows for a more accurate calculation and can help design traffic interventions for improving both traffic flow and air quality.
“In the case of a road closure, local emissions will obviously be lower at the specific road but total emissions for the area could be higher than before when drivers use alternative, longer routes or end up in stop-and-go traffic,” says Heidegger.
In order to understand how these diversions and the displacement of pollutants can affect overall emissions, Heidegger will first determine the emissions per street section, and second, what the effects are of diversions from day-to-day traffic patterns. Together with researchers from the Air Quality and Greenhouse Gases Program at IIASA, Heidegger plans to assess the impact of different intervention scenarios, for example an environmental zone in the city, where only modern cars will be allowed to enter. In a second scenario he will look at the effect of people commuting to Vienna, and a third scenario will explore the consequences of expanding pedestrian zones. The researchers hope that this study will better their understanding of the potential of traffic management to reduce air pollution.
More information
Air Pollution Policy Review 2011-2013
GAINS Model
AIR Program
Note: This article gives the views of the author, and not the position of the Nexus blog, nor of the International Institute for Applied Systems Analysis.
Jul 20, 2016 | Communication
By Luke Kirwan, open access manager, IIASA library.
Who reads your paper after it’s published? Altmetrics (Alternative Metrics) are a recent innovation designed to supplement traditional metrics, such as impact factors, which provide an overview of a journal’s standing within academia. However, these traditional measures are unable to take into account the dramatic changes in publishing and dissemination that the internet has brought.
Altmetrics complement traditional methods by accounting for the broader reach and impact of research online. They achieve this by tracking the digital identifier of research output, through DOIs, PubMed ids, arXiv ids, across a broad range of social media, mainstream media, blogs, policy documents, and reference management tools. This provides an immediate, broader, and more detailed overview of the impact of your publication. Each mention is given a weighted score, so for example a mention in a scientific publication is weighted far higher than a tweet. There are several well-documented studies of the benefits of article level metrics over impact factors.
When we designed the new IIASA Publication Repository (PURE), we incorporated altmetrics, because in today’s world, traditional metrics like impact factors no longer tell the whole story. The concept behind altmetrics is to broaden how impact is measured, beyond simply counting citations. I think of altmetrics and impact factors as two complementary tools with the same goal, but different ways of getting there.

You can see the citation and usage data for an article in the Altmetric “donut” at the bottom of a record. By clicking on the link to Altmetric.com you can then access more detailed information about that publication’s reach. One of the core concepts behind altmetrics is that people should be able to access every mention that has gone into the weighted score. So by viewing the details for a record on Altmetric.com you can also find out who was tweeting about your paper, what newspaper articles it was mentioned in, who was blogging about it, and any other coverage. This means that you can immediately see the type of attention being generated by a piece of research, where this attention is coming from, what influence it has, and the geographic spread. Altmetrics relies on real-time data so results can be quantified rapidly. The goal is to quickly provide an overview of the diversity of areas where your research is being talked about. It is important to note that altmetrics is only assessing mentions of a research paper—it makes no judgement on quality. So this feedback needs to be read in the context of the quality of the paper and the research. This is partially the reason why Altmetric are so open about what information they use to generate their results.
So what is a good altmetric score? This is not a particularly straight forward question as an altmetric score measures attention, which can be positive or negative. To help you understand your altmetric score select the “Score in Context” option. This will breakdown how the score compares with similar articles, all tracked research, and the output from that journal.
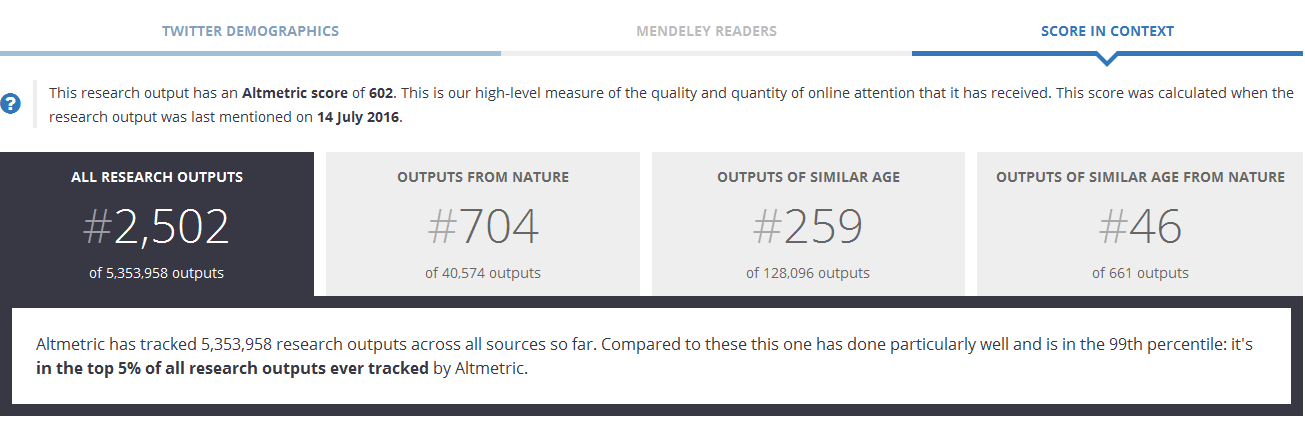
There are a number of ways you can help boost the attention your research is receiving. The first is to ensure that your research is made available in a repository as soon as possible. The sooner your research is accessible, the sooner it can be used and referenced. The better the metadata for a record the more visible is will be online. Older entries are also accounted for, though of course publications over ten years old do not benefit as much from social media. We are currently working through older entries in PURE to update their metadata. Tweeting and sharing your research will also help, especially if you use the social media analytics to identify who has been using your work in the past and develop connections with them.
A second way to improve your score is to develop your presence on informal social networks, like Twitter, blogs, and more structured academic networks like Google Scholar and Academia.edu. By linking them together you will boost your online presence and help ensure that your research reaches as many people as possible. Altmetrics relies on digital connections between your output, yourself, and your peer network so strengthening these linkages will help improve your visibility.
Altmetrics introduction video https://www.youtube.com/watch?v=6R6WdoQxvUE
OpenAIRE guidelines for researchers https://www.openaire.eu/intro-researchers
Note: This article gives the views of the author, and not the position of the Nexus blog, nor of the International Institute for Applied Systems Analysis.
Jul 15, 2016 | Alumni, Climate, Climate Change, Young Scientists
César Terrer, participant in the IIASA 2016 Young Scientists Summer Program, and PhD student at Imperial College London, recently made a groundbreaking contribution to the way scientists think about climate change and the CO2 fertilization effect. In this interview he discusses his research, his first publication in Science, and his summer project at IIASA.
Conducted and edited by Anneke Brand, IIASA science communication intern 2016.

César Terrer ©Vilma Sandström
How did your scientific career evolve into climate change and ecosystem ecology?
I studied environmental science in Spain and then I went to Australia, where I started working on free-air CO2 enrichment, or FACE experiments. These are very fancy experiments where you fumigate a forest with CO2 to see if the trees grow faster. In 2014 I moved to London for my PhD project. There, instead of focusing on one single FACE experiment, I collected data from all of them. This allowed me to make general conclusions on a global scale rather than a single forest.
You recently published a paper in Science magazine. Could you summarize the main findings?
We found that we can predict how much CO2 plants transfer into growth through the CO2 fertilization effect, based on two variables—nitrogen availability and the type of mycorrhizal, or fungal, association that the plants have. The impact of the type of mycorrhizae has never been tested on a global scale—and we found that it is huge. I think it’s fascinating that such tiny organisms play such a big role at a global scale on something as important as the terrestrial capacity of CO2 uptake.
How did you come up with the idea? One random day in the shower?
Long story short, researchers used to think that plants will grow faster, and take up a lot of the CO2 we emit. They assumed this in most of their models as well. But plants need other elements to grow besides CO2. In particular, they need nitrogen. So scientists started to question whether the modeled predictions overestimated the CO2 fertilization effect, because the models did not consider nitrogen limitation. To find out, I analyzed all the FACE experiments and indeed I saw that in general plants were not able to grow faster under elevated CO2 and nitrogen limitation. However, in some cases plants were able to take advantage of elevated CO2 even under nitrogen limitation. I grouped together the experiments where plants could grow under nitrogen limitation and after a lot of reading I saw what they had in common: the type of fungi! It turned out that one type of mycorrhizae is really good at transferring large quantities of nitrogen to the plant and the other type is not.
How did that feel?
Awesome! When I saw the graph, I knew: this is going to be important. Of course, after this, my coauthors helped me to polish the story. Without them, the conclusions would not be as robust and clear.
So how does this process work? Where do the fungi get the nitrogen from?
Particular soils might have a lot of nitrogen, but the amount available for plants to absorb might be low. Also, plants have to compete with non-fungal microorganisms for nitrogen. So if there is not much there, the microorganisms take it all. It’s called immobilization. Instead of mineralizing nitrogen, they immobilize it so that plants cannot take it up, at least not in the short term. Some types of fungi are much more efficient in accessing nitrogen, and associated with roots they allow plants to overcome limitations.
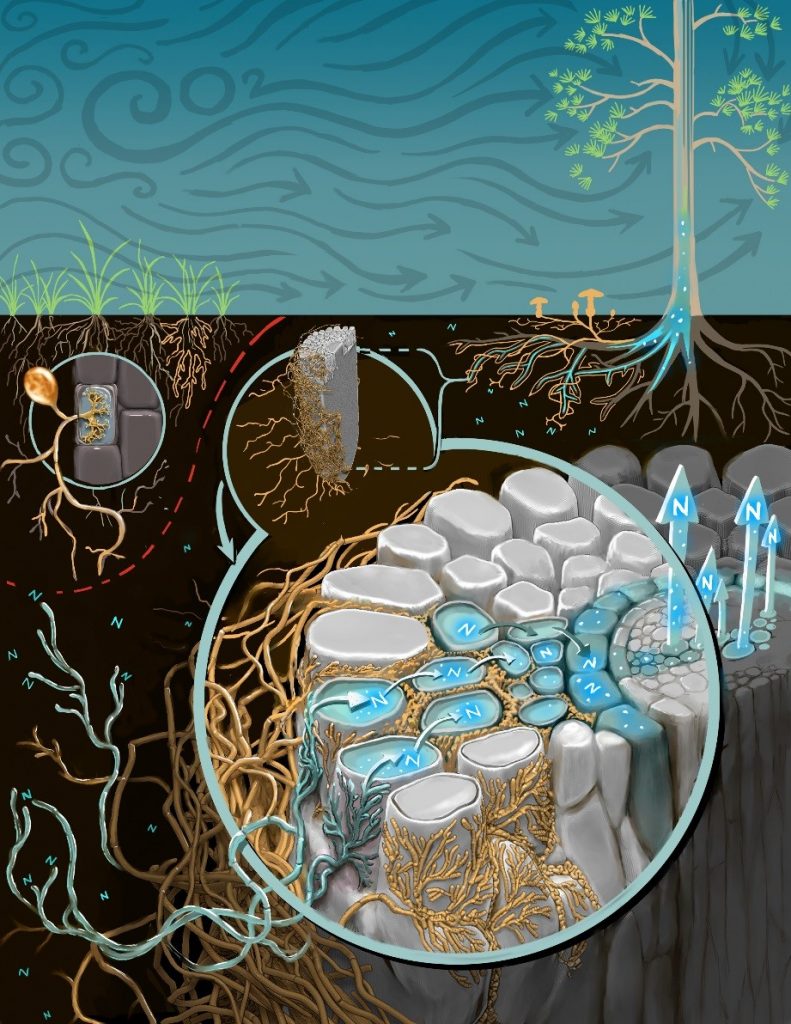
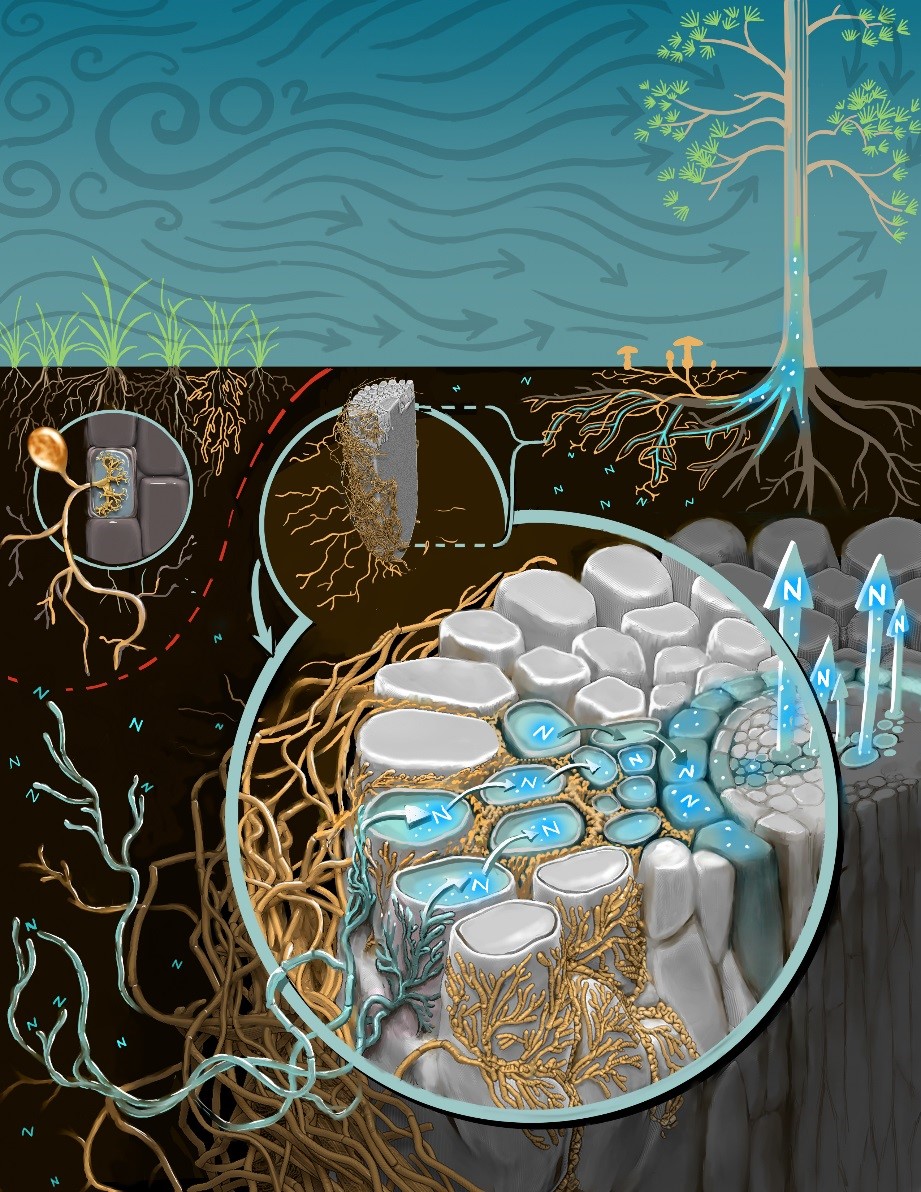
Nitrogen mobilization abilities of different types of fungi. Growth of plants associated with fungi not beneficial for nitrogen uptake (illustrated as grass roots on the left) could be limited by low nitrogen availability in soil. Other plants have the advantage of increased nitrogen uptake due to their beneficial association with certain types of fungi (illustrated as yellow mushrooms connected to the roots of the tree on the right). ©Victor O. Leshyk.
What is the impact of your findings?
Plants currently take up 25-30% of the CO2 we emit, but the question is whether they will be able to continue to do so in the long term. Our findings bring good and bad news. On the one hand, the CO2 fertilization effect will not be limited entirely by nitrogen, because some of the plants will be able to overcome nitrogen limitation through their root fungi. But on the other hand, some plant species will not be able to overcome nitrogen limitation.
There was a big debate about this. One group of scientists believed that plants will continue to take up CO2 and the other group said that plants will be limited by nitrogen availability. These were two very contrasting hypotheses. We discovered that neither of the hypotheses was completely right, but both were partly true, depending on the type of fungi. Our results could bring closure to this debate. We can now make more accurate predictions about global warming.
What will you do at IIASA and how will you link it to your PhD?
I want to upscale and quantify how much carbon plants will take up in the future. If we are to predict the capacity of plants to absorb CO2, we need to quantify mycorrhizal distribution and nitrogen availability on a global scale. We are updating mycorrhizal distribution maps according to distribution of plant species. We know for instance that pines are associated with ectomycorrhizal fungi and always will be. To quantify nitrogen availability we use maps of different soil parameters that are available on a rough global scale.

© Adam Edwards | Dreamstime.com
About César Terrer
Prior to his PhD, Terrer studied at the University of Murcia in Spain and the University of Western Sydney in Australia.
Currently he is a member of the Department of Life Sciences at Imperial College London, UK. For this study he collaborated with researchers from the University of Antwerp, Northern Arizona University, Indiana University and Macquarie University.
In the IIASA Young Scientists Summer Program, Terrer works together with Oskar Franklin from the Ecosystem Services and Management Program and Christina Kaiser from the Evolution and Ecology Program.
Further reading
Note: This article gives the views of the interviewee, and not the position of the Nexus blog, nor of the International Institute for Applied Systems Analysis.
Jul 8, 2016 | Energy & Climate
By Daisy Brickhill, IIASA science writer and editor.
Many of the options proposed for achieving a stable climate rely on ‘bioenergy with carbon capture and storage’ — burning plant matter for energy, capturing the carbon, and storing it underground. However, this technology has hardly been deployed on anything approaching the large scale. Is it a realistic tool for climate mitigation?
Limiting global warming to 2°C above pre-industrial times has long been a reference point for policymakers and researchers trying to reduce the chances of dangerous climate change. The 2015 Paris climate summit went even further, with countries agreeing to try and limit temperature rise to 1.5°C.
However, while there is a strong scientific consensus that we need to aggressively cut greenhouse gas emissions immediately, there is also growing evidence that we may not be able to achieve the necessary reductions in the time available. This means that we may need a way of removing CO2 already in the atmosphere — a process known as negative emissions.
Negative emissions can come in many forms: from simply planting more trees, to crushing rocks that naturally absorb CO2. One widely considered option is using plant matter as a fuel to produce energy, then capturing the CO2 that is emitted and storing it underground. This is known as bioenergy with carbon capture and storage (BECCS).
This latter technology is cited by research as being an important part of restricting warming to safe — or at least safer — levels since it contributes to both carbon sequestration and decarbonization of the energy system. In fact, more than half of the future scenarios that give at least a 66% chance of limiting warming to 2°C, which were developed for the Intergovernmental Panel on Climate Change (IPCC), feature BECCS.
However, the technology remains mostly untested on a large scale and there are doubts about its sustainability in terms of land and water use, and other potentially negative impacts on the environment. With so many IPCC scenarios including BECCS, information on whether it is at all a practical solution is desperately needed.
A recent IIASA study addresses deployment of BECCS in Indonesia, examining whether adapting existing coal-fired power stations so that they can burn a mix of coal and plant waste from agriculture (such as seed kernels or stems that are usually discarded), is more effective than building specific biomass-burning power stations.

Rice paddies in Indonesia. Plant waste from agriculture can be used in bioenergy with carbon capture and storage systems.
The team found that although both options saved the same amount of CO2, the combined stations were more efficient, producing more electricity for the amount of biomass burnt. “More efficiency means that burning biomass in adapted coal-fired power stations would be more economically viable,” says IIASA researcher Ping Yowargana, coauthor of the study. “It is also likely to be easier and cheaper to convert existing coal power stations than build new specific biomass-burning stations. With lower investments and existing infrastructure, policymakers and other stakeholders are more likely to embrace the idea.”
There are limitations: the study results indicate that under the current conditions it is not possible to burn any more than 30% biomass in a combined power station, for instance. There are also uncertainties surrounding whether it is possible to collect enough biomass on the scale needed. “We need to do further work on the logistic and financial feasibility of BECCS,” says Yowargana. “But these results are broadly general, and can be applied to other countries and situations, making them a valuable starting point.”
And while a complete conversion to a decarbonized energy system is needed in the long term, this work points the way to how BECCS might be deployed now to help prevent the damaging climate change we have sown for ourselves.
Reference: Hetland J, Yowargana P, Leduc S & Kraxner F (2016). Carbon-negative emissions: Systemic impacts of biomass conversion: A case study on CO2 capture and storage options. International Journal of Greenhouse Gas Control, 49. pp. 330-342.
Further reading:
https://www.carbonbrief.org/beccs-the-story-of-climate-changes-saviour-technology
Moreira, J. R., Romeiro, V., Fuss, S., Kraxner, F. and Pacca, S. A. (2016) BECCS potential in Brazil: Achieving negative emissions in ethanol and electricity production based on sugar cane bagasse and other residues. Applied Energy, 179. pp. 55-63. Item availability may be restricted.
Smith, P., Davis, S.J., Creutzig, F., Fuss, S., Rogelj, J., McCollum, D., Krey, V., Grubler, A., Jonas, M., Kraxner, F., Nakicenovic, N., Obersteiner, M. and Rogner, M. (2016) Biophysical and economic limits to negative CO2 emissions. Nature Climate Change, 6 (1). pp. 42-50.
Fuss, S., Canadell, J.G., Peters, G.P., Tavoni, M., Andrew, R.M., Ciais, P., Jackson, R.B., Jones, C.D., Kraxner, F., Nakicenovic, N., Le Quere, C., Raupach, M.R., Sharifi, A., Smith, P. and Yamagata, Y. (2014) Betting on negative emissions. Nature Climate Change, 4 (10). pp. 850-853.
Note: This article gives the views of the author, and not the position of the Nexus blog, nor of the International Institute for Applied Systems Analysis.
Jun 30, 2016 | Postdoc, Water
By Edward Byers, Postdoctoral Research Scholar, IIASA Water, Energy, and Transitions to New Technologies programs
Scenario analysis, a process for comparing alternative futures, has been a fundamental tool in sustainability and systems research, but less prominent in the water field. Recently, researchers at IIASA have been applying scenario analysis to their modelling capabilities to tackle global water issues.
Last week, a high level group of water experts met at IIASA for the Water Futures and Solutions (WFaS) Stakeholder Focus Group. WFaS is a flagship initiative from IIASA challenged with understanding future water resource issues, and identifying solutions to problems like water scarcity and water access. However, when a recent fast track assessment found that even its most sustainable scenario, would still result in water scarcity in some river basins due to growing demands, researchers realized that fresh thinking was required. So in last week’s meeting, IIASA water researchers were on the search for more sustainable and transformational solutions. The efficacy of these new sustainability scenarios will be tested in IIASA’s new ensemble of global hydrological models and presented in time for the next World Water Forum 2018.

Victoria Falls on the Zambezi River. In the Zambezi basin, water is abundant but there are challenges in getting that water to the people who need it, particularly as the population grows in the future. (cc) Pius Mahimbi | Flickr
The two-day workshop at IIASA hosted 20 international water experts from around the world and across research, government, and development organisations. Modellers from the IIASA water program, myself included, took part in the focus groups with the experts, discussing how to represent in our models complex interactions that occur in transboundary river basins as well as for key interactions with other sectors such as energy and agriculture.
Our discussions on the Zambezi, the Indus, and the Yellow river basins will contribute to broader understanding of the development challenges in three different parts of the world –not just along the rivers, but throughout the entirety of the river basins and the populations and ecosystems that they support. For example, the Indus basin is extremely water scarce and is expected to be further depleted due to melting of the upstream glaciers. In the Zambezi basin, in contrast, water is abundant, but there are significant political and economic challenges to sustainably providing access to a population of 38 million people that is expected to double within one generation.
Similarly, our sectoral discussions on energy, food, economics, and ecosystems will improve our model representations of sectors that may be substantially different by 2050, such as the energy sector. This is particularly important for demonstrating how the benefits of water security unlock other benefits for development challenges, such as health, food security, gender equality, and education.
Identifying, quantifying and communicating these well-recognized, inter-dependent benefits can be key to unlocking the investment in solutions. Our work with the experts focused primarily on Sustainable Development Goal 6, the Clean Water and Sanitation Access goal, with a view to identifying co-benefits for other goals. Having received much useful information and positive feedback from our stakeholders, the challenge now is to integrate this into our models and scenario narratives, so that we can demonstrate on a global scale the benefits of water security not as a development target to be attained, but as one of the fundamental drivers of sustainable development. With growing populations and intensifying impacts of climate change, challenges for water security will continue long beyond the Sustainable Development Goals for 2030. Meeting these targets is just the first step of the pathway to long-term water security.
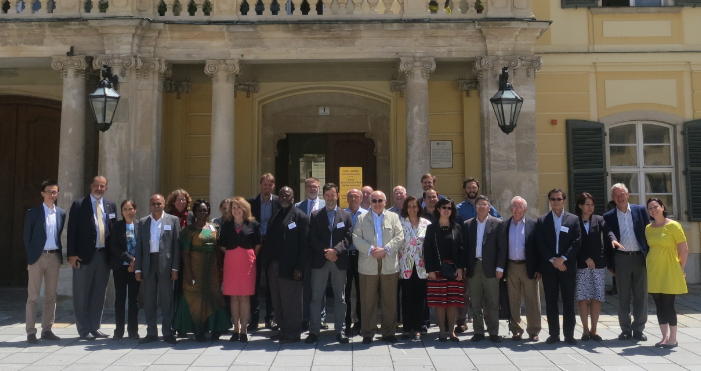
Participants in the 2nd Water Futures and Solutions Scenario Focus Group Meeting. ©Phillip Widhalm | IIASA
The Water Futures and Solutions Initiative (WFaS) was launched by IIASA, UNESCO/UN-Water, the World Water Council (WWC), the International Water Association (IWA), and the Ministry of Land, Infrastructure and Transport (MOLIT) of the Republic of Korea, and has been supported by the government of Norway, the Asian Development Bank, and the Austrian Development agency. More than 35 organizations contribute to the scientific project team, and an additional 25 organizations are represented in stakeholder groups.
Note: This article gives the views of the author, and not the position of the Nexus blog, nor of the International Institute for Applied Systems Analysis.


You must be logged in to post a comment.