Apr 24, 2017 | Sustainable Development
By Owen Gaffney, Stockholm Resilience Center (excerpted from a post on Rethink.earth)
What will the world be like in 2050?
Of course, it is difficult to make predictions, especially about the future, as the Danish proverb goes.
Part of the difficulty is that we – individuals and the institutions that allow us to act collectively and in the long term – routinely assume the future looks very much like the past. Just as routinely, though, this assumption is flipped on its head. Think of the global financial crisis, the Arab Spring, Brexit, or the recent US election.
But what if we already know what we want the world to look like in 2050. How do we get there?
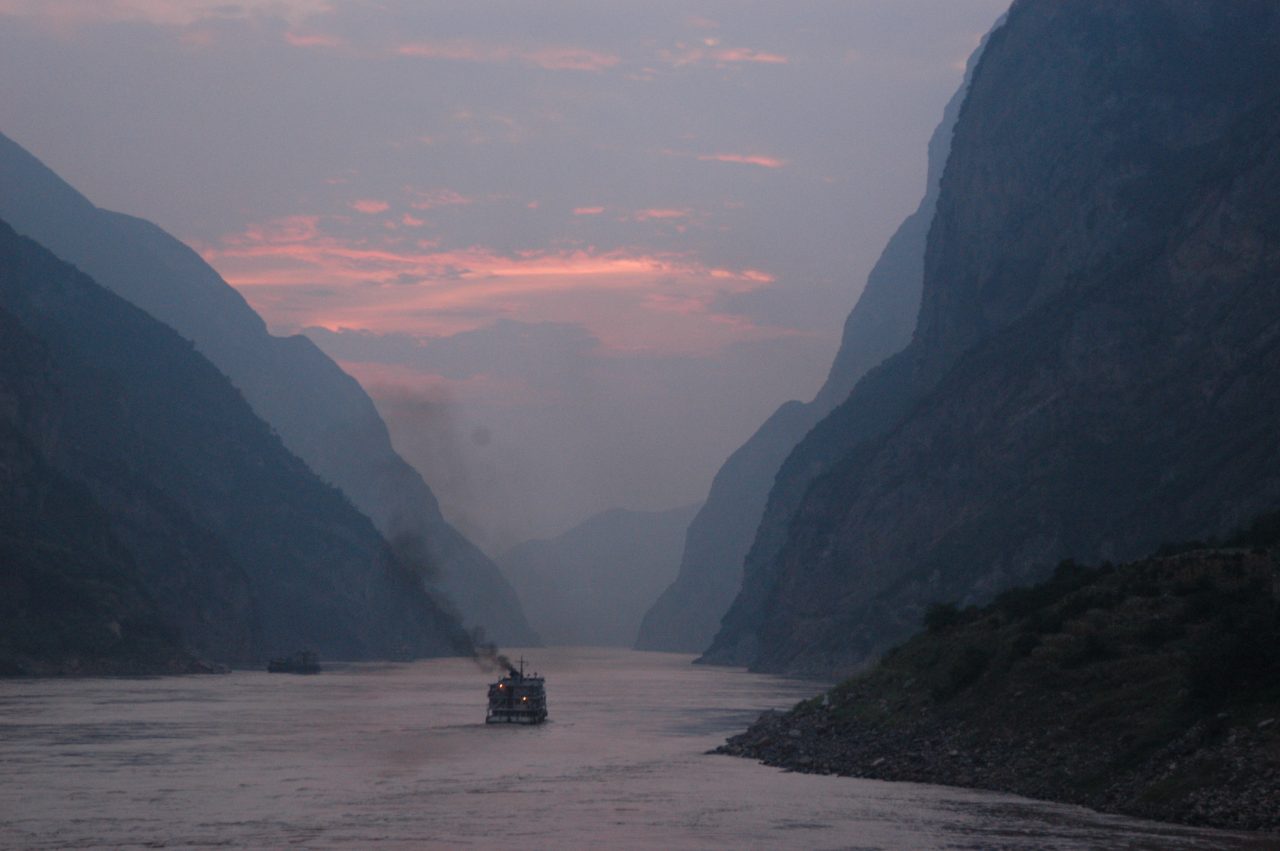
Dusk on Chang Jiang (Yangtze) Credit: Andrew Hitchcock | Flickr, CC BY 2.0,
I was reminded of the Danish proverb as I arrived at the International Institute for Applied Systems Analysis (IIASA) outside Vienna earlier this month for a three-day meeting of The World in 2050 (TWI2050) initiative. This was the third such scientific meeting hosted here at the home of some of the leading economic, demographic and energy modellers.
TWI2050 is arguably the most ambitious research being undertaken in the world today. At its heart is an ambition to map out the pathways for a sustainable planet. As with the previous meetings, it attracted about 130 complex-systems thinkers and computer-modelling experts.
Unlike other international modelling initiatives, TWI2050 was not created to explore a range of possible utopian to dystopian scenarios focusing on energy prices or climate change. The baseline assumption is a single scenario: successful completion of the Sustainable Development Goals (SDGs), agreed by all nations in 2015, and arriving in 2050 with a global economy operating within planetary boundaries – the limits of natural systems that keep Earth in a relatively stable state, relating to climate, biodiversity, deforestation, and fertilizer use, among others.
#winwin
The 17 SDGs and their 169 targets are extremely ambitious. Buried in the detail are many trade-offs but also potential win-wins. Meeting the climate goal means reducing greenhouse-gas emissions to zero, and this could affect the energy, biodiversity, or consumption goals either positively or negatively. The goals and their inherent trade-offs are already catalyzing research and the results show how challenging this will be.
This month, scientists publishing in the journal Nature explored Australia’s land-use trade-offs to reach the goals. The team, who were not at the TWI2050 meeting, used a massive computer simulation called Land Use and Trade Offs (LUTO) to see how factors such as climate policies or crop prices could shape Australia’s landscape by 2050. Exploring 648 scenarios, researchers Brett Bryan and Lei Gao found just 1% of scenarios achieved five goals simultaneously. However, some goals seemed to go better together than others. Achieving targets related to food, water, and biofuel production was possible in 6.5% of scenarios, for example. The authors, whose work contributes to Future Earth’s Global Land Programme, conclude that national policymakers need more of this type of analysis to elucidate trade-offs and avoid conflicting policies. Moreover, they argued for more scientific coordination internationally for a global perspective on implementing the SDGs.
Other research groups have also begun exploring the world in 2050. Recently Karl Heinz Erb from the Institute of Social Ecology, Vienna, who attended the TWI2050 workshop, and colleagues explored 500 scenarios to assess options for feeding 9 billion people in 2050 without further deforestation .
Their work, which also supports the Global Land Programme, concluded that it was possible, but would likely mean low meat, vegetarian, or vegan diets globally. Meanwhile, Marco Springmann from the Oxford Martin Programme on the Future of Food, also attending, and colleagues showed that by 2050 a global vegetarian diet would reduce diet-related global mortality by 6-10% and food-related greenhouse gas emissions by 29-70% – contributing to several goals. This type of research is essential to understand potential win-wins but these examples do not provide the pathways to arrive at these scenarios.
So, are computer models powerful enough to capture essential elements of incremental and disruptive change across complex issues relating to poverty, equality, education, technology, policy, energy, food, water, and climate? Read more on the Rethink.earth website
This article is excerpted from an article on the Rethink.earth website. It gives the views of the author, and not the position of the Nexus blog, nor of the International Institute for Applied Systems Analysis.
*The Stockholm Resilience Centre is one of the founding partners of The World in 2050 alongside the Sustainable Development Solutions Network and IIASA. Contributing organisations include the European Commission, Future Earth, Netherlands Environmental Assessment Agency, Potsdam Institute for Climate Impact Research, Future Earth. Check out the website for details.
References
Apr 10, 2017 | Energy & Climate
By Piera Patrizio, IIASA Ecosystems Services and Management Program
Biogas–renewable fuel that can be produced from a variety of natural materials including manure, food waste, plant matter, and other organic matter–has the potential to solve a number of environmental challenges simultaneously: It can reduce the emissions of greenhouse gases such as methane (for example, from manure storage) and is the only mature type of renewable energy that can be directly used in electric power generation, heat generation, and transport sectors, and it leads to reduced impacts of pollution from waste disposal.

Biogas can be produced from crops like maize as well as waste and ohter organic materials © Giuliano Del Moretto | Shutterstock
However, biogas is not without impacts of its own. The environmental benefit of using agricultural biogas in particular may be smaller than previously thought, because of the farming activities required for the production of suitable biogas feedstock (such as maize, wheat and triticale), which in turn generates local airborne pollution. Such factors are not adequately reflected in current energy measures.
In other words, existing policy instruments that have been adopted so far in Europe do not reflect the environmental impact associated with the production of certain biofuels because they do not account for other relevant environmental burdens generated along the supply chain.
This is especially the case for biogas, whose production contributes to several environmental burdens such as land use, traffic, and local emissions from the intensive use of fertilizers.
To overcome this issue, my colleagues and I have proposed the adoption of a monetization procedure through which the so-called external costs are incorporated in energy wholesale prices. This method, allows to allocate a cost to the environmental damage associated with emissions of a wide range of pollutants, which can be consequently incorporated in any economic optimization model.

Biogas production plant, Italy © Roberto Lo Savio | Shutterstock
In a new study, which I conducted with Sylvain Leduc and Florian Kraxner, we took a look at the biogas situation in my home country, Italy. We incorporated the total internal and external costs of different biogas utilization pathways in the BeWhere model—a model used for optimizing renewable energy systems–and compared with the performance of the current Italian energy mix.
We found out that, although each type of biogas leads to reduced CO2 emissions compared to fossil fuels, such environmental benefits are sharply reduced when we take other pollutant emissions into account. .
In particular, farming activities generate high non-carbon emissions such as nitrogen oxides (NOx), sulfur dioxide, and particles. Most of this pollution comes from chemical fertilizers and diesel combustion in farming activities–and these emissions corresponding to almost 6% of the energy content of the raw biogas produced.
The second cause of external costs is transportation of the biomass, which mainly produces local emissions of NOx. Local concerns about this issue, are a main source of opposition to new plants, and based on our study, these concerns appear reasonable.
Our results suggest that carbon emission mitigation alone is not always a satisfactory measure to evaluate the sustainability of biogas technologies in order to define energy policies. Other environmental burdens need to be considered when we discuss the environmental sustainability of energy production processes.
Reference
Patrizio P, Leduc S, Chinese D, & Kraxner F (2017). Internalizing the external costs of biogas supply chains in the Italian energy sector. Energy 125: 85–96
This article gives the views of the author, and not the position of the Nexus blog, nor of the International Institute for Applied Systems Analysis.
Feb 27, 2017 | Postdoc, Risk and resilience
By Adam French – Peter E. de Jánosi Postdoctoral Scholar Risk and Resilience and Advanced Systems Analysis Programs
In mid-January, I found myself calling upon rusty rock climbing skills to scramble up a steep side canyon of Peru’s Rimac River valley. I was with a group of engineers and local municipal officials on the way to assess disaster reduction infrastructure that had been installed in early 2016 against the threat of a strong El Niño-enhanced rainy season. The Swiss-made barriers we were going to see, which resembled giant steel spider webs stretched across the streambeds, had been constructed in multiple locations in the Rimac watershed to reduce the destructive impacts of the region’s recurrent but unpredictable huaicos—powerful debris flows that form when precipitation runoff mixes with loose rock and other material on unstable slopes. The 2015-16 El Niño did not live up to its forecasted intensity in Peru, and the barriers went untested until heavy rains in early 2017 unleashed a series of huaicos on the Rimac valley, damaging homes and flooding roadways. Where the barriers were installed, however, no major impacts had been reported, and we were eager to see if the infrastructure had made a difference.
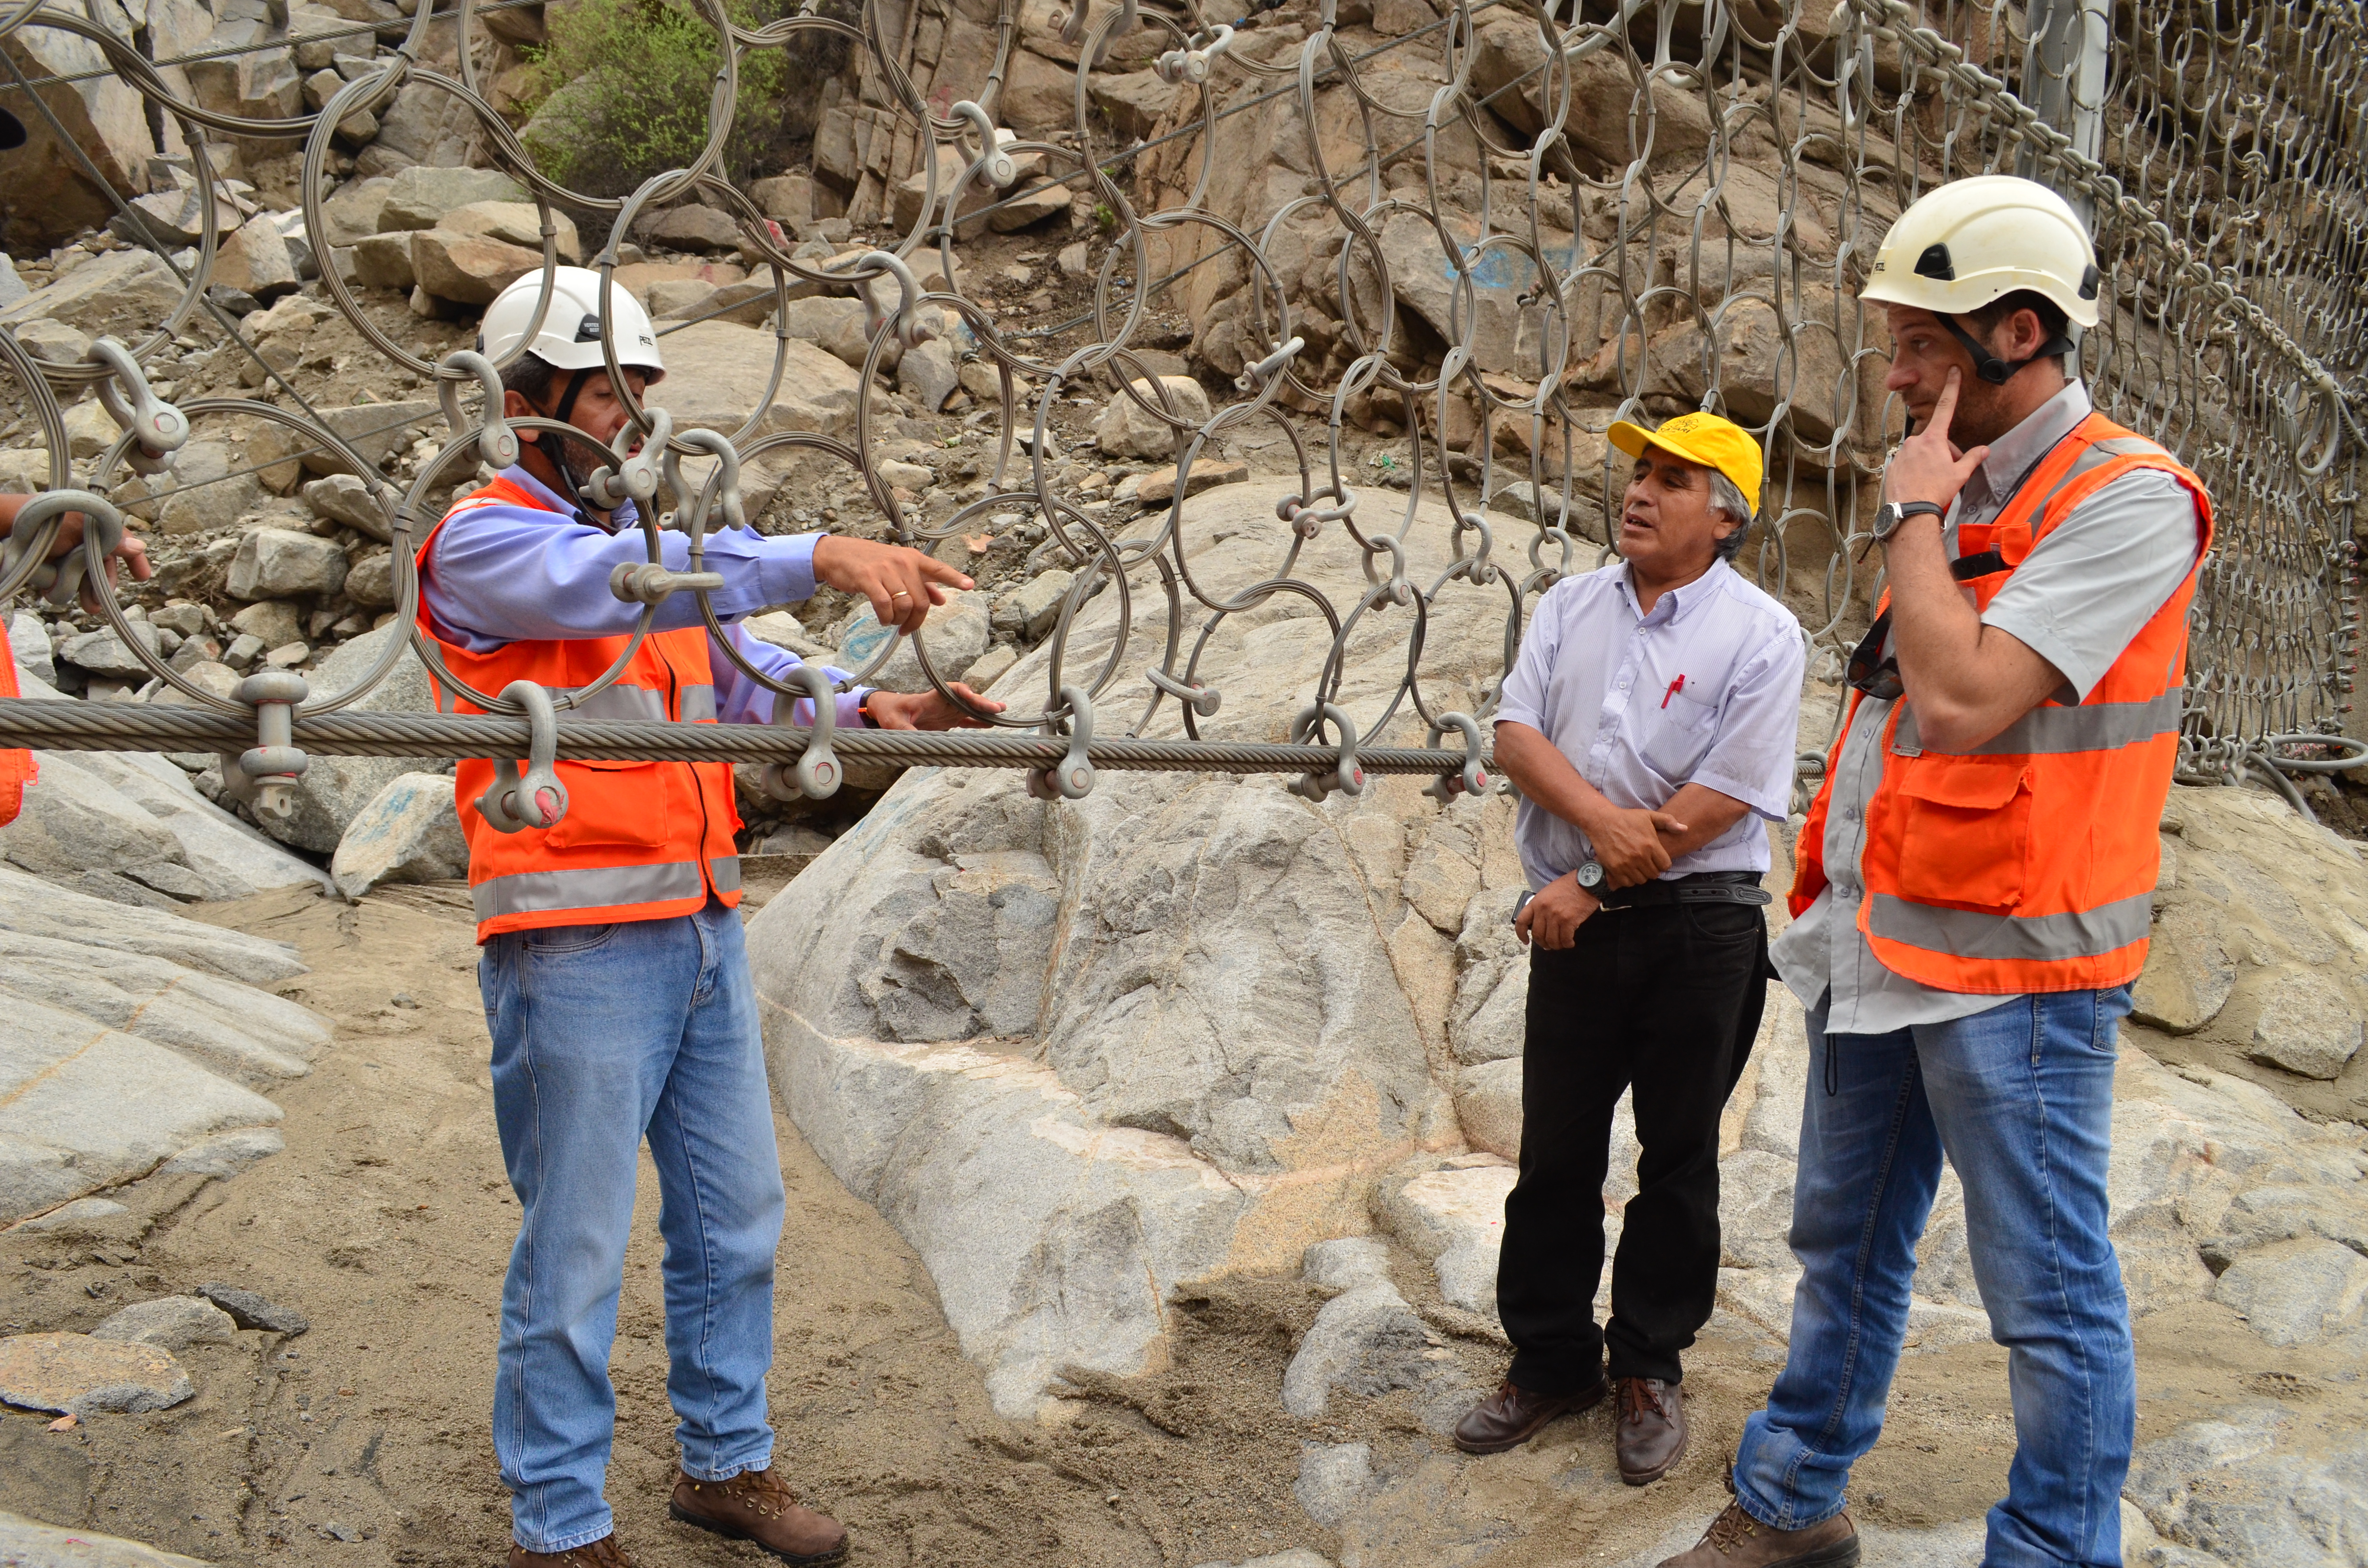
Engineers discuss hazard reduction infrastructure above Chosica, Peru. ©Soluciones Prácticas, Abel Cisneros (Click for more photos)
Most of the time, the Rimac valley looks more like a lunar landscape than a flood-risk hotspot. Yet with only a few millimeters of rain in the surrounding highlands, this arid region becomes extremely vulnerable to huaicos. Located between the sprawling cityscape of Lima—the planet’s second largest desert city—and the lush foothills of the central Andes, the middle reaches of the Rimac watershed have been settled rapidly over recent decades, often without effective zoning regulations to restrict occupation in even the most hazard-prone areas.
I had not planned to work in the Rimac basin when I moved to Austria to take up a postdoctoral position in late 2015. While my research includes the study of climate change-related risk in Peru’s Cordillera Blanca (the world’s most extensively glaciated tropical mountain range), I came to IIASA to focus on watershed-level governance and the implementation of the Integrated Water Resource Management (IWRM) paradigm. Yet as a Spanish speaker with extensive experience in Peru, I was well suited to get involved in IIASA’s activities in the Rimac valley as part of the Zurich Flood Resilience Alliance Project. This project, which includes close collaboration with the NGO Practical Action in Peru and Nepal, supports measures to understand and address the underlying drivers of flood risk and to move beyond short-term disaster preparedness and response towards transformative actions that build long-term capacity and resilience.
As part of IIASA’s Flood Resilience team, my work in the Rimac valley has included activities ranging from evaluating El Niño preparations to conducting interviews with public authorities and local residents living in the Rimac basin. This fieldwork is just part of our project’s efforts to identify the systemic components of flood risk and vulnerability in the region and to promote productive exchanges between residents, policymakers, and the scientific community through participatory research and innovative approaches such as serious gaming.
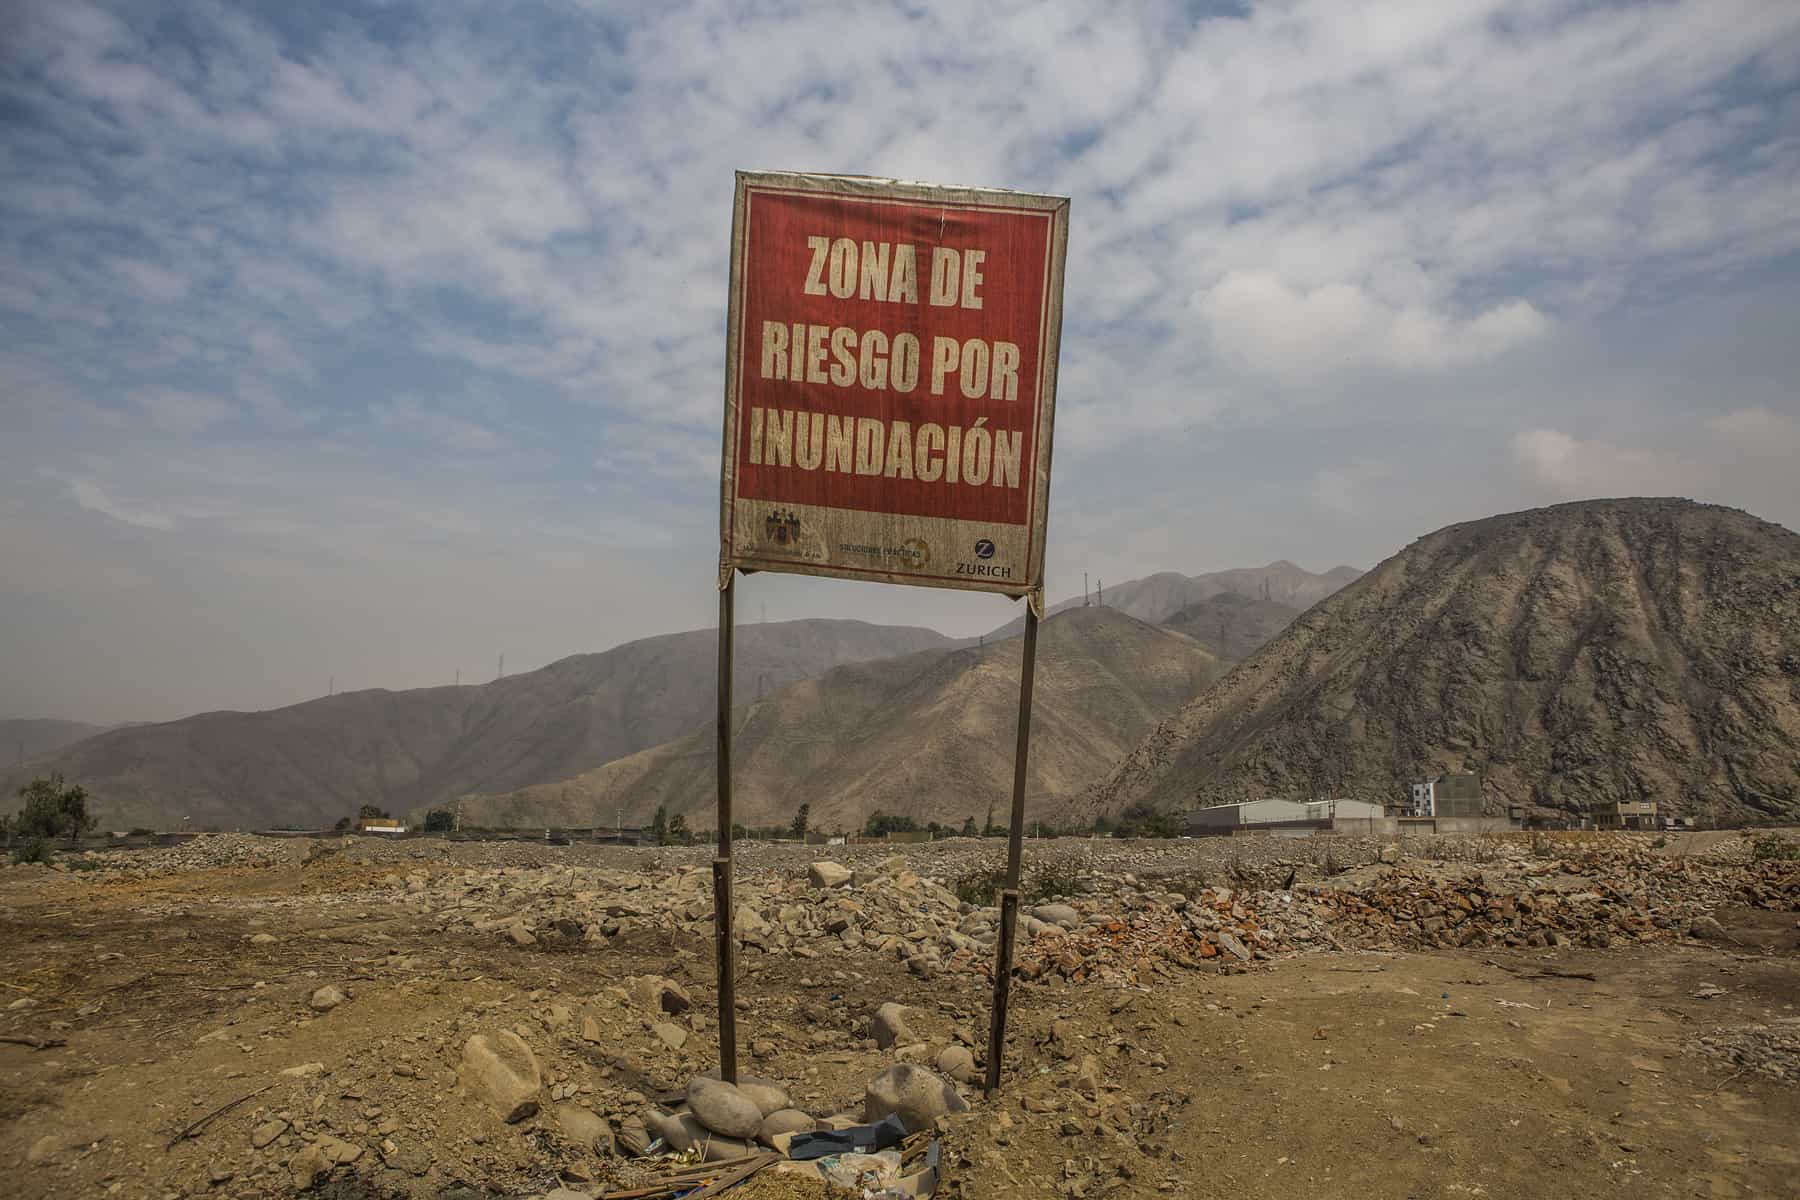
“Flood Risk Zone,” Ate, Peru. ©Soluciones Prácticas. Click for more photos.
In addition to building expertise in a new setting, my involvement in this work has helped me better incorporate risk-focused systems thinking into my broader research agenda—a perspective that is too often overlooked in integrated resource planning. An example of how my research interests are converging within this project is through the promotion of a risk-management working group to advise the multi-sectorial watershed council in charge of IWRM planning in the Rimac valley. The establishment of this working group and the participation of project partners at Practical Action in its activities should mark an important step in bringing lessons from the Flood Resilience project regarding links between disaster risk reduction, economic development, and community resilience to bear on watershed planning in the Rimac basin. More broadly, we hope these insights will influence policy making in other settings in Peru and beyond that face similar challenges in handling risk management and economic development as intricately linked and co-dependent governance processes.
Returning to our January field inspection, we found that one of the new barriers had been put to the test. The structure had captured several tons of debris, protecting a neighborhood that had been devastated by a huaico in 2015, and local authorities were already discussing the potential to build additional barriers to guard their community. While I celebrated this outcome with them, as I look to the future and the goals of the Flood Resilience Alliance, I am hopeful that such infrastructural interventions will be just one aspect of comprehensive plans for hazard reduction, with long-term risk management actions increasingly seen as a vital component of watershed-level planning and governance.
More information
IIASA, Zurich, Wharton, Practical Action: Flood Resilience Partnership
Flickr photo album: Rimac River valley, Peru – Fieldwork
Flood Resilience Portal
This article gives the views of the author, and not the position of the Nexus blog, nor of the International Institute for Applied Systems Analysis.
Feb 14, 2017 | Demography
By Samir KC, IIASA World Population Program
In 2011, the last decadal census of Nepal counted more than 26.5 million people, plus about 2 million “absentee” Nepalese working abroad. The census revealed a population that is on the move, a rapidly declining number of births, and a high degree of population heterogeneity between the different areas of Nepal. The increasing complexity in the demographic dynamics is making it difficult for Nepal’s government to plan future policies and allocate budgets. That’s why at IIASA in collaboration with Ministry of Health of Nepal, we recently projected the Nepalese population up to 2031 by age and sex for 75 districts as well as more than 4000 villages and municipalities.
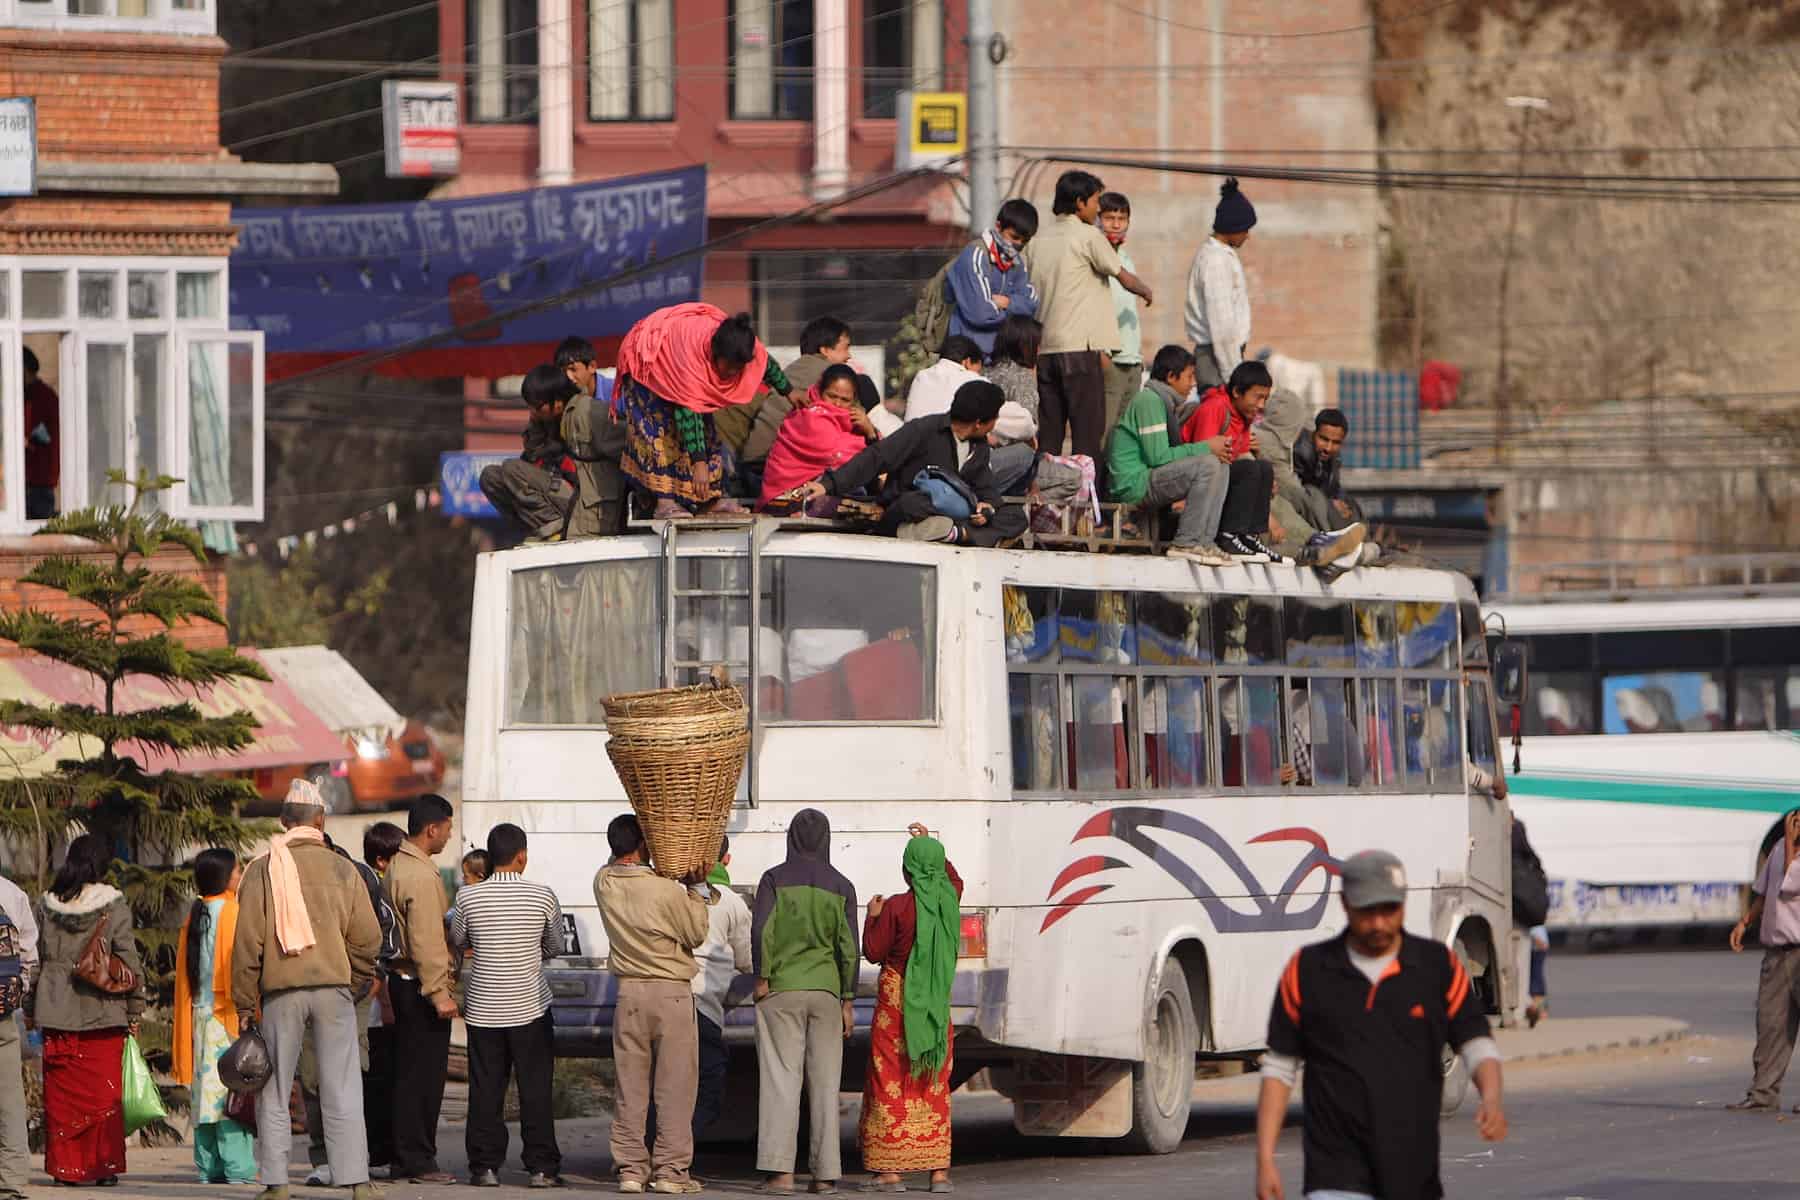
Passengers on a bus in Nepal. The country is seeing large amounts of migration both within and outside of the country. ©AusAID
Our projections show that the population of Nepal will continue to increase, albeit at a slow rate from, 26.5 million today to 34.2 million in 2031, and the age structure will continue to grow older. We found that demographic behaviors differ largely by geographic area within Nepal, and highly correlates with the inequalities in terms of development and opportunities. For example, the fertility level in the Mid-Western Hills and Mountain region were very high compared to the rest of the country.
Since 1959, Nepal has had an aggressive but non-mandatory family planning policy with a message to limit family size to two children, but this policy will be soon ending as the overall fertility is approaching the benchmark in most parts of the country. Our study projects that the number of children born, which has been declining in the past 10-15 years, will stabilize with some fluctuation due to larger cohort of women entering the reproductive ages. In the past, the declining number of births lowered the burden in universalizing health coverage. The study suggests that now the government should channel its resources where needed and the nationwide focus should be more on improving the quality of reproductive services rather than telling people how many children they should have.
A stream of migration
Our analysis shows that for Nepal, the future population dynamics are likely to be influenced in large part by migration, both within and outside of the country. We found that especially in the hill and mountain districts of Nepal, depopulation is occurring as people move away. Because of the Maoist conflict during 1996-2006 and its impact on all aspects of life, young Nepali males began leaving their homes to find safer areas and better employment opportunities, often in Arab and Southeast Asian countries. This in turn might have affected the fertility rates as well as increased internal migration of the dependents (of the migrants made possible by the flow of remittance) from less developed to more developed areas within Nepal.
In recent times, women have joined the migration stream, and are likely to be a major force in lowering the fertility rate in Nepal. If the trend continues, a large part of the mountains and hills is likely to depopulate and the political and socioeconomic consequences of such phenomenon should be studied.
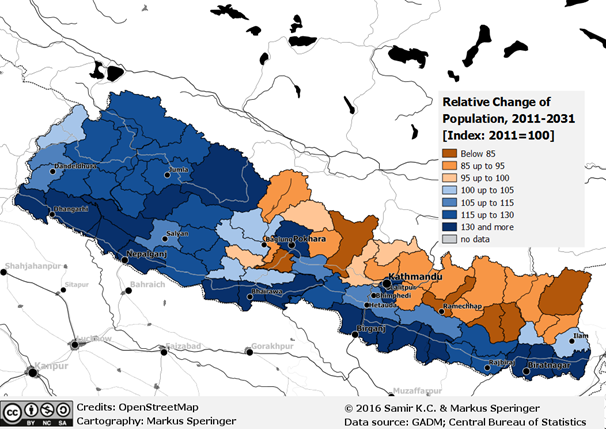
Projected population change in Nepal in 2031 compared to 2011. ©Samir KC & Markus Speringer
Our projections show that the country should expect a huge number of this absentee population to return. The young men and women in their 20s and 30s who have left the country to work in Arab and Asian countries will have to return in their 40s and 50s due to strict rules regulating labor migration in these countries, the labor intensive jobs might not suit their age, and to finally reunite with the family back home. They could be forced to return even sooner if the economic situation in these countries is adversely affected by regional or global recession or conflict, price of oil etc. However, questions remain about how the return process will unfold, where people they return to, and what its impact on the society and the nation would be.
We think that the data and the population model, and the projection that we developed for Nepal could be very useful in many ways, for example in population, environment, economics, social transformation, sustainable development, and other areas. However, we need more data and projections and the possibility to run alternative scenarios, and to do this, demographers, population experts, and governmental institutions should collaborate. One such collaborative initiative is currently underway at the Shanghai University, where I have recently started to develop such a model in 11 countries in Asia, including Nepal. Once the base population model is ready, adding further layers representing the wellbeing of the population will be the next step.
Reference
KC S, Speringer M, Thapa A, & Khanal MN (2016). Projecting Nepal’s Demographic Future- How to deal with spatial and demographic heterogeneity. IIASA Working Paper. IIASA, Laxenburg, Austria: WP-16-021 http://pure.iiasa.ac.at/14029/
This article gives the views of the author, and not the position of the Nexus blog, nor of the International Institute for Applied Systems Analysis.
Feb 8, 2017 | Risk and resilience
By Junko Mochizuki Research Scholar, Risk and Resilience Program
After a 9.0 magnitude earthquake and subsequent tsunamis struck the northeast of Japan on March 11, 2011, large-scale destruction of the coastal communities, including nuclear accidents, turned into a political maelstrom. Debates over the country’s alternative energy futures became intense; worries over ailing energy infrastructure, public safety, and the lack of transparency and accountability led to the most extensive restructuring of its power sector in the country’s recent history.
Against this backdrop, renewable energy was heralded as one of the important solutions: A new nation-wide Feed-in-Tariff (FIT) was introduced in July 2012, replacing the Renewable Portfolio Standard (RPS), which many had perceived, until then, as largely inadequate.
Nearly six years have passed since. Japan’s reconstruction, originally envisioned to last for 10 years, is now in its latter phase. The coastal communities are slowing recovering, with many focused on the idea of ”building back better.” We now hear less about the country’s energy future in the national and international media. But less documented is how well these communities are performing in terms of the ambitious reconstruction plans that they had proposed.

The 2011 earthquake, tsunami, and nuclear disaster led to major destruction in Northeast Japan. But did it also bring an opportunity to “build back better?” ©mTaira | Shutterstock
This was the context in which my colleague Stephanie E. Chang and I began our research titled Disaster as Opportunity for Change, recently published in the International Journal of Disaster Risk Reduction. We evaluated renewable energy transition trends in the 30 coastal communities in Tohoku, Japan from 2012-2015. We focused on energy transition as one measurable dimension of ”building back better (BBB),“ because this is a popular concept that is often talked about, but rarely analyzed through empirical modelling.
In this study, we sought to answer three simple questions. First, are the disaster-affected regions really “building back better?” Have they introduced more renewable energy than the rest of Japan?. Second, why did some communities achieved greater renewable energy transition than others during recovery? Third, what was the role of government policy? We were interested in answering these questions through quantitative analysis, instead of an in-depth case study, since such in-depth analyses are rare in the field of disaster recovery.
In a reconstruction study, we typically need about 10 or more years to make major conclusions. Since we did our study in year six, this study doesn’t provide the final answer, but rather whether the disaster led to opportunity to build back better.
Our research indicated some clues in answering the above three questions, but many puzzles remain. First, it was clear that the disaster-affected regions achieved a greater transition to renewable energy, particularly in both small and mega-solar adoption. Other renewables including wind and geothermal are lagging due to many factors such as more complex approval processes. We focused our analysis on energy transition, measured in terms of per capita approved renewable capacity, as opposed to indicators such as installed capacity or power generated, since the latter depend on many factors such as the readiness of grid systems in accommodating intermittent renewables.
We also found that the relationship between a transition to renewable energy and the extent of disaster damage, and other post-disaster changes such as number of houses being relocated, appears to be non-linear. This means that the destruction caused by disasters, and subsequent decisions to relocate population, provided at least some momentum for wider societal change. Clearly, when communities experience very large destruction or extensive change such as land-use adjustment, this can overwhelm the local capacity to implement broader changes such as major investments in renewable energy. Balancing competing reconstruction demands is, therefore, an important policy question that must be dealt with, most ideally, prior to any large-scale disasters.
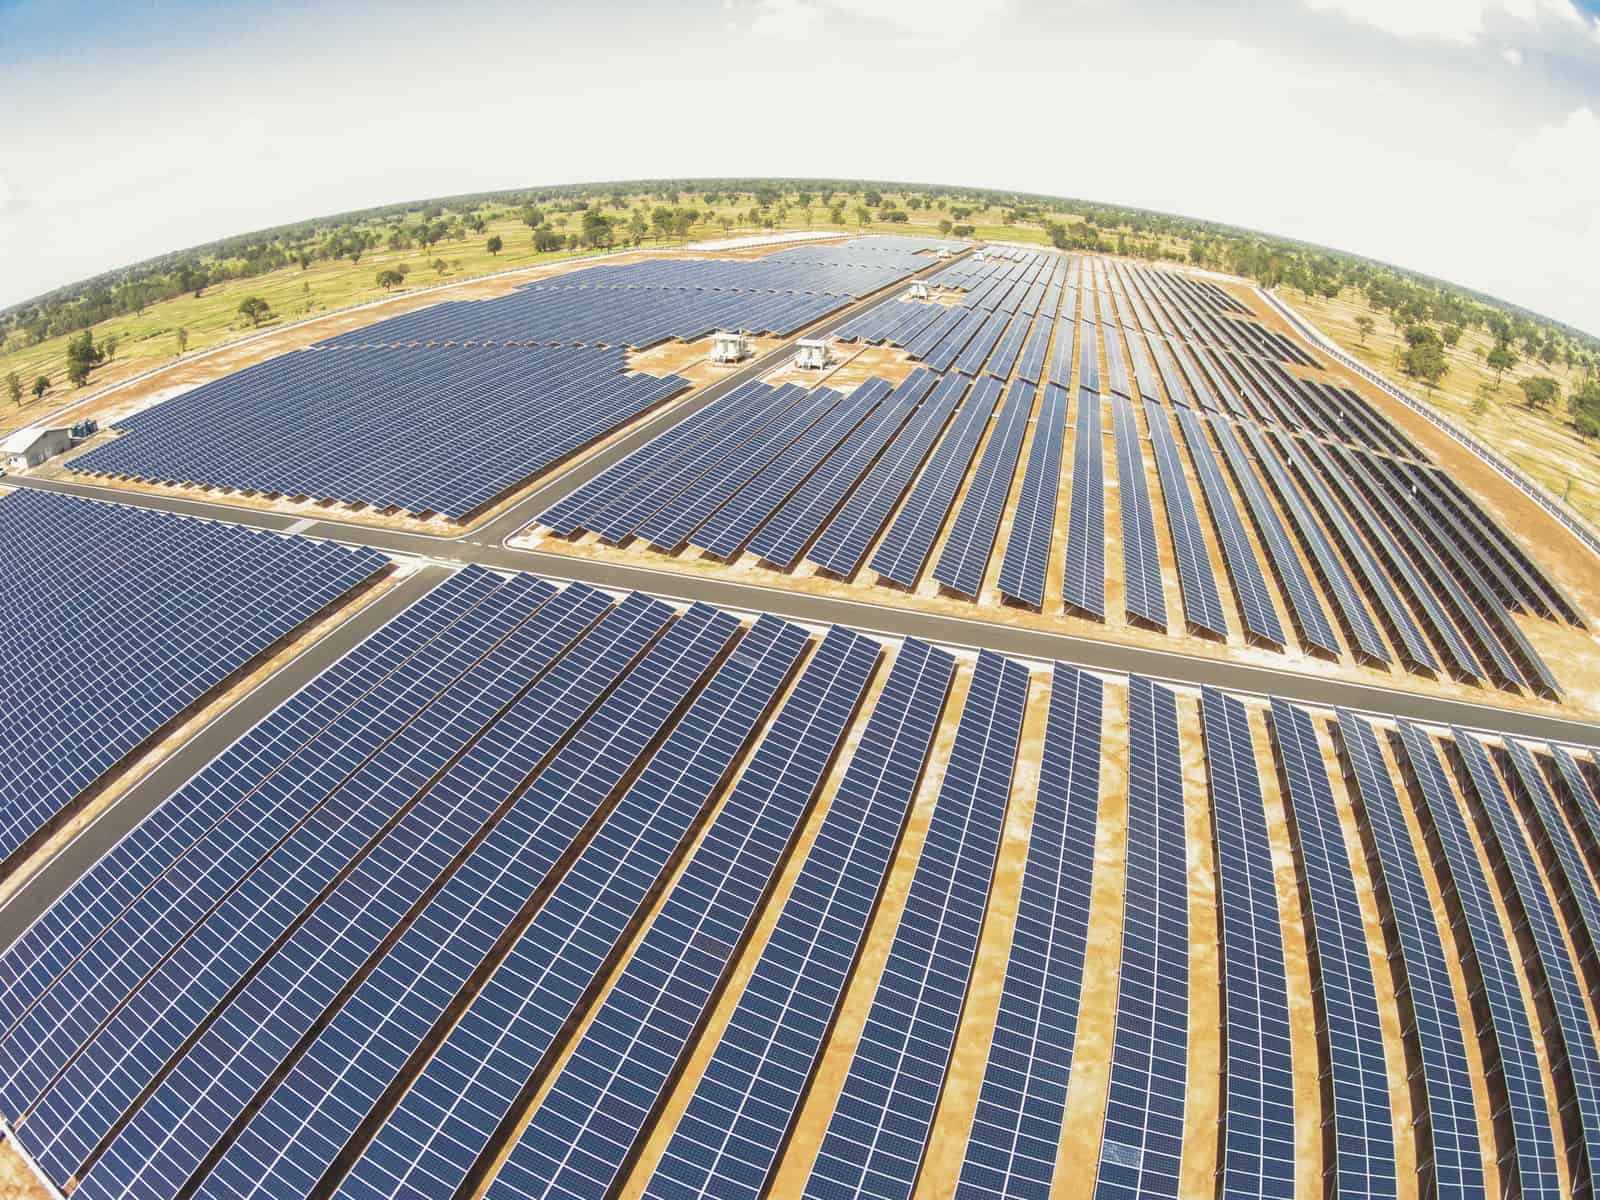
Japan is building mega solar installations like this one in the region affected by the tsunami and earthquake ©SE_WO | Shutterstock
Third, our results remain somewhat inconclusive as to the contribution of government policy. Counter-intuitively, communities having renewable energy plans prior to 2011 adopted significantly less solar energy after the Tohoku disaster. Statistical modeling such as ours tells little about how different aspects of national and prefectural policies have fostered or hindered local energy transitions and these are better answered through other means such as in-depth interviews.
Overall, we find potentially complex drivers of “building back better” and we hope that this study motivates further systematic studies of societal change in the context of post-disaster reconstruction. Of course, a better articulation of what policies work in promoting change and why will also help foster the sustainability transition even without the impetus of a disaster.
Reference
Mochizuki J & Chang S (2017). Disasters as Opportunity for Change: Tsunami Recovery and Energy Transition in Japan. International Journal of Disaster Risk Reduction DOI:10.1016/j.ijdrr.2017.01.009. (In Press)
This article gives the views of the author, and not the position of the Nexus blog, nor of the International Institute for Applied Systems Analysis.
You must be logged in to post a comment.