Jul 15, 2016 | Alumni, Climate, Climate Change, Young Scientists
César Terrer, participant in the IIASA 2016 Young Scientists Summer Program, and PhD student at Imperial College London, recently made a groundbreaking contribution to the way scientists think about climate change and the CO2 fertilization effect. In this interview he discusses his research, his first publication in Science, and his summer project at IIASA.
Conducted and edited by Anneke Brand, IIASA science communication intern 2016.

César Terrer ©Vilma Sandström
How did your scientific career evolve into climate change and ecosystem ecology?
I studied environmental science in Spain and then I went to Australia, where I started working on free-air CO2 enrichment, or FACE experiments. These are very fancy experiments where you fumigate a forest with CO2 to see if the trees grow faster. In 2014 I moved to London for my PhD project. There, instead of focusing on one single FACE experiment, I collected data from all of them. This allowed me to make general conclusions on a global scale rather than a single forest.
You recently published a paper in Science magazine. Could you summarize the main findings?
We found that we can predict how much CO2 plants transfer into growth through the CO2 fertilization effect, based on two variables—nitrogen availability and the type of mycorrhizal, or fungal, association that the plants have. The impact of the type of mycorrhizae has never been tested on a global scale—and we found that it is huge. I think it’s fascinating that such tiny organisms play such a big role at a global scale on something as important as the terrestrial capacity of CO2 uptake.
How did you come up with the idea? One random day in the shower?
Long story short, researchers used to think that plants will grow faster, and take up a lot of the CO2 we emit. They assumed this in most of their models as well. But plants need other elements to grow besides CO2. In particular, they need nitrogen. So scientists started to question whether the modeled predictions overestimated the CO2 fertilization effect, because the models did not consider nitrogen limitation. To find out, I analyzed all the FACE experiments and indeed I saw that in general plants were not able to grow faster under elevated CO2 and nitrogen limitation. However, in some cases plants were able to take advantage of elevated CO2 even under nitrogen limitation. I grouped together the experiments where plants could grow under nitrogen limitation and after a lot of reading I saw what they had in common: the type of fungi! It turned out that one type of mycorrhizae is really good at transferring large quantities of nitrogen to the plant and the other type is not.
How did that feel?
Awesome! When I saw the graph, I knew: this is going to be important. Of course, after this, my coauthors helped me to polish the story. Without them, the conclusions would not be as robust and clear.
So how does this process work? Where do the fungi get the nitrogen from?
Particular soils might have a lot of nitrogen, but the amount available for plants to absorb might be low. Also, plants have to compete with non-fungal microorganisms for nitrogen. So if there is not much there, the microorganisms take it all. It’s called immobilization. Instead of mineralizing nitrogen, they immobilize it so that plants cannot take it up, at least not in the short term. Some types of fungi are much more efficient in accessing nitrogen, and associated with roots they allow plants to overcome limitations.
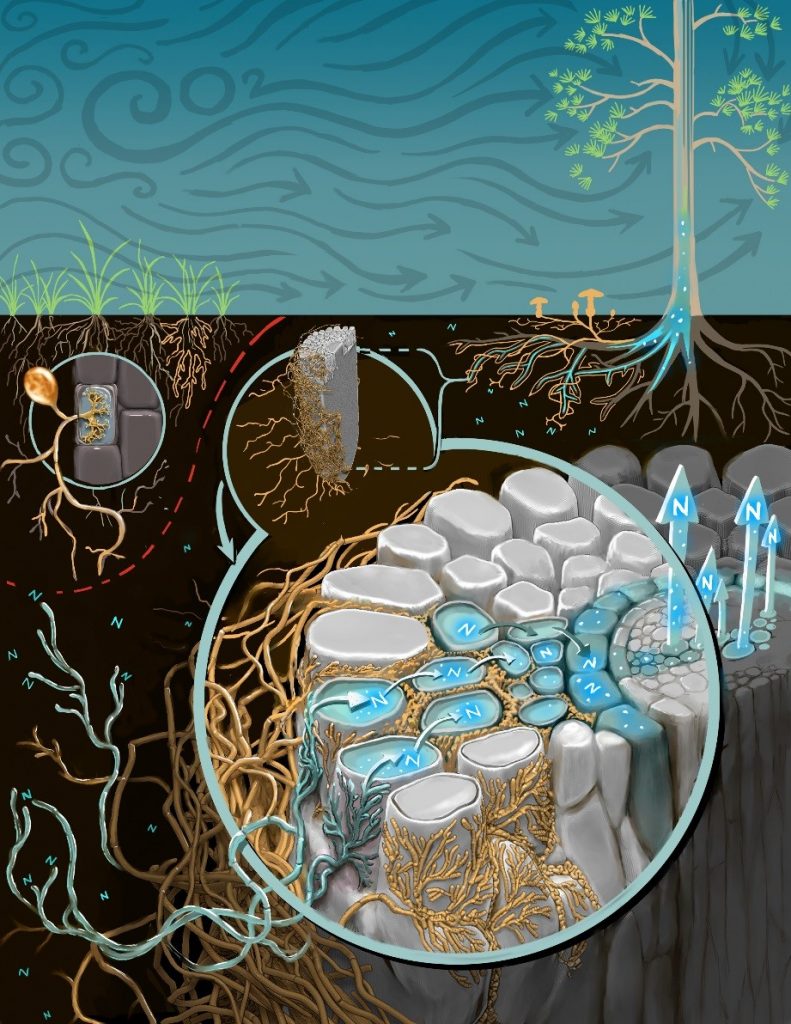
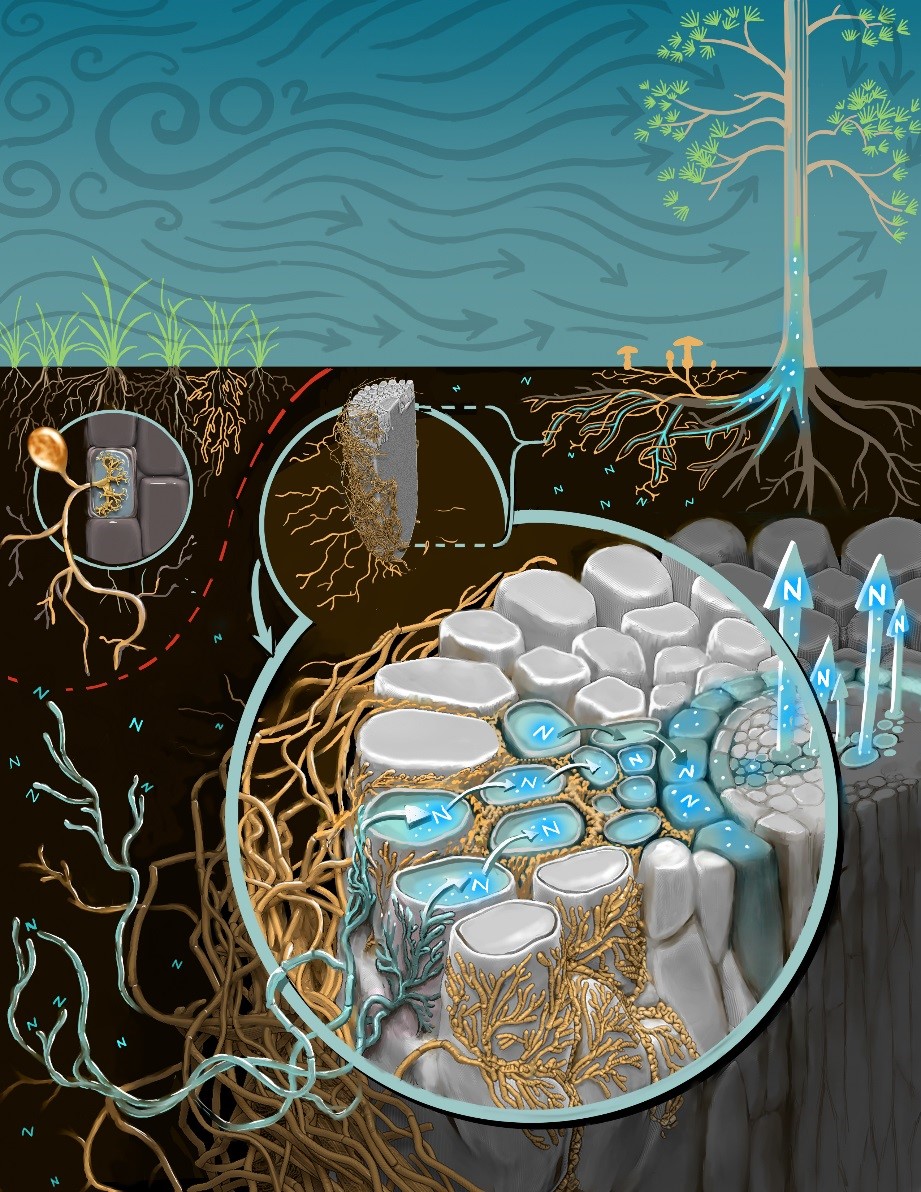
Nitrogen mobilization abilities of different types of fungi. Growth of plants associated with fungi not beneficial for nitrogen uptake (illustrated as grass roots on the left) could be limited by low nitrogen availability in soil. Other plants have the advantage of increased nitrogen uptake due to their beneficial association with certain types of fungi (illustrated as yellow mushrooms connected to the roots of the tree on the right). ©Victor O. Leshyk.
What is the impact of your findings?
Plants currently take up 25-30% of the CO2 we emit, but the question is whether they will be able to continue to do so in the long term. Our findings bring good and bad news. On the one hand, the CO2 fertilization effect will not be limited entirely by nitrogen, because some of the plants will be able to overcome nitrogen limitation through their root fungi. But on the other hand, some plant species will not be able to overcome nitrogen limitation.
There was a big debate about this. One group of scientists believed that plants will continue to take up CO2 and the other group said that plants will be limited by nitrogen availability. These were two very contrasting hypotheses. We discovered that neither of the hypotheses was completely right, but both were partly true, depending on the type of fungi. Our results could bring closure to this debate. We can now make more accurate predictions about global warming.
What will you do at IIASA and how will you link it to your PhD?
I want to upscale and quantify how much carbon plants will take up in the future. If we are to predict the capacity of plants to absorb CO2, we need to quantify mycorrhizal distribution and nitrogen availability on a global scale. We are updating mycorrhizal distribution maps according to distribution of plant species. We know for instance that pines are associated with ectomycorrhizal fungi and always will be. To quantify nitrogen availability we use maps of different soil parameters that are available on a rough global scale.
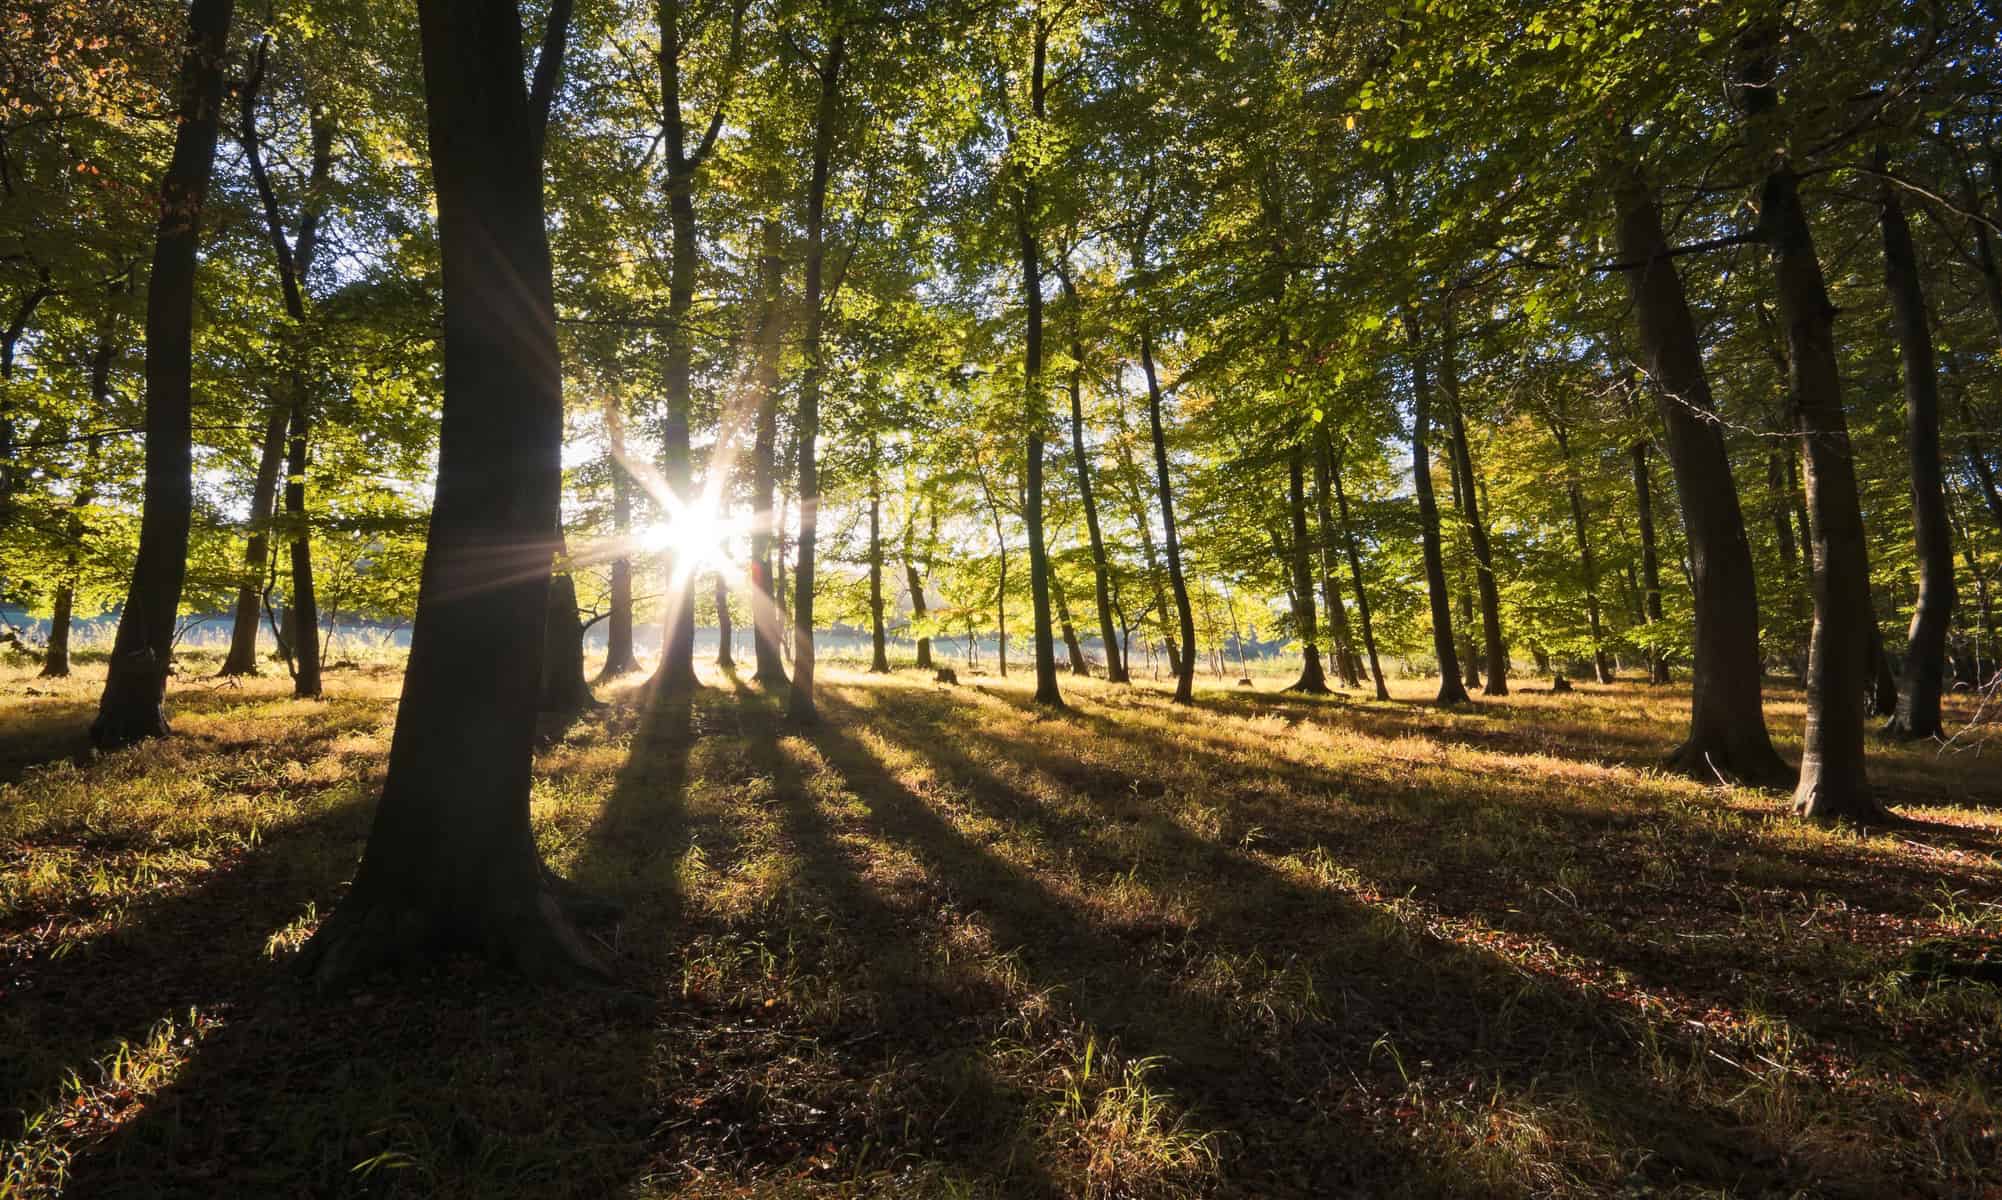
© Adam Edwards | Dreamstime.com
About César Terrer
Prior to his PhD, Terrer studied at the University of Murcia in Spain and the University of Western Sydney in Australia.
Currently he is a member of the Department of Life Sciences at Imperial College London, UK. For this study he collaborated with researchers from the University of Antwerp, Northern Arizona University, Indiana University and Macquarie University.
In the IIASA Young Scientists Summer Program, Terrer works together with Oskar Franklin from the Ecosystem Services and Management Program and Christina Kaiser from the Evolution and Ecology Program.
Further reading
Note: This article gives the views of the interviewee, and not the position of the Nexus blog, nor of the International Institute for Applied Systems Analysis.
May 17, 2016 | Citizen Science
By Dilek Fraisl, IIASA Ecosystems Services and Management Program
In October 2015, we launched our latest game, Picture Pile. The idea is simple: look at a pair of satellite images from different years and tell us if you can see any evidence of deforestation. Thanks to the participation of many volunteers, 2.69 million pictures have already been sorted in our pile of 5 million pairs. But we still have a long way to go, and we need your help to get us there!
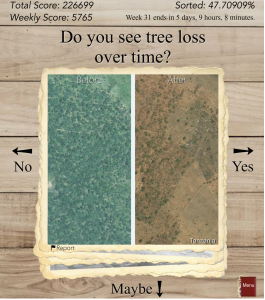
Screenshot from the game: click for more information (Image credit Tobias Sturn)
Deforestation is one of the most serious environmental problems in the world today. Forests cover a third of the land area on Earth, producing vital oxygen, habitats for a diversity of wildlife, and important ecosystem services. According to the World Wildlife Fund (WWF), some 46,000 to 58,000 square miles of forest are lost each year, which is equivalent to 48 football fields every minute. But this is a rough estimate since deforestation is very difficult to track. Reasons why are that satellite imagery can be of insufficient spatial resolution to map deforestation accurately, deforestation mostly occurs in small chunks that may not be visible from medium-resolution imagery, and very high-resolution data sets are expensive and can require big data processing capabilities, so can only be used for limited areas.
To help contribute to better mapping of deforestation, researchers in IIASA’s Earth Observation Systems (EOS) group, led by Steffen Fritz, have been working on novel projects to engage citizens in scientific data collection that can complement satellite-based traditional deforestation monitoring. One of the latest applications is Picture Pile, a game that makes use of very high-resolution satellite images spanning the last decade. Designed by Tobias Sturn, the aim is to provide data that can help researchers build a better map of deforestation. Players are provided with a pair of images that span two time periods and are then asked to answer a simple question: “Do you see tree loss over time?” After examining the image, the player drags the images to the right for “yes,” left for “no,” or down to indicate “maybe” when the deforestation is not clearly visible.
Every image is sorted multiple times by numerous independent players, in order to build confidence in the results, and also to gain an understanding of how good the players are at recognizing visible patterns of deforestation. Once enough data are collected at a single location, the images are taken out of the game and new ones are added, thereby increasing the spatial coverage of our mapped area over time. Right now we are focusing on Tanzania and Indonesia, two regions where we know there are problems with existing maps of deforestation.
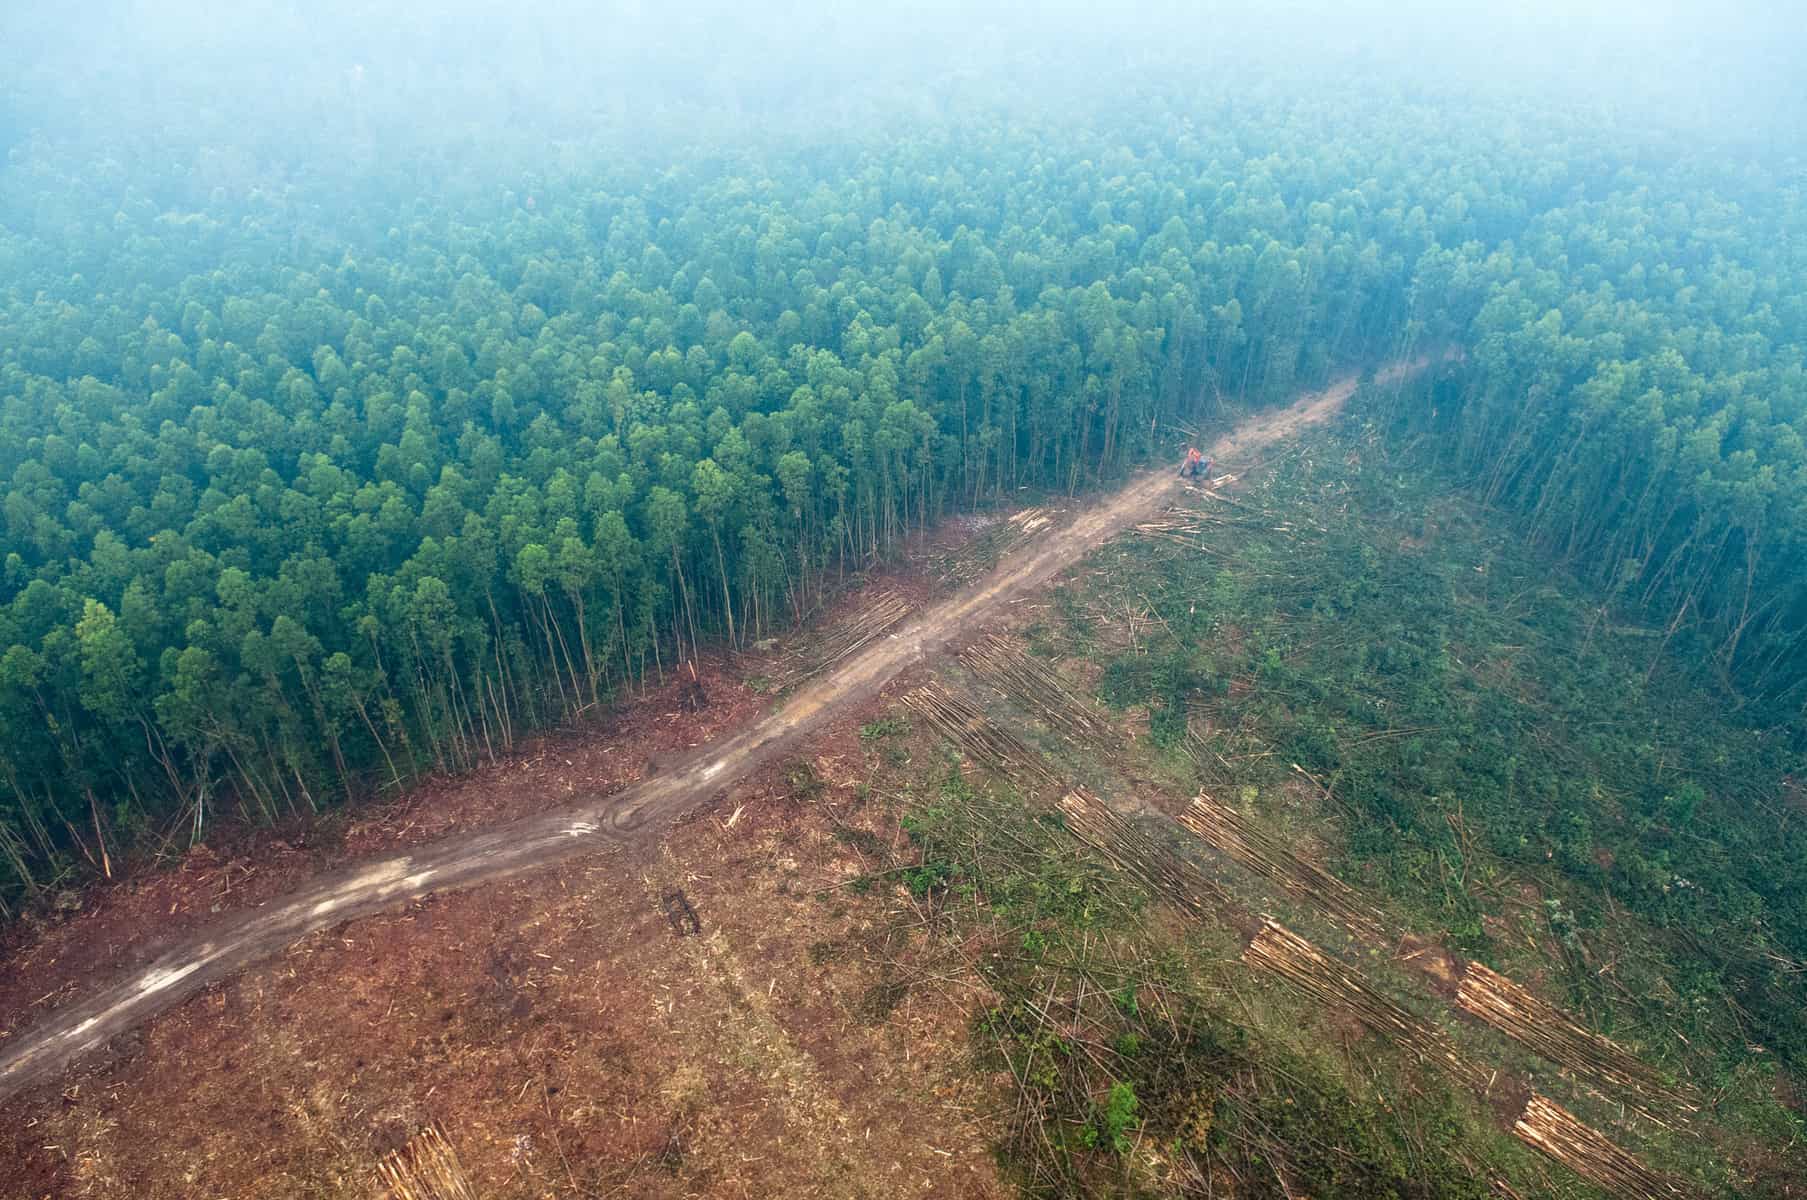
Picture Pile is focusing first on Indonesia (pictured) and Tanzania – two regions where there are problems with existing maps of deforestation. Photo (cc) Aulia Erlangga for Center for International Forestry Research (CIFOR).
Once the pile is fully sorted, the 5 million photos in the data set will be used to develop better maps of forest cover and forest loss using hybrid techniques developed by the group as well as inputs to classification algorithms. We will also use the data to validate the accuracy of existing global land cover maps. Finally, we will mine the data set to look for patterns regarding quality (for example, how many samples do we need to provide to the “crowd” before we can be confident enough to use their data in further research). In short, by integrating citizens in scientific research, Picture Pile will also help us improve the science of land cover monitoring through crowdsourcing mechanisms.
So please join in and help us get to the finish line. You can play Picture Pile in your browser or you can download the free iOS/Android app from the Apple and Google Play stores and play on your smartphone or tablet. Your contributions will help scientists like those at IIASA to tackle global problems such as deforestation and environmental degradation. At the same time you may win some great prizes: a brand new smartphone, a tablet, or a mini tablet.
More information:
Reference
Schepaschenko D, See L, Lesiv M, McCallum I, Fritz S, Salk C, Perger C, Schepaschenko M, Shvidenko A, Kovalevskyi S, Albrecht F, Kraxner F, Bun A, Maksyutov S, Sokolov A, Dürauer M, Obersteiner M. (2015) Global hybrid forest mask: synergy of remote sensing, crowd sourcing and statistics. Remote Sensing of the Environment, 162, 208-220. doi:10.1016/j.rse.2015.02.011
Note: This article gives the views of the author, and not the position of the Nexus blog, nor of the International Institute for Applied Systems Analysis.
Apr 7, 2016 | Environment
By Andrey Krasovskii, IIASA Ecosystems Services and Management Program
By 2090, the area burned by forest fires in the European Union could increase by 200% because of climate change. However, preventive fires could keep that increase to below 50%. Improved firefighting response could provide additional protection against forest fires. These findings were the result of modeling work we did for the EU Mediation project on projecting future burned areas and adaptation options in Europe. When we talk about these results, people often want to know more about how our model works, what assumptions it makes, and how reliable it is.
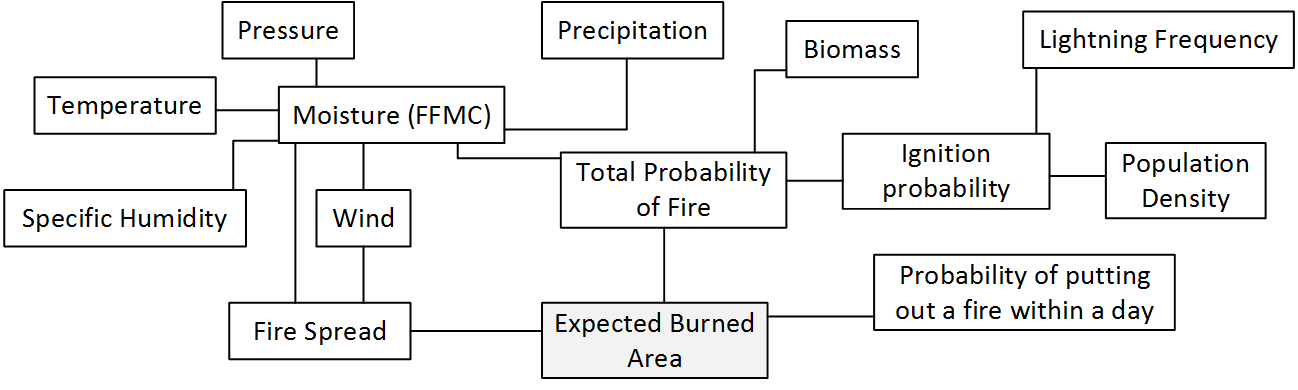
Figure 1. The WildFire cLimate impacts and Adaptation Model (FLAM) schematic – estimation of expected burned area.
The model is complex: every link in the schematic shown above represents a specific mathematical formula. These formulas have been developed by many researchers who studied how wildfire occurrence is related to climate, population, and biomass available for burning. Their results have been aggregated into mathematical relations and functions attempting to replicate real processes. The model code runs through the scheme with daily weather inputs in order to calculate the potential for fire ignition, spread, and burned areas. The model transforms spatial and intertemporal inputs into expected burned areas for 25km squares across the entirety of Europe. These squares can be summed up into geographic regions, e.g. countries, as well as burned areas can be aggregated over a given time period, e.g. 10 years.
It took days for our colleague Mirco Migliavacca to run the model during his work at the Joint Research Center of the European Commission. In fact, the scheme depicted in Figure 1 shows only a small piece of a larger picture reflecting the Community Land Model with the integrated fire module (CLM-AB), which he used. CLM-AB calculates all inputs in the indicated fire module, based on modeling processes in the global vegetation system. To speed up the running times for the case study focused on the wildfires in Europe, my colleague Nikolay Khabarov developed a standalone version of the fire model by decoupling the fire module from CLM-AB. When I joined the study, we had also found alternatives for input data, e.g. IIASA’s Global Forest Database, and implemented additional procedures in order to create our wildfire climate impacts and adaptation model (FLAM).
We used the historical data from satellite observations in order to validate modeling results. At the beginning many numerical experiments in CLM and FLAM did not give satisfactory results – there was either overestimation or underestimation of modeled burned areas compared to those reported in available datasets. One day a purely mathematical insight happened. We realized that in the fire algorithm implemented in FLAM, there is a parameter that can be factorized, mathematically speaking. This parameter, a probability of extinguishing a fire in a pixel in one day, was constant for Europe and set to 0.5. It became obvious that this parameter should vary with respect to a region. Factorization of this variable gave a possibility to avoid routine calculations, and use it for calibrating the model over a historical period. This can be done analytically by solving a corresponding polynomial equation. Analytical findings allowed us to introduce an effective calibration procedure and at the same time to estimate a firefighting efficiency on a country level. Further, using the advice of our colleagues Anatoly Shvidenko and Dmitry Schepaschenko, we have introduced adaptation options in the model, for example prescribed burnings, which firefighters use to reduce the fuel availability and, consequently, potential of a major fire.
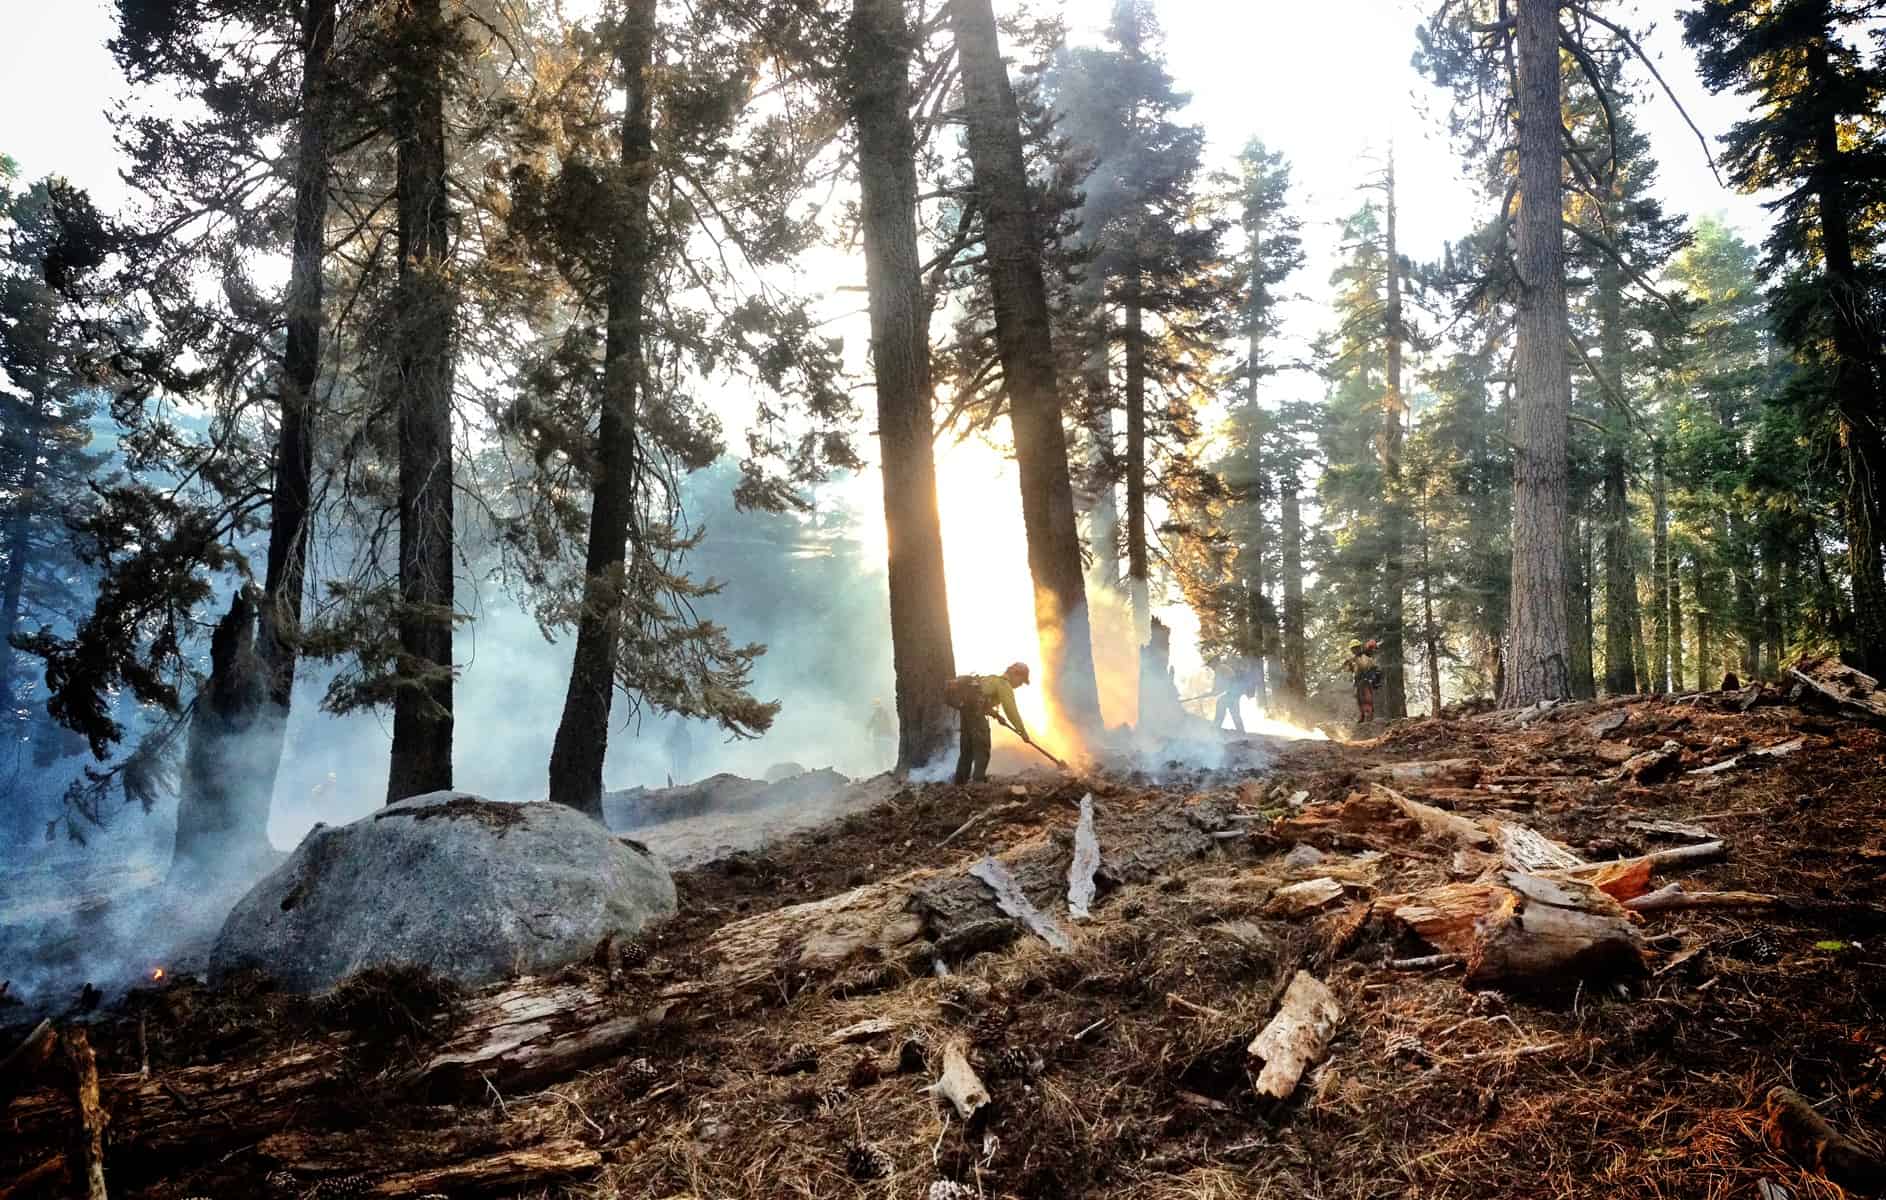
Prescribed burnings are one tool that can help prevent major wildfires. (cc) US Bureau of Land Management via Flickr
Once we had calibrated the model so that it adequately performed on the historical period (using historical climate data), we used climate scenarios to produce future projections. Currently, we are working on further improvements in modeling accuracy in annual burned areas by introducing additional regionally specific factors in the model. In the recent study published in the International Journal of Wildland Fire, we suggested improving the original model by modifying the fire probability function reflecting fuel moisture. This modification allows for a dramatic improvement of accuracy in modelled burned areas for a range of European countries.
Despite some success in modeling annual burned areas in Europe, we still have difficulties in predicting the extreme fires, in particular in some more arid and hence vulnerable regions such as Spain. However, we accept the challenge, because credible modeling results in terms of burned areas provide important information for assessing economic damages and CO2 emissions, due to climate and human activities. Our research has the potential to help society to realize these risks and undertake preventive measures. It also delivers an additional scientific value due to the fact, that fire risks must be included in forest management models.
I would like to thank all the study co-authors for their valuable contributions and efficient collaboration.
Reference
Krasovskii, A., Khabarov, N., Migliavacca, M., Kraxner, F. and Obersteiner, M. (2016) Regional aspects of modelling burned areas in Europe. International Journal of Wildland Fire. http://dx.doi.org/10.1071/WF15012
Note: This article gives the views of the interviewee, and not the position of the Nexus blog, nor of the International Institute for Applied Systems Analysis.
Oct 7, 2015 | Environment
by Stephan Pietsch, IIASA Ecosystems Services and Management Program

A solar village project in Africa hit hard times when spare parts were not available to repair the solar cells. Photo Credit: Stephan Pietsch
When we hear about cooperative efforts to preserve forests in the Southern Hemisphere, they are usually between wealthy countries in the Northern Hemisphere, which provide funding or expertise, and developing countries in the Southern Hemisphere. “Northern” solutions, however, may fail under “Southern” conditions, sometimes due to lack of access to equipment, spare parts, or maintenance expertise. Cooperation between countries within the Southern Hemisphere, or “South-South cooperation” is therefore becoming increasingly important because such cooperation allow countries to profit from others’ experiences.
That is why I recently co-organized a side event on the topic at the FAO XIV World Forestry Congress in Durban South Africa last month. The event brought together experts in the field to discuss recent successes and the current limitations of South-South cooperation in forestry, provide a forum for exchange among ongoing cooperation projects in the training, education, science, and policy sectors, and promote enhanced South-South cooperation within forestry. An excellent example of one of these success stories are the horticultural practices for agroforestry developed at the World Agroforestry Center (ICRAF), which operate without the need for sterile working environments.
The event focused not only on the role of Southern Hemisphere cooperation within the forestry sector, but also stressed interconnected issues like food security, climate change mitigation and economic development. As such, cooperation in forestry in the Southern Hemisphere may become a key vehicle for socioeconomic development and food security by integration of forests and other land uses.

Trucks carrying logs in Gunung Lumut, East Kalimantan, Indonesia.
Photo by Jan van der Ploeg for Center for International Forestry Research (CIFOR).
What makes such cooperation successful? The participants identified efforts in capacity building such as training forest-dependent people in rural communities, but also establishing value chains and marketing expertise including local businesses and policymakers to jointly cooperate for improved decision making. Using South-South cooperation to foster product innovation and sustainable trade provides us with a promising pathway for building resilience with forests: Resilience in an ecological sense, but equally well in an economic, sociological and political sense in order to ensure sustainable futures for the global South. The side event promoted such solutions to increase the visibility and impact of ongoing South-South cooperation at the local, regional, continental and global level.

Photo credit: Stephan Pietsch
Event Information
World Forestry Congress – Side Event
“The way forward via integrated South-South cooperation” with Dr. Tachrir Fathoni (Indonesia), Dr. Zacharie Tchoundjeu (Cameroon), Dr. Alexandre X. Ywata de Carvalho (Brazil), Dr. Coert Galdenhuys (South Africa) and Dr. Stephan A. Pietsch (Austria). More information.
The event was sponsored by the REDD-PAC project and is part of the IIASA Tropical Flagship Initiative.
Note: This article gives the views of the author, and not the position of the Nexus blog, nor of the International Institute for Applied Systems Analysis.
Jun 23, 2015 | Energy & Climate, Science and Policy
By Hannes Böttcher, Senior Researcher, Öko-Institut, previously in IIASA’s Ecosystem Services and Management Program
In or out? Debit or credit? The role of the land use sector in the EU climate policy still needs to be defined
The EU has a target to reduce greenhouse gas emissions by at least 40% by 2030. This is an economy-wide target and therefore includes the land use sector, which includes land use, land use change and forestry. The EU is currently in the process of deciding how to integrate land use into this target. This is not an easy task, as we show in a new study.

Land use includes activities, such as logging, that can release greenhouse gases into the atmosphere. But the sector also includes other processes that can remove greenhouse gases from the atmosphere. Accounting for these processes is a complicated task. © Souvenirpixels | Dreamstime.com
The land use sector has several particularities that make it different from other sectors already included in the target, such as energy, industrial processes, waste, and agriculture. The most specific particularity is that the sector includes activities that cause emissions but also can lead to carbon being removed from that atmosphere, and taken up and stored in vegetation and soil. However, this removal is not permanent. Harvesting trees, and burning wood releases the carbon much more quickly than it was stored. Another particularity is that not all emissions and removals are directly caused by humans. This is especially true for removals from forest management.
In the past, the EU reported that uptake and storing of carbon through land use activities was higher than emissions from this sector. The European land use sector thus acted as a relatively stable net sink of emissions at around -300 to -350 Megatons (Mt) CO2 per year. But this might change in the near future: projections show the net sink declining to only 279 Mt CO2 in 2030.
Adding up carbon credits and debits
The emissions and removals that are actually occurring in the atmosphere are not exactly those that are currently accounted for under the Kyoto Protocol. Rather complicated rules exist that define what can be counted as credits and debits. Depending on how these rules develop, the EU sink may be accounted for to a large degree as a credit, or it could turn into a debit because the sink is getting smaller compared to the past. It is not likely that the entire sink will be turned into credits. Especially for the management of existing forests, which contributes a lot to the net sink, negotiators of the Kyoto Protocol have developed special accounting rules for the time before 2020. Under these rules, carbon credits only count if measured against a baseline.
The rules for the time after 2020 have not yet been agreed, however, as the Kyoto Protocol ends in 2020. In order to assess the impact of including the land use sector in the EU target in our new study, we had to make different assumptions, for example about how much wood we will harvest, the development of emissions and removals, and what the baseline for forest management should be. We then applied the existing Kyoto rules and alternative rules and assessed their impact on the level of ambition required to meet the EU’s target. It quickly became obvious: the assumptions we make and the rules we apply have very large implications for the 2030 Climate and Energy Framework.
One option of including land use discussed by the Commission is to take agriculture emissions out of the currently existing framework of the so-called ESD (an already existing mechanism to distribute mitigation efforts among EU Member States for specific sectors such as transport, buildings, waste and agriculture) and merge it with land use activities in a separate pillar. In our study we estimated the net credits that the land use sector could potentially generate, and found these credits could be as high as the entire emission reduction effort needed in agriculture. This would mean that in agriculture no reductions would be needed if the credits from land use were exchangeable between the sectors.
The impact on t he target of 40% emissions reductions can be more than 4 percentage points if land use is included and the rules are not changed. This means that the original 40% target without land use would be reduced to an only 35% target. Other sectors would have to reduce their emissions less because land use seems to do part of the job. The target as a whole would thus become much less ambitious than it currently is. But this does not need to be the case. If accounting rules are changed in a way to account for the fact that the sink is getting smaller and smaller, land use would create debits. Including debits in the target would make it a 41% target instead and increase the overall level of ambition. This would be bad for the atmosphere because effectively emissions would not be reduced as much as needed.
It thus all depends on assumptions and rules. Before the rules are announced, the contribution of the land use sector cannot be quantified. Given this, we argue that the best option would be to keep land use separate from other sectors, give it separate target and design accounting rules that set incentives to increase the sink.
Reference
Böttcher H, Graichen J. 2015. Impacts on the EU 2030 climate target of inlcuding LULUCF in the climate and energy policy framework. Report prepared for Fern and IFOAM. Oeko-Institut.
Note: This article gives the views of the author, and not the position of the Nexus blog, nor of the International Institute for Applied Systems Analysis.


You must be logged in to post a comment.