Jan 15, 2018 | Data and Methods, Demography
By Dilek Yildiz, Wittgenstein Center for Demography and Global Human Capital (IIASA, VID/ÖAW and WU), Vienna Institute of Demography, Austrian Academy of Sciences, International Institute for Applied Systems Analysis
Social media offers a promising source of data for social science research that could provide insights into attitudes, behavior, social linkages and interactions between individuals. As of the third quarter of 2017, Twitter alone had on average 330 million active users per month. The magnitude and the richness of this data attract social scientists working in many different fields with topics studied ranging from extracting quantitative measures such as migration and unemployment, to more qualitative work such as looking at the footprint of second demographic transition (i.e., the shift from high to low fertility) and gender revolution. Although, the use of social media data for scientific research has increased rapidly in recent years, several questions remain unanswered. In a recent publication with Jo Munson, Agnese Vitali and Ramine Tinati from the University of Southampton, and Jennifer Holland from Erasmus University, Rotterdam, we investigated to what extent findings obtained with social media data are generalizable to broader populations, and what constitutes best practice for estimating demographic information from Twitter data.
A key issue when using this data source is that a sample selected from a social media platform differs from a sample used in standard statistical analysis. Usually, a sample is randomly selected according to a survey design so that information gathered from this sample can be used to make inferences about a general population (e.g., people living in Austria). However, despite the huge number of users, the information gathered from Twitter and the estimates produced are subject to bias due to its non-random, non-representative nature. Consistent with previous research conducted in the United States, we found that Twitter users are more likely than the general population to be young and male, and that Twitter penetration is highest in urban areas. In addition, the demographic characteristics of users, such as age and gender, are not always readily available. Consequently, despite its potential, deriving the demographic characteristics of social media users and dealing with the non-random, non-representative populations from which they are drawn represent challenges for social scientists.
Although previous research has explored methods for conducting demographic research using non-representative internet data, few studies mention or account for the bias and measurement error inherent in social media data. To fill this gap, we investigated best practice for estimating demographic information from Twitter users, and then attempted to reduce selection bias by calibrating the non-representative sample of Twitter users with a more reliable source.
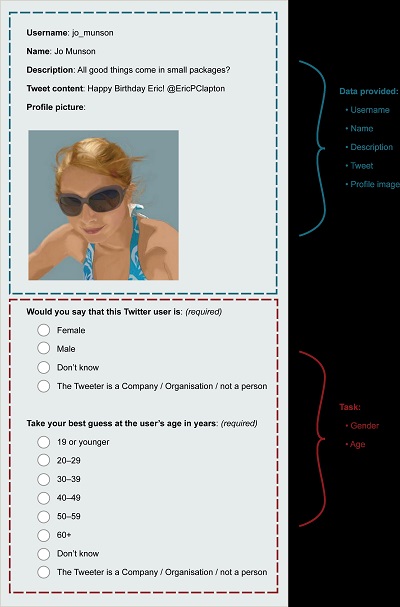
Exemplar of CrowdFlower task © Jo Munson.
We gathered information from 979,992 geo-located Tweets sent by 22,356 unique users in South-East England and estimated their demographic characteristics using the crowd-sourcing platform CrowdFlower and the image-recognition software Face++. Our results show that CrowdFlower estimates age more accurately than Face++, while both tools are highly reliable for estimating the sex of Twitter users.
To evaluate and reduce the selection bias, we ran a series of models and calibrated the non-representative sample of Twitter users with mid-year population estimates for South-East England from the UK Office of National Statistics. We then corrected the bias in age-, sex-, and location-specific population counts. This bias correction exercise shows promise for unbiased inference when using social media data and can be used to further reduce selection bias by including other sociodemographic variables of social media users such as ethnicity. By extending the modeling framework slightly to include an additional variable, which is only available through social media data, it is also possible to make unbiased inferences for broader populations by, for example, extracting the variable of interest from Tweets via text mining. Lastly, our methodology lends itself for use in the calculation of sample weights for Twitter users or Tweets. This means that a Twitter sample can be treated as an individual-level dataset for micro-level analysis (e.g., for measuring associations between variables obtained from Twitter data).
Reference:
Yildiz, D., Munson, J., Vitali, A., Tinati, R. and Holland, J.A. (2017). Using Twitter data for demographic research, Demographic Research, 37 (46): 1477-1514. doi: 10.4054/DemRes.2017.37.46
Note: This article gives the views of the author, and not the position of the Nexus blog, nor of the International Institute for Applied Systems Analysis.
Aug 18, 2017 | Demography
By Valeria Bordone, University of Munich Department of Sociology and IIASA World Population Program
Everyone, consciously or unconsciously, formulates in their own mind a subjective survival probability– i.e., an estimate of how long they are going to live. This will affect decisions in different spheres of later life: retirement, investments, and healthy behaviors. Moreover, previous research has found that subjective survival probability is a good predictor of mortality. In fact, on average, people somehow know better than standard health measures the effect that their characteristics and their behavior have on life expectancy. It is however plausible not only to expect differences within the population in terms of survival, but also in the ability to predict their own survival.

(cc) roujo | Flickr
In a recent publication with Bruno Arpino from the University Pompeu Fabra and Sergei Scherbov from the Wittgenstein Centre (IIASA, VID/ÖAW, WU)., we presented for the first time joint analyses of the effect of smoking behavior and education on subjective survival probabilities and on the ability of survey respondents to predict their real survival, using longitudinal data on people aged 50-89 years old in the USA drawn from the Health and Retirement Study.
We found that, consistent with real mortality, smokers report the lowest subjective survival probabilities. Similarly, less educated people report lower subjective survival probabilities than higher education people. This is in line with the well-known positive correlation between education and life expectancy. However, despite being aware of their lower life expectancy as compared to non-smokers and past smokers, people currently smoking at the time of the survey tended to overestimate their survival probabilities. This holds especially for less educated people.
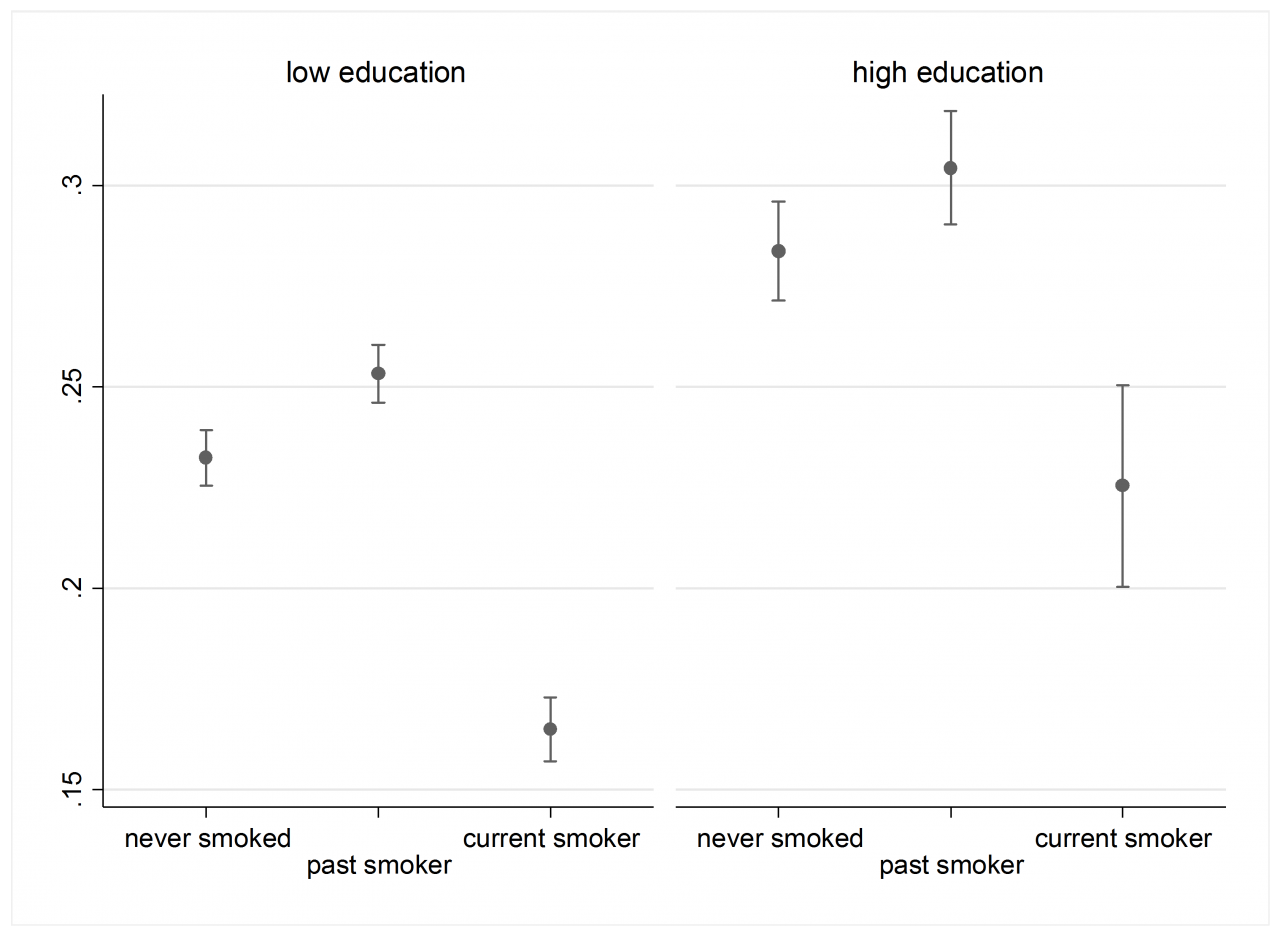
This graph shows the probability of correctly estimating the own survival probabilities with 95% confidence intervals, by smoking behavior and educational attainment. ©Arpino B, Bordone V, & Scherbov S (2017)
Our study suggests that in fact, education also plays an important role in shaping people’s ability to estimate their own survival probability. Whether or not they smoke, we found that more highly educated people are more likely to correctly predict their survival probabilities.
In view of the high proportion of the American population that consists of current or past smokers, a percentage that reached 77% in some male cohorts, our findings emphasize the need to disseminate more information about risks of smoking, specifically targeting people with less education.
By showing that smoking and education play together in determining how well people can assess the own survival potential, this study extends our understanding of the variability of subjective survival probabilities within a population. The fact that sub-groups within the population differently incorporate the effects of smoking into their assessment of survival probabilities may have important consequences for example on when people exit the labor market or whether they buy a life insurance, as individuals are likely to base their decisions also on their longevity expectations.
Policymakers can therefore draw some relevant conclusions from our study to design policies concerned with health and survivorship in later life. Despite the various anti-smoking campaigns and smoking restrictions, smokers may not be fully aware of the risks of smoking. In particular, educational groups seem to be differently exposed to the information that is disseminated to the public. Our study suggests that there is a need to target such information to less educated people, who are the most likely to underestimate the risks of smoking. Providing information on how survival probabilities vary by smoking behavior may not only reduce smoking but it may also increase individuals’ ability to assess their own survival.

(cc) Quinn Dombrowski | Flickr
Reference
Arpino B, Bordone V, & Scherbov S (2017). Smoking, Education and the Ability to Predict Own Survival Probabilities: An Observational Study on US Data. IIASA Working Paper. IIASA, Laxenburg, Austria: WP-17-012 [pure.iiasa.ac.at/14692]
This article gives the views of the author, and not the position of the Nexus blog, nor of the International Institute for Applied Systems Analysis.
Aug 1, 2017 | Demography, Young Scientists
By Parul Tewari, IIASA Science Communication Fellow 2017

© KonstantinChristian I Shutterstock
Faced with a sharp decline in the global fertility levels over the last few decades, many countries today are confronted with the problem of an aging population. This could translate into an economic threat: higher health-care costs for the elderly coupled with a shrinking working population will lead to lower income-tax revenues to provide for these rising costs. This can already be seen in countries like Japan, Spain, and Germany. With an increasing number of elderly dependents and not enough workers to replace them, their social support systems have become increasingly strained.
Even though in the last few decades there has been an increase in individual incomes, researchers have observed a negative correlation between the increased wealth and the number of children people choose to have. Sara Loo, as part of the 2017 Young Scientists Summer Program (YSSP), seeks to explore why people are choosing to have fewer children as their social and economic conditions change for the better.
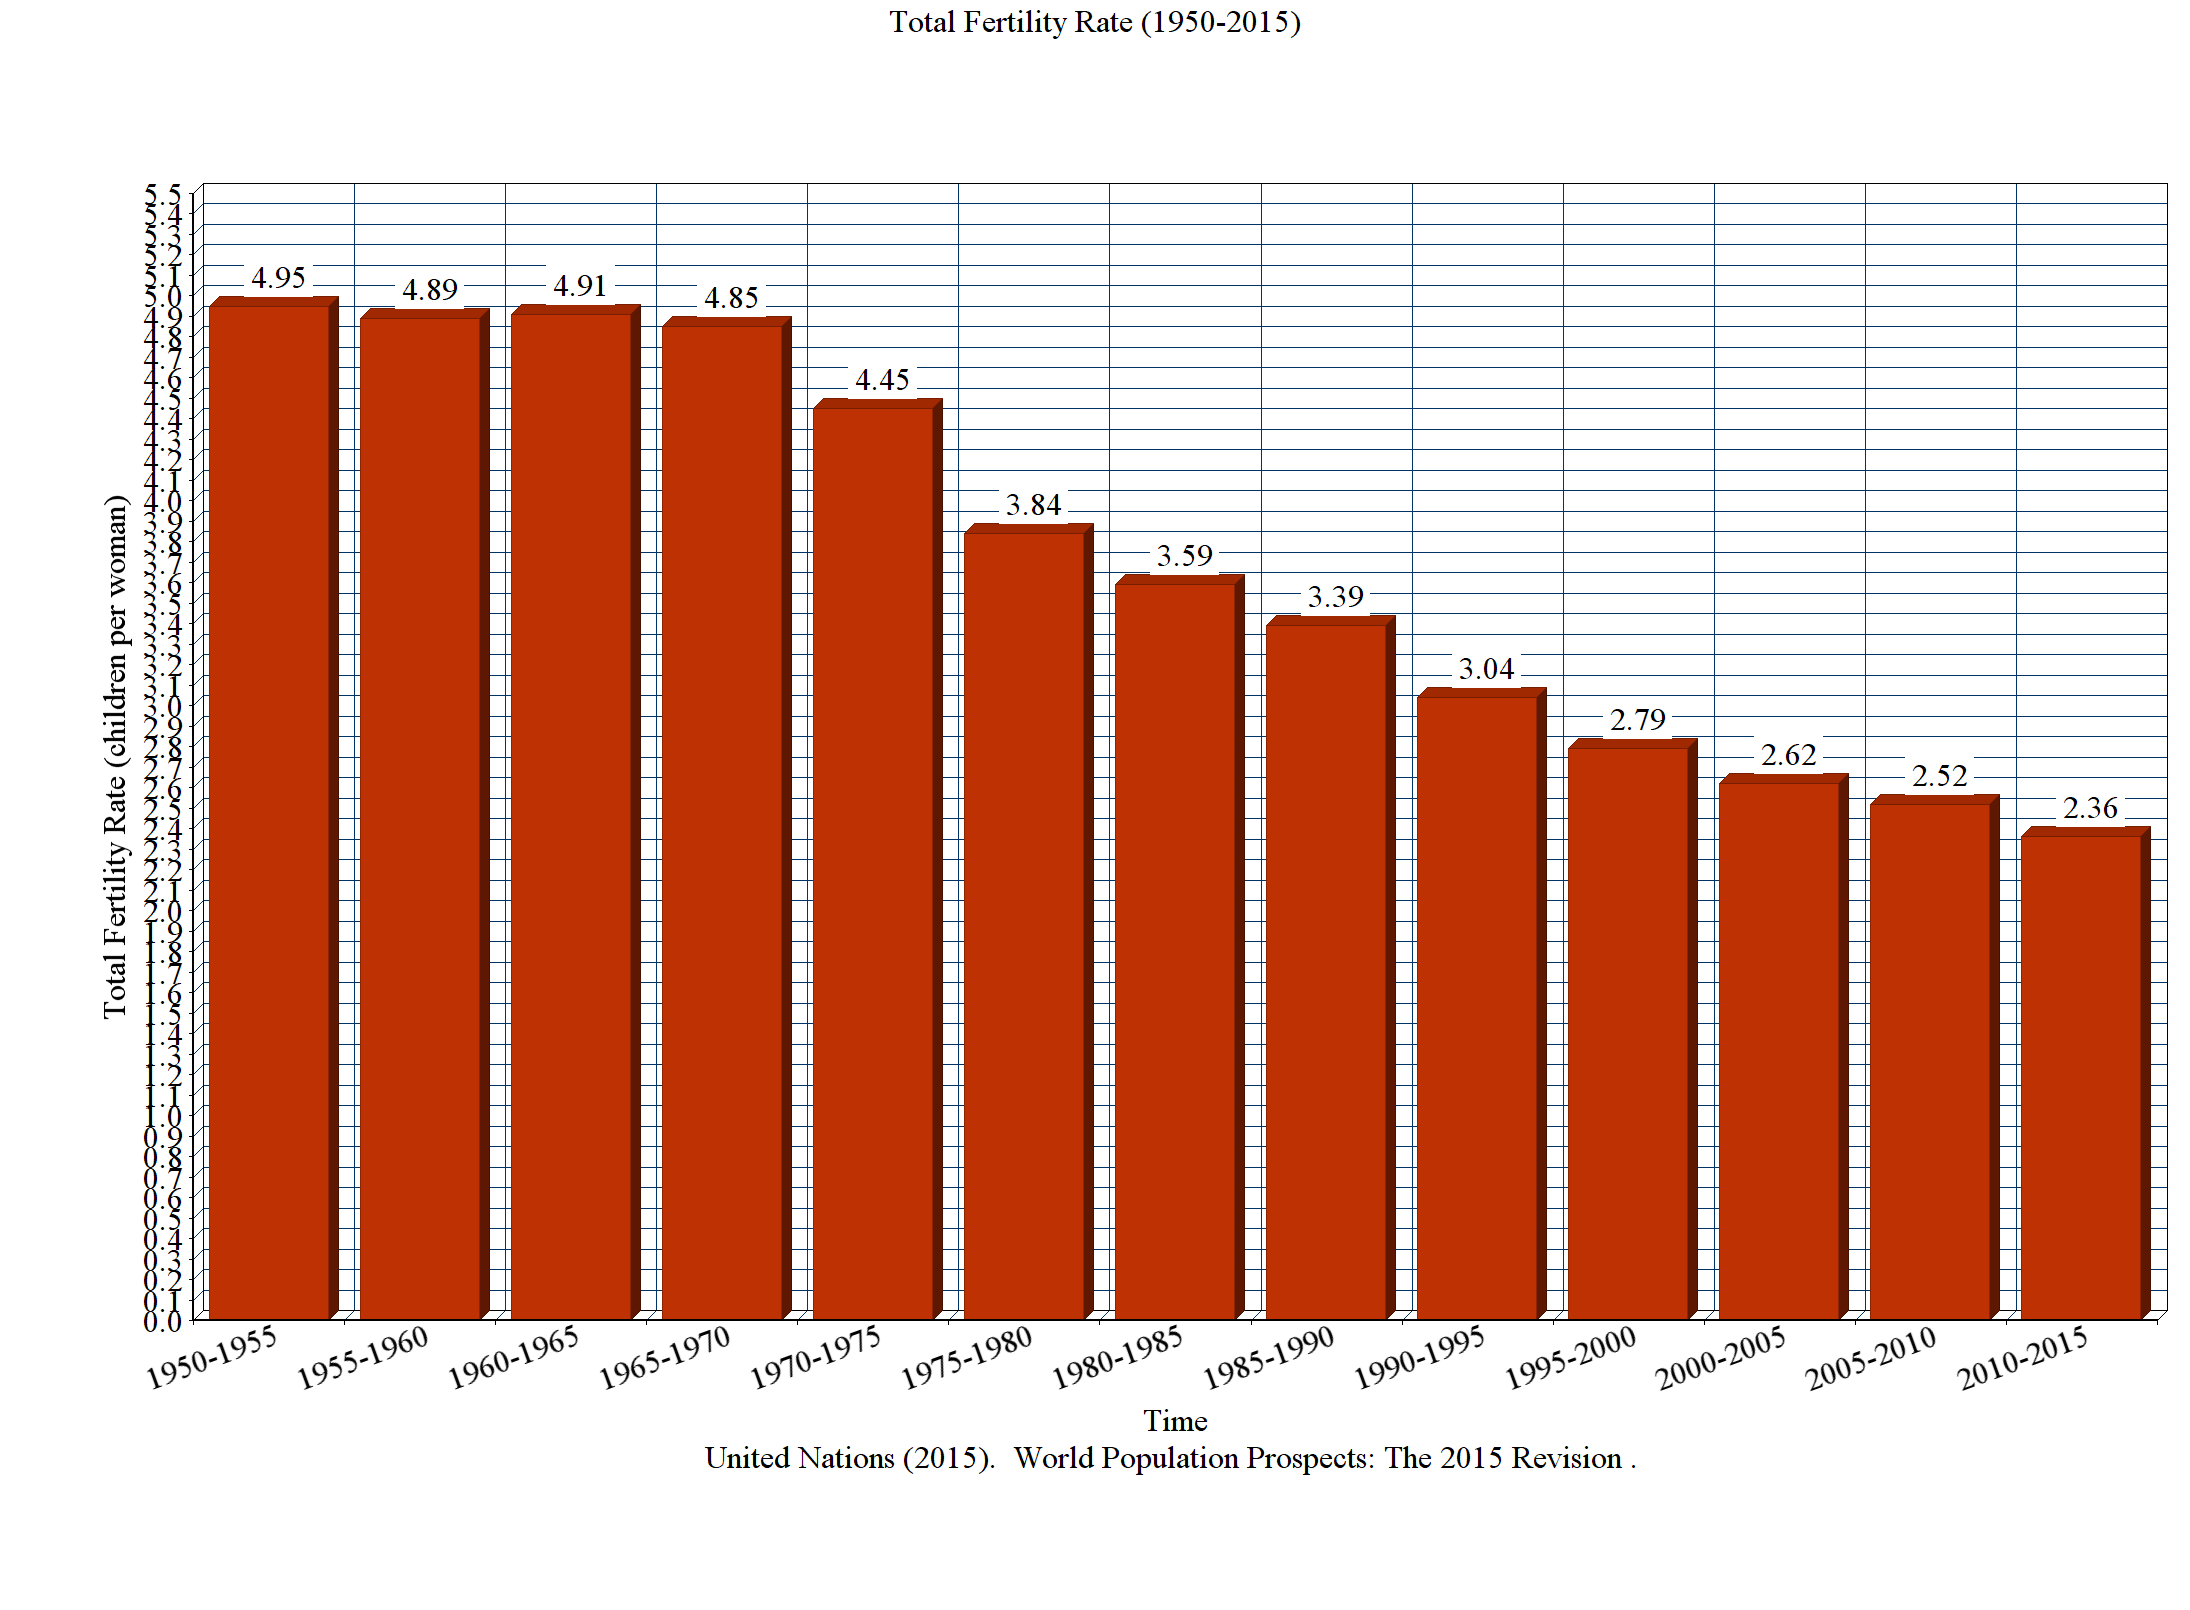
According to a report titled World Fertility Patterns 2015, global fertility levels have gone down from just above five children in 1950 to around 2.5 children per woman in 2015. In the figure below, ‘total fertility rate’ refers to the average number of children that are born to a woman over her lifetime.
It might seem counterintuitive that better living standards would be linked to decreased fertility. One way to explain it is through the lens of cultural evolution. Loo explains that culture is constantly changing – be it beliefs, knowledge, skills, or customs. This change is reflected in people’s day-to-day behaviors and affects their choices, both professional and personal. Importantly, beliefs and customs are acquired not only from people’s parents but are largely influenced by their peers – friends and colleagues.
One of the ways in which cultural evolution has affected fertility rates is resulting from the trade-off between the number of children and the quality of life that parents desire to give each of them, says Loo. As both men and women vie for well-paying jobs to attain a higher standard of living, and as they compete for such jobs based on their education, the resources parents invest into each child’s upbringing, including education and inheritance, are crucial. Even the time parents can give to their children becomes an expensive currency.
This makes for a highly competitive environment in which everyone is trying to achieve a higher status, in order to provide better opportunities for their children. When parents have fewer children, this means giving each of them a greater chance of achieving higher status.
Loo elaborates that as everyone competes to get their children to the top of the socioeconomic ladder, this necessitates a higher investment per child, both monetarily and otherwise. The theory of cultural evolution in this case thus predicts lowered fertility as competition for well-paying jobs intensifies with a country’s development.
However, it is not that such parental strategies apply equally to all segments of a population, says Evolution and Ecology Program Director Ulf Dieckmann, who is supervising Loo’s research at the institute over the summer. He explains that it is therefore helpful to look at fertility in relation to people’s socioeconomic status, instead of just looking at a population’s average fertility rate over time.
This can give telling insights. “In many pre-industrial societies, the rich had greater numbers of children, and if anybody had less than replacement-level fertility, it was the really poor people who could not afford to raise as many children. It was over time that this correlation changed from positive to negative when richer people decided to have fewer children: if they had too many children, they could not afford to invest as much per child as was needed to secure maintaining or raising the children’s socioeconomic status. This has led to a reversal of the traditional pattern: in developed societies, fertility has been shown to drop at high socioeconomic status,” says Dieckmann.
Complementing existing research on the fertility impacts of urbanization and of women’s education and liberation, Loo plans to explore how the aforementioned mechanisms of cultural evolution can explain the observed negative correlation between socioeconomic status and fertility. Her goal is to do so using a mathematical model that can account for both economic trends and cultural trends as two key processes influencing fertility rates.
About the researcher
Sara Loo is currently a third-year PhD candidate at the University of Sydney, Australia, where her research focuses on the evolution of uniquely human behaviors. Loo is working with the Evolution and Ecology Program at IIASA over the summer, with Professor Karl Sigmund and Program Director Ulf Dieckmann as her supervisors for the project.
This article gives the views of the author, and not the position of the Nexus blog, nor of the International Institute for Applied Systems Analysis.
Apr 3, 2017 | Demography
By Roman Hoffmann, Wittgenstein Centre for Demography and Global Human Capital (IIASA, VID/ÖAW and WU), Vienna Institute of Demography, Austrian Academy of Sciences
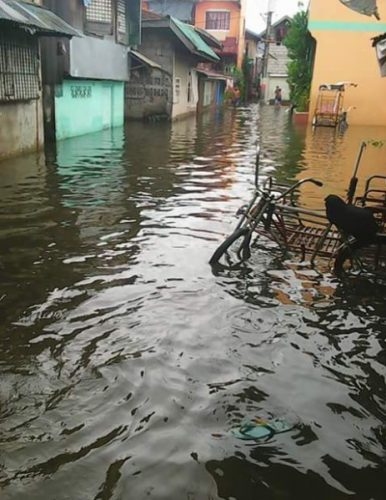
Flooded street in Meycauayan, Bulacan, Philippines (credit: Kasagana-Ka Development Center Inc., 2016 )
Floods, droughts, and tropical storms have significantly increased, both in frequency and intensity in recent years. The burden of these events—both human and economic—falls in large part on low and middle-income countries with high exposure, such as coastal and island nations. In a recent study, with IIASA researcher Raya Muttarak, we found that education significantly contributes to increasing disaster resilience among poor households in the Philippines and Thailand, two countries which are frequently affected by natural calamities.
In these countries, public disaster risk reduction is important, yet public measures, such as investments in structural mitigation for large buildings or infrastructure, implementation of early warning systems, or planned evacuation routes and shelters, may not be enough to sufficiently protect communities from the devastating impacts of natural calamities. In addition, the undertaking of individual preparedness measures by households, such as stockpiling of food and water, strengthening of house structures, and having a family emergency plan, is crucial. Yet, even in areas which are heavily exposed to disasters, people often do not take any precautionary measures against environmental threats.
How people can be motivated to take precautionary action has been a fundamental question in the field of risk analysis. In the new study, which was based on face-to-face interviews in both Thailand and the Philippines, we found that prior disaster experience, which is influenced by geographical location of the home, is one of the key predictors of disaster preparedness. For those who were affected by a disaster in the recent past, education does not seem to play a significant role—they have already learned by experience. However, among those who had not previously been affected, educational attainment becomes a key determinant. Even without having experienced a disaster, the educated are more likely to make preparations. In fact, educated people who haven’t experienced a disaster have preparedness levels that are as high as those of households who were only recently affected. Since education improves abstract reasoning and abstraction skills, highly educated individuals may not need to experience a disaster to understand that they can be devastating. This suggests that education, as a channel through which individuals can learn about disaster risks and preventive strategies, may effectively serve as a substitute for (often harmful) disaster experiences as a main trigger of preparedness actions.
In additional analyses, we investigated through which channels education promotes disaster preparedness by looking at the relationship between education and different mediating factors such as income, social capital and risk perception, which are likely to influence preparedness actions. We found that how education promotes disaster preparedness is highly context-specific. In Thailand, we found that the highly educated have higher perceptions of disaster risks that can occur in a community as well as higher social capital (measured by engagement in community activities) which in turn increase disaster resilience. In the Philippines, on the other hand, it appears that none of the studied mediating factors explain the effect of education on preparedness behavior.
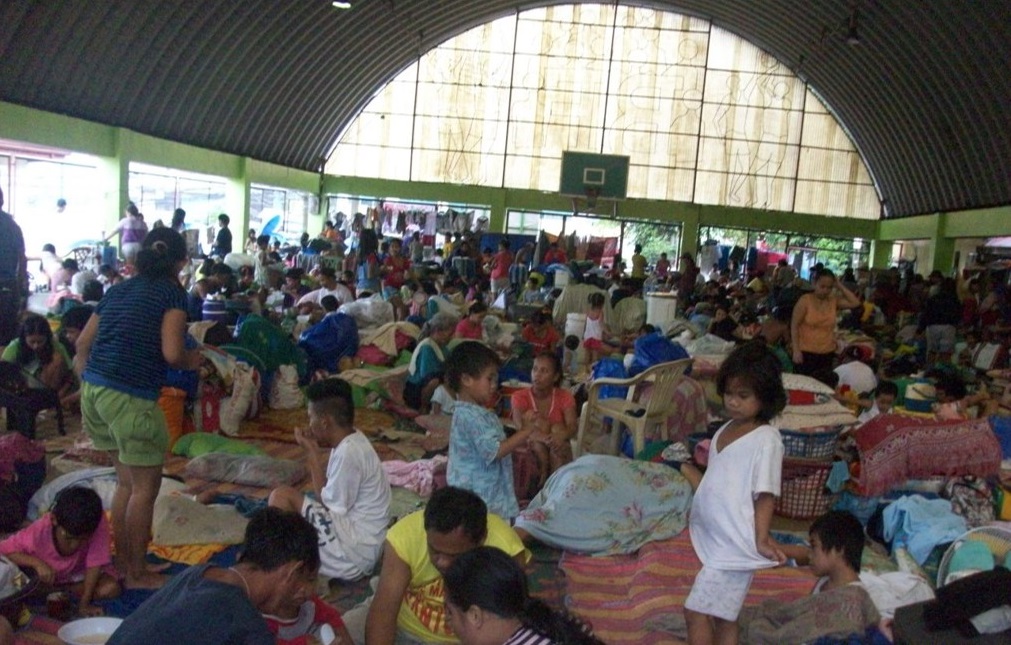
Emergency shelter, San Mateo, Rizal, Philippines (credit: Kasagana-Ka Development Center Inc., 2013 )
Certainly, it remains important for national governments to invest in disaster risk reduction measures such as early warning systems or evacuation centers. However, our study suggests that public funding in universal education will also benefit precautionary behavior at the personal and household level. In line with recent efforts of the UN to promote education for sustainable development, our study provides solid empirical evidence confirming the important role of education in building disaster resilience in low and middle-income countries.
Reference
Hoffmann, R. & Muttarak, R (2017). Learn from the past, prepare for the future: Impacts of education and experience on disaster preparedness in the Philippines and Thailand. World Development [doi:10.1016/j.worlddev.2017.02.016]
This article gives the views of the author, and not the position of the Nexus blog, nor of the International Institute for Applied Systems Analysis.
Feb 14, 2017 | Demography
By Samir KC, IIASA World Population Program
In 2011, the last decadal census of Nepal counted more than 26.5 million people, plus about 2 million “absentee” Nepalese working abroad. The census revealed a population that is on the move, a rapidly declining number of births, and a high degree of population heterogeneity between the different areas of Nepal. The increasing complexity in the demographic dynamics is making it difficult for Nepal’s government to plan future policies and allocate budgets. That’s why at IIASA in collaboration with Ministry of Health of Nepal, we recently projected the Nepalese population up to 2031 by age and sex for 75 districts as well as more than 4000 villages and municipalities.
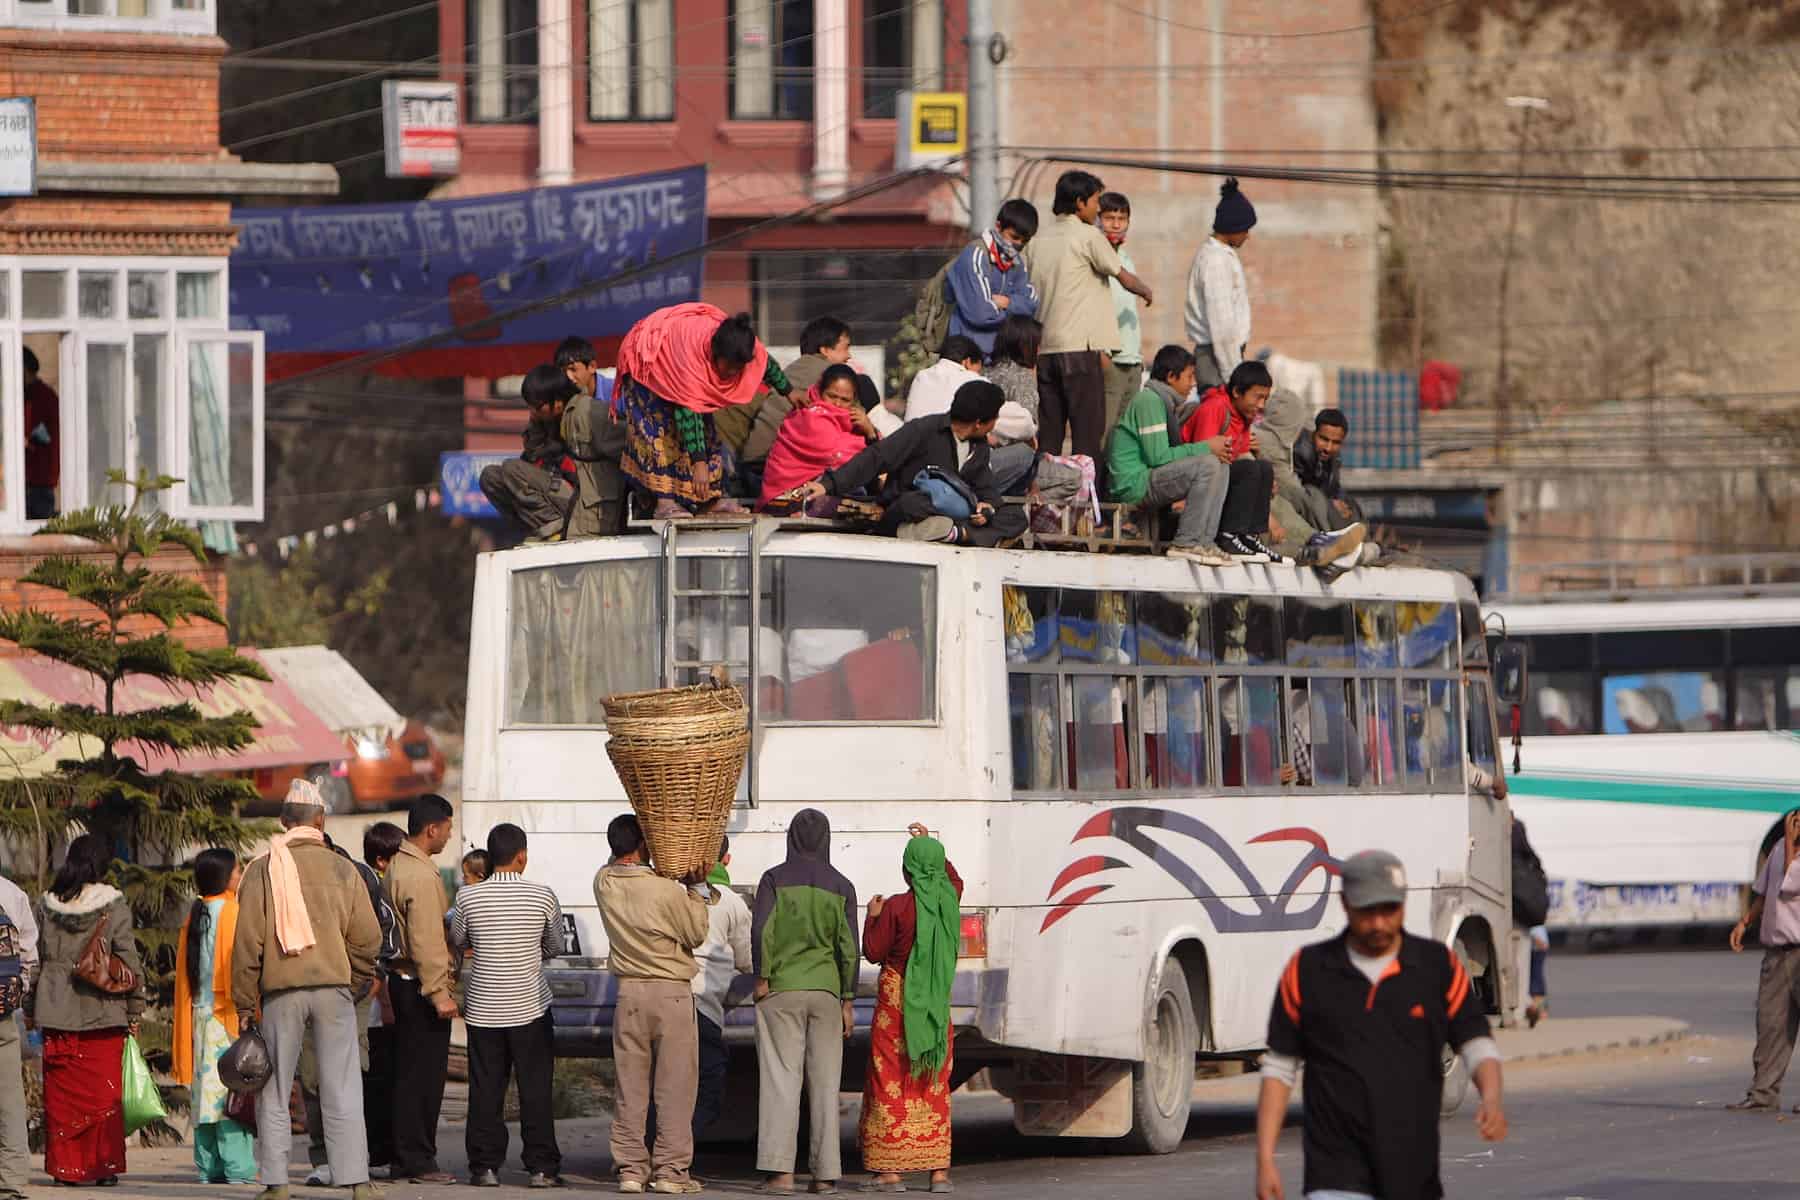
Passengers on a bus in Nepal. The country is seeing large amounts of migration both within and outside of the country. ©AusAID
Our projections show that the population of Nepal will continue to increase, albeit at a slow rate from, 26.5 million today to 34.2 million in 2031, and the age structure will continue to grow older. We found that demographic behaviors differ largely by geographic area within Nepal, and highly correlates with the inequalities in terms of development and opportunities. For example, the fertility level in the Mid-Western Hills and Mountain region were very high compared to the rest of the country.
Since 1959, Nepal has had an aggressive but non-mandatory family planning policy with a message to limit family size to two children, but this policy will be soon ending as the overall fertility is approaching the benchmark in most parts of the country. Our study projects that the number of children born, which has been declining in the past 10-15 years, will stabilize with some fluctuation due to larger cohort of women entering the reproductive ages. In the past, the declining number of births lowered the burden in universalizing health coverage. The study suggests that now the government should channel its resources where needed and the nationwide focus should be more on improving the quality of reproductive services rather than telling people how many children they should have.
A stream of migration
Our analysis shows that for Nepal, the future population dynamics are likely to be influenced in large part by migration, both within and outside of the country. We found that especially in the hill and mountain districts of Nepal, depopulation is occurring as people move away. Because of the Maoist conflict during 1996-2006 and its impact on all aspects of life, young Nepali males began leaving their homes to find safer areas and better employment opportunities, often in Arab and Southeast Asian countries. This in turn might have affected the fertility rates as well as increased internal migration of the dependents (of the migrants made possible by the flow of remittance) from less developed to more developed areas within Nepal.
In recent times, women have joined the migration stream, and are likely to be a major force in lowering the fertility rate in Nepal. If the trend continues, a large part of the mountains and hills is likely to depopulate and the political and socioeconomic consequences of such phenomenon should be studied.
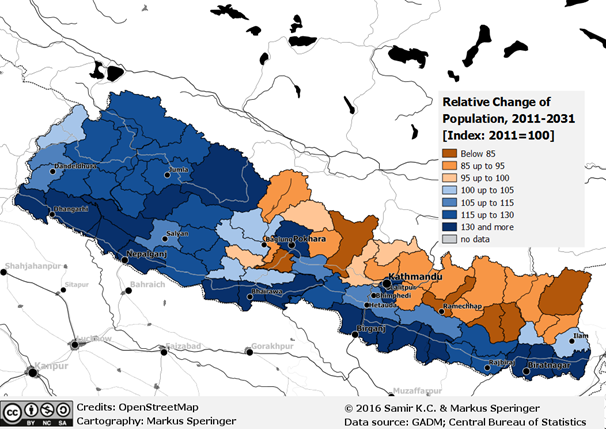
Projected population change in Nepal in 2031 compared to 2011. ©Samir KC & Markus Speringer
Our projections show that the country should expect a huge number of this absentee population to return. The young men and women in their 20s and 30s who have left the country to work in Arab and Asian countries will have to return in their 40s and 50s due to strict rules regulating labor migration in these countries, the labor intensive jobs might not suit their age, and to finally reunite with the family back home. They could be forced to return even sooner if the economic situation in these countries is adversely affected by regional or global recession or conflict, price of oil etc. However, questions remain about how the return process will unfold, where people they return to, and what its impact on the society and the nation would be.
We think that the data and the population model, and the projection that we developed for Nepal could be very useful in many ways, for example in population, environment, economics, social transformation, sustainable development, and other areas. However, we need more data and projections and the possibility to run alternative scenarios, and to do this, demographers, population experts, and governmental institutions should collaborate. One such collaborative initiative is currently underway at the Shanghai University, where I have recently started to develop such a model in 11 countries in Asia, including Nepal. Once the base population model is ready, adding further layers representing the wellbeing of the population will be the next step.
Reference
KC S, Speringer M, Thapa A, & Khanal MN (2016). Projecting Nepal’s Demographic Future- How to deal with spatial and demographic heterogeneity. IIASA Working Paper. IIASA, Laxenburg, Austria: WP-16-021 http://pure.iiasa.ac.at/14029/
This article gives the views of the author, and not the position of the Nexus blog, nor of the International Institute for Applied Systems Analysis.


You must be logged in to post a comment.