Jan 27, 2016 | Climate Change, Postdoc, Risk and resilience
By Mia Landauer, a Finnish postdoc at IIASA Risk, Policy and Vulnerability Program and Arctic Futures Initiative
When I was a child I did not like cross-country skiing. One reason was that like many other schoolmates in Finland, I had no other option than to ski to school throughout the winter, even when temperatures were below -20 C, and even though my skis were too big because I got them from my sister and so old that they could have broken anytime.
When I decided to write my dissertation in Austria about climate adaptation of winter tourism, I found I still couldn’t get away from skiing. My professor at the University of Natural Resources and Life Sciences (BOKU) asked me to join a research team investigating this topic. “What a great tradition you have in Finland! My friend and colleague from METLA (now Natural Resources Institute) in Finland would love to do research with us but with somebody who knows about cross-country skiing! You are the perfect match!” I guess I was too shy to admit that I was not excited about having cross-country skiing as a case study—but I decided to give it a try.
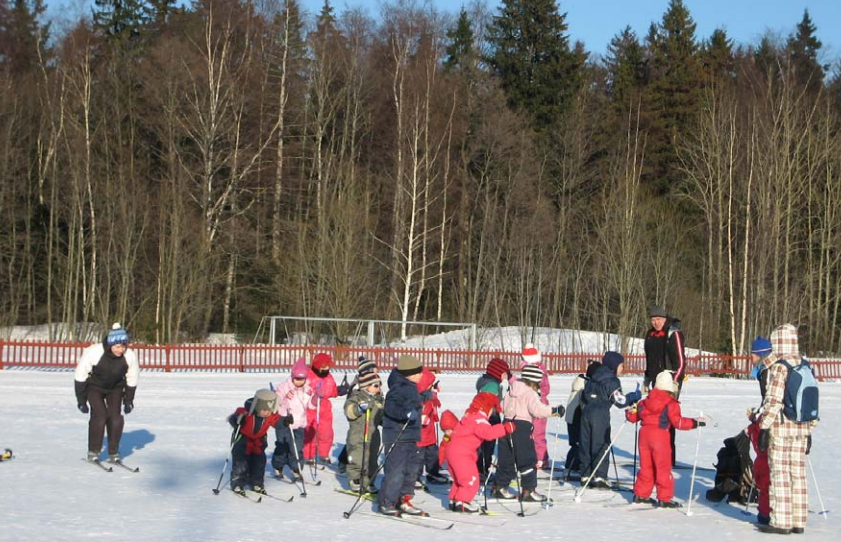
Cross country skiing in Finland is practiced by all age groups (voluntarily or not). Photo Credit: © Mia Landauer
Cross-country skiing is socially and culturally a very important activity in Finland, with considerable health benefits. Forty-two percent of the population practice skiing annually and 98% have the skills. But cross-country skiing, like other snow-based activities, is affected by climate change: even Nordic countries are now seeing lack of snow, shift of seasons, and extreme weather events. The winter 2015/2016 has been no exception. Many Finns are concerned that losing this activity would lead to reduced well-being and loss of cultural tradition. Furthermore, economic impacts on tourism regions brought about by a decrease in skiing would cause problems to local economies heavily dependent on snow-based tourism.
Although vulnerability indicators of some other tourism sectors such as beach tourism exist, nobody had thought about cross-country skiing. So we decided to develop an index, based on climatic observations together with extensive survey data on skiers living in climatically different regions in Finland.
We found that exposure to changes in snow conditions have a considerable effect on regional vulnerability. The most vulnerable skiers are in southernmost parts of Finland, which makes sense. But it is not only the amount of snow and length of winter that matter. We also found that skiers in North and East Finland have the highest capacity to adapt, as indicated by their ability to ski: having the necessary skills and equipment, as well as capacity and willingness to travel to be able to ski.
However, the results also show that if it we could enhance these components of adaptive capacity, also the skiers in the south would have a chance. If there are no adaptation options (no artificial snow tracks, no indoor skiing facilities, or simply no interest to use these, or no money or time to travel to be able to ski), in the short term the Finnish cross-country skiing population will face impacts on health, well-being, and quality of life. In the long term, the skiing culture could be lost. Furthermore, decline in demand would lead to regional economic losses in tourism-dependent local economies.
Attempts are being made to maintain the skiing tradition. Nowadays there are a lot of organized activities where kids are introduced to outdoor activities in a playful and educational environment, and ski school and clubs are being established. They play an important role to create a close and pleasant relationship to nature and increase motivation for skiing. But of course the most important element for skiing is snow.
I have always had a very close relationship to nature. Believe me or not, sometimes I do go skiing although it also brings back the unpleasant memories. Despite them, wintery landscapes and nature experience have motivated me to continue skiing as an adult. The gray and rainy winters make me worried and I simply cannot see myself skiing in a ski tunnel… Albeit “you will never know the true value of a moment until it becomes a memory“, I want snow!
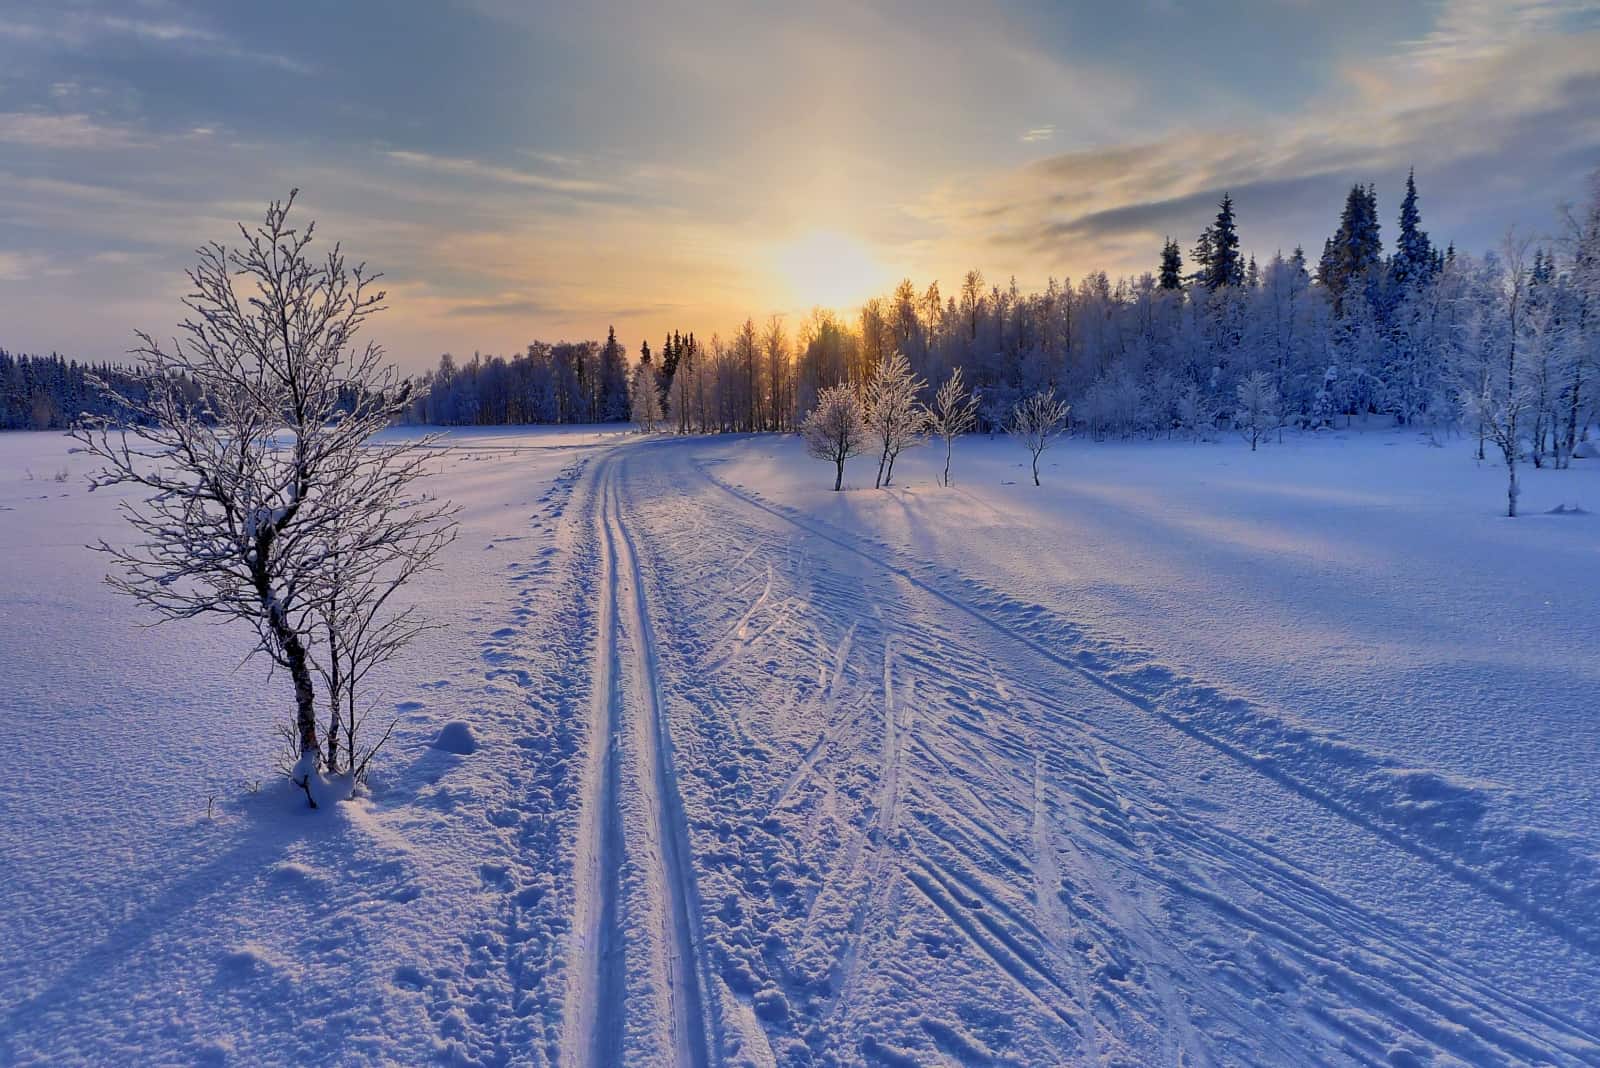
Cross country ski track in Ruka, Finland Photo Credit: © Timo Newton-Syms via Flickr
More information:
Project: “Map Based Assessment of Vulnerability to Climate Change Employing Regional Indicators” (MAVERIC)” http://www.syke.fi/projects/maveric
References
Landauer, M., Sievänen, T., & Neuvonen, M. (2015). Indicators of climate change vulnerability for winter recreation activities: a case of cross-country skiing in Finland, Leisure/Loisir, 39:3-4, 403-440. http://dx.doi.org/10.1080/14927713.2015.1122283
Landauer, M., Haider, W., & Pröbstl, U. (2014). The influence of culture on climate change adaptation strategies: Preferences of cross-country skiers in Austria and Finland. Journal of Travel Research 53(1), pp. 95-109. doi: 10.1177/0047287513481276
Landauer, M., & Sievänen, T. (2011). Suomalaisten maastohiihtäjien sopeutuminen ilmastonmuutokseen. In T. Sievänen & M. Neuvonen (Eds.), Luonnon virkistyskäyttö 2010 (pp. 91–101). Vantaa: Working Papers of the Finnish Forest Research Institute, 212.
Landauer, M., Sievänen, T., & Neuvonen, M. (2009). Adaptation of Finnish cross-country skiers to climate change. Fennia 187 (2), pp. 99–113. http://ojs.tsv.fi/index.php/fennia/article/view/3697
Neuvonen, M., Sievänen, T., Fronzek, S., Lahtinen, I., Veijalainen, N., & Carter, T. R. (2015). Vulnerability of cross-country skiing to climate change in Finland – An interactive mapping tool. Journal of Outdoor Recreation and Tourism, 11, 64–79. doi:10.1016/j.jort.2015.06.010
Neuvonen, M. & Sievänen,T. (2011). Ulkoilutilastot 2010 (Outdoor Recreation Statistics 2010). In: Sievänen, T. & Neuvonen, M. (toim.). Luonnon virkistyskäyttö 2010. Metlan työraportteja / Working Papers of the Finnish Forest Research Institute 212: 133–190
Perch-Nielsen, S. L. (2010). The vulnerability of beach tourism to climate change – An index approach. Climatic Change, 100(3–4), 579–606. doi:10.1007/s10584-009-9692-1
Note: This article gives the views of the author, and not the position of the Nexus blog, nor of the International Institute for Applied Systems Analysis.
Oct 1, 2015 | Citizen Science
By Linda See, IIASA Ecosystems Services and Management Program
We had another very hot summer this year in Europe and many other parts of the world. Many European cities, including London, Madrid, Frankfurt, Paris and Geneva, broke new temperature records.
Cities are particularly vulnerable to increasing temperatures because of a phenomenon known as the urban heat island effect. First measured more than a half a century ago by Tim Oke, the increased temperatures measured in urban areas are a result of urban land use, or higher amounts of impervious surfaces such as concrete and concentrated urban structures. The urban heat island effect impacts human health and well-being. It’s not just a matter of comfort: during the heat wave in 2003, more than 70,000 people in Europe are estimated to have perished, mostly urban dwellers.

Summer 2015 in Ljubljana, Slovenia. ©K. Leitzell | IIASA
While climate models have many uncertainties, they do all agree that the urban heat island effect will increase in frequency and duration in the future. A recent article by Hannah Hoag in Nature paints a bleak picture of just how unprepared cities are for dealing with increasing temperatures. The paper cites positive and negative examples of mitigation from various cities but it falls short of suggesting a more widely applicable solution.
What we need is a standardized way of approaching the problem. Underlying this lack of standards is the paucity of data on the form and function of cities. By form I mean the geometry of the city–a 3D model of the buildings and road network, and information on the building materials—as well as a map of the basic land cover including impervious surfaces like roads and sidewalks, and areas of vegetation such as gardens, parks, and fields. Function refers to the building use, road types, use of irrigation and air conditioning and other factors that affect local atmospheric conditions. As climate models become more highly resolved, they will need vast amounts of such information to feed into them.
These issues are what led me and my colleagues (Prof Gerald Mills of UCD, Dr Jason Ching of UNC and many others) to conceive the World Urban Database and Access Portal Tools (WUDAPT) initiative (www.wudapt.org). WUDAPT is a community-driven data collection effort that draws upon the considerable network of urban climate modelers around the world. We start by dividing a city into atmospherically distinct areas, or Local Climate Zones (LCZs) developed by Stewart and Oke, which provides a standard methodology for characterizing cities that can improve the parameters needed for data-hungry urban climate models.
Using freely available satellite imagery of the Earth’s surface, the success of the approach relies on local urban experts to provide representative examples of different LCZs across their city. We are currently working towards creating an LCZ classification for all C40 cities (a network of cities committed to addressing climate change) but are encouraging volunteers to work on any cities that are of interest to them. We refer to this as Level 0 data collection because it provides a basic classification for each city. Further detailed data collection efforts (referred to as Levels 1 and 2) will use a citizen science approach to gather information on building materials and function, landscape morphology and vegetation types.

The Local Climate Zone (LCZ) map for Kiev.
WUDAPT will equip climate modelers and urban planners with the data needed to examine a range of mitigation and adaptation scenarios: For example what effect will green roofs, changes in land use or changes in the urban energy infrastructure have on the urban heat island and future climate?
The ultimate goal of WUDAPT is to develop a very detailed open access urban database for all major cities in the world, which will be valuable for many other applications from energy modelling to greenhouse gas assessment. If we want to improve the science of urban climatology and help cities develop their own urban heat adaptation plans, then WUDAPT represents one concrete step towards reaching this goal. Contact us if you want to get involved.
About the WUDAPT Project
The WUDAPT concept has been developed during two workshops, one held in Dublin Ireland in July 2014 and the second in conjunction with the International Conference on Urban Climate in Toulouse; a third workshop is set to take place in Hong Kong in December 2015. More information can be found on the WUDAPT website at: http://www.wudapt.org.
References
Bechtel, B., Alexander, P., Böhner, J., Ching, J., Conrad, O., Feddema, J., Mills, G., See, L. and Stewart, I. 2015. Mapping local climate zones for a worldwide database of form and function of cities. International Journal of Geographic Information, 4(1), 199-219.
Hoag, H. 2015. How cities can beat the heat. Nature, 524, 402-404.
See, L., Mills, G. and Ching. J. 2015. Community initiative counters urban heat. Nature, 526,43 (01 October 2015) doi:10.1038/526043b
Stewart, I.D. and Oke, T.R. 2012. Local Climate Zones for urban temperature studies. Bulletin of the American Meteorological Society, 93(12), 1879-1900.
Wake, B. 2012. Defining local zones. Nature Climate Change, 2, 487.
Note: This article gives the views of the author, and not the position of the Nexus blog, nor of the International Institute for Applied Systems Analysis.
Mar 27, 2015 | Energy & Climate, Water
By Paul Yillia, Guest Research Scholar, IIASA Water Program
Sunday March 22 2015, was World Water Day. I woke up on that beautiful spring morning in Vienna to the rising sunshine through a slit in the curtains and the lovely humming of birds returning from their winter hideouts some thousands of kilometers away. It was clear to me: winter has ended and spring is here. But there was another thing on my mind that beautiful Sunday morning: the theme of 2014 World Water Day, the water-energy nexus. How can anyone operationalize this concept?

The Water-Energy Nexus has been a hot topic in the water community this year – but how can this concept be turned to action? Poster courtesy UN Water Program
The nexus refers to the notion that global systems are strongly intertwined and heavily interdependent; that systems thinking and planning is required to address persistent global challenges in an integrated way. It is a beautiful concept, no doubt, but what do we do with it?
I joked in my travels and engagements on nexus issues last year that 2014 in my view was the most nexus year. Much has been achieved in 2014: raising awareness of the linkages between water and energy ; demonstrating that integrated approaches and solutions to water-energy issues can achieve greater economic and social impacts; identifying policy formulation and capacity development issues through which the international development community, in particular the UN system can contribute; and identifying key stakeholders and actively engaging them in the discussion on the post-2015 development agenda.
But so far, much of the work on the nexus has been on advocacy, to galvanize interests and mobilize support at the global level. As a result, the concept received widespread global attention and acceptance. The real question now is: How can we transform those commitments and interests into operational frameworks for programs and initiatives? I woke up thinking of three areas:
- Supporting nexus assessment to understand the interactions between various nexus dimensions as countries review and roll out new policies. The objective will be to inspect the performance of current policies in terms of resource use efficiency and productivity in order to facilitate the technical interventions that will be required.
- Strengthening consultations and engagement among relevant sectors for various nexus dimensions. This will help decision makers anticipate, plan, and manage interventions collectively and to re-think policies and strategies to deal effectively with a range of complex interactions that are interlinked and interdependent.
- Reinforcing the enabling environment to facilitate the transitions that are required. This will require action to support key institutions, policy transitions and facilitating public/private funding mechanisms and investment frameworks that are required for nexus interventions.
How do we do this? First, we need to understand the interactions for a given unit of management. It could a country, a river basin, a municipality, a region or sub-region. Then we need to get various spheres of interest engaged in constructive dialogue, both in planning and in resource allocation and utilization. And probably even more importantly we need to provide the institutional, financial, and human capacity requirements to turn ideas into actions.
The challenges are huge in some regions but progress can be achieved with significant multiple gains if we get the assessments right, if we can get key sector actors to continuously talk to each other, and if are able to strengthen the enabling environment to facilitate actions. We need to act before the interest we have generated in the last couple of years diminishes.

Water and energy are inextricably linked – the “water-energy nexus.” Yillia and other researchers in IIASA’s Water program aim to bring a holistic view to the subject. Photo Credit: Kali Gandaki dam, Asian Development Bank
Note: This article gives the views of the author, and not the position of the Nexus blog, nor of the International Institute for Applied Systems Analysis.
Jan 27, 2015 | Environment, Young Scientists
Danielle Haak, who recently completed her PhD from the Nebraska Cooperative Fish and Wildlife Research Unit and the School of Natural Resources at the University of Nebraska-Lincoln, has won the annual Peccei Award for her outstanding research as part of the 2014 Young Scientists Summer Program (YSSP) in IIASA’s Advanced Systems Analysis research program.
 Could you tell me a bit about yourself? Where are you from and what do you study?
I grew up in Milwaukee, Wisconsin (USA), and it was there I fell in love with the natural world. As a kid, my family and I spent weekends boating on Lake Michigan, and I’ve always been fascinated by lakes and the hidden world beneath the water’s surface. As an undergraduate, I spent a few summers in northern Wisconsin at a limnology research station, and this is where I realized I could actually make a career out of this fascination! I went on to get a BSc in Wildlife Ecology, a MSc in Biological Sciences, and I recently defended my PhD dissertation that focused on the energetics and habitat requirements of the invasive freshwater Chinese mystery snail. In general, I’m interested in aquatic invasive species and how their introduction affects ecosystem structure, functioning, and resilience.
How did you get interested in this subject?
I was drawn to aquatic invasive species during my undergraduate research. My first independent research project was on invasive crayfish in a northern Wisconsin lake; in addition to out-competing the native crayfish population, the invasive species suffered from a fungal disease outbreak, and we wanted to understand its prevalence throughout the lake. I also worked as a technician on a whole-lake study researching the efficacy of manual removal of an invasive crayfish species from another lake. It was a long-term project that successfully reduced the invasive rusty crayfish population enough that the native crayfish population was able to recover, and the entire lake underwent a drastic physical change as a result. These large-scale dynamics have always been appealing to me, and I knew it was something I wanted to pursue in my career. When I started my PhD at the University of Nebraska-Lincoln, our research group had just started a number of side projects on the Chinese mystery snail, and there was an obvious gap in our scientific understanding of the species; thus, it made sense to take advantage of this opportunity!
What was the question you were trying to answer in your YSSP research project?
My YSSP project built upon my dissertation topic but went in a slightly different direction. My YSSP supervisor, Dr. Brian Fath, and I wanted to utilize the already-established methods of social and ecological network analyses, but in a way that hadn’t been done before. Ultimately, we had two main questions. First, we wanted to investigate how the social dynamics of ecosystems can be integrated into ecological network analysis. And second, we wanted to use network analysis to analyze the ecological effects and movement of the Chinese mystery snail in the southeast region of Nebraska.
What did you find?
Because there were a few parts to this research, we had a number of different results. First, we were able to create directed networks of how anglers and boaters moved among a network of flood-control reservoirs. We also developed ecological networks specific to each of the 19 reservoirs included in our study. Both of these findings were relevant by themselves, but the cool part was how we combined them. We adapted the framework of infectious disease network modeling to simulate what would happen within the first 25 years after a hypothetical introduction. The human movements connecting reservoirs were equivalent to a disease’s transmission rate, and the individual population growth of the snail within each reservoir after an introduction was like a disease’s incubation time leading up to a threshold where that reservoir then became contagious. We started with 5 infected and contagious reservoirs, and after 25 years only 5 of the 19 reservoirs did not have the Chinese mystery snail in it. Finally, we identified three of the already-infected reservoirs where preventing snails from being transported out of them would be most critical as well as two susceptible reservoirs where preventing introduction of the snails would be most beneficial.

Chinese Mystery Snail. Photo: Wisconsin Department of Natural Resources, Doug Jensen
Why is this research important for policy or society?
Our preliminary results demonstrated that social and ecological network models can be used in tandem, which has the potential to address a number of complex policy and management issues. Additionally, being able to prioritize reservoirs based on how effective prevention efforts would be allows managers to focus their limited resources in places they would get the best return on their investment. I believe there is also a great deal of potential in using this combined model approach to assess the spread of other aquatic invasive species of concern as well as other types of disturbances.
How are you planning to continue this research when you return to IIASA?
I would like to work with Dr. Fath on refining some of my individual ecological network models, and possibly incorporating some of the additional social data that’s available to us. We also discussed possibly using the approach to look at other questions related to aquatic invasive species, but in different geographical regions and possibly with different software. One of the best parts of this project was coming up with so many questions on where we could go next, and I really enjoyed working with Dr. Fath and gaining a new perspective on the questions that interest me.
How did your time at IIASA affect your PhD research?
My time at IIASA refreshed my love of the scientific process, and I loved the flexibility in adjusting my project as I learned more and developed new questions. Ultimately, I ended up with an additional chapter for my dissertation and came home with a mostly-completed draft.
What was your favorite aspect of the YSSP and IIASA?
I loved so much about YSSP and working at IIASA, but the best part was probably the ability to meet other brilliant scientists and students from around the world. In addition to thought-provoking discussions on science and research, we also had some incredible discussions on life in other countries with drastically different cultures. The other students made the entire summer even better, and I’m so happy I was able to participate in such an incredible experience. IIASA has a truly unique work environment, and everyone made us feel right at home. It really was a dream come true, and I’m so excited about the opportunity to return and pick up where I left off. The only thing missing will be my fellow YSSPers! I wish we could all come back every summer!
What was your favorite moment of the summer?
I think my favorite experience was the end of summer workshop and dinner and dance that followed. I was so impressed during the initial presentations and it was great to hear about all the progress that was made in the short three months. Celebrating this progress with a night of dancing and dining was just the perfect ending to a great summer. It was a bittersweet farewell, but I think it cemented our friendships and was a great capstone to an already dreamlike experience!

Danielle Haak (right) and fellow YSSPer Adriana Reyes, at the end-of-summer awards ceremony.
Note: This article gives the views of the interviewee, and not the position of the Nexus blog, nor of the International Institute for Applied Systems Analysis.
Oct 29, 2013 | Energy & Climate, Science and Policy
This post was originally published on the recharge.green blog. IIASA is a partner in the new project, which focuses on the potential for renewable energy in the Alps.
 When I think of an alpine forest, I think of the towering cedar trees that blanket the Cascade mountains near my native Seattle, with trunks so broad you can’t reach your arms around them. I think of the shadowy quiet that envelops me as I wander through a mountain forest in my new home in Austria. I think of the scent of pine needles and the bounce of my feet on a trail softened by forest litter. The value of a mature forest to people like me who love the outdoors—its recreational value—is impossible to put into numbers.
We can, however, calculate the effects of different styles of forest management on more quantifiable criteria. We can determine how much carbon dioxide is taken up from the atmosphere and stored by long-growing forests. And we can estimate how much bioenergy we can sustainably produce by managing forests for biomass harvesting.
This is exactly what IIASA scientists have done for their first efforts in the recharge.green project. IIASA’s role in the project is to use our modeling expertise to explore the various possibilities for renewable energy expansion in the Alps. We are also looking at the tradeoffs and benefits of the different possible scenarios and ecosystem services (ESS). As a first step, researchers Florian Kraxner, Sylvain Leduc , Sabine Fuss (now with MCC Berlin), Nicklas Forsell, and Georg Kindermann used the IIASA BeWhere and Global Forest (G4M) models look at the tradeoffs between bioenergy production or carbon storage in alpine forests.

These graphs show the first results for recharge.green from IIASA’s BeWhere and G4M models, optimizing the location of bioenergy plants to maximize either carbon sequestration (top) or bioenergy production (bottom). The gradiant of green colors shows the amount of carbon storage over the landscape, while the red boxes (and according gradient in red) show the harvesting intensity in different harvesting areas.
“Managing forests optimally for bioenergy requires more intensive management,” says Kraxner. That means shorter rotations where trees are cut more often. Such a forest is made up of smaller trees that may look more like “close-to-nature plantations” than an old-growth forest. In contrast, managing forests for carbon storage means letting the trees grow older, also good for biodiversity and environmental preservation.
In their analysis, Kraxner and the team compared two management strategies: restricting bioenergy production to a small land area, and managing it intensively, or spreading bioenergy over a large land area but managing less intensively over the whole area. They found that the same amount of bioenergy could be produced by managing a small amount of land area intensively for bioenergy production. This more intensive management on a small area of land would free up a larger land area for preservation and protection or other special dedication to ecosystem services.
“Both methods are sustainable,” says Kraxner, “but the optics are different. Intensification can be a good solution to provide renewable energy and at the same time preserve biodiversity and the more intangible values of mature forests.”
What do you think? What should our priorities be in managing Alpine forests?


You must be logged in to post a comment.