Jul 3, 2017 | Data and Methods, Food
By Victor Maus, IIASA Ecosystems Services and Management Program
Nowadays, satellite images are an abundant supply of data which we can use to get information about our planet and its changes. Satellite images can, for example, help us detect an approaching storm, measure the expansion of a city, identify deforested areas, or estimate how crop areas change over time. Usually, we are interested in extracting information from large areas, for example, deforestation in the Amazon Rainforest (5.5 million km², around 15 times the area of Germany). It would be challenging for us to monitor and map such vast areas without combining satellite images with automated and semi-automated computer programs.

Aerial view of the Amazon Rainforest, near Manaus, Brazil. Monitoring deforestation in the Amazon is difficult because the area is massive and remote. ©Neil Palmer | CIAT
To address this problem, I developed — along with my colleagues Gilberto Camara from the Brazilian National Institute for Space Research and Marius Appel and Edzer Pebesma from the University of Münster, Germany — a new open source software to extract information about land-cover changes from satellite images. The tool maps different crop types (e.g., soybean, maize, and wheat), forests, and grassland, and can be used to support land-use monitoring and planning.
Our software, called dtwSat, is open-source and can be freely installed and used for academic and commercial purposes. It builds upon on other graphical and statistical open-source extensions of the statistical program R. Adding to that, our article in press in Journal of Statistical Software is completely reproducible and provides a step-by-step example of how to use the tool to produce land-cover maps. Given that we have public access to an extensive amount satellite images, we also get much benefit from tools that are openly available, reproducible, and comparable. These, in particular, can contribute to rapid scientific development.
The software dtwSat is based on a method widely used for speech recognition called Dynamic Time Warping (DTW). Instead of spoken words, we adapted DTW to identify ‘phenological cycles’ of the vegetation. These encompass the plants’ life cycle events, such as how deciduous trees lose their leaves in the fall. The software compares a set of phenological cycles of the vegetation measured from satellite images (just like a dictionary of spoken words) with all pixels in successive satellite images, taken at different times. After comparing the satellite time series with all phenological cycles in the dictionary, dtwSat builds a sequence of the land-cover maps according to similarity to the phenological cycles.
The series of maps produced by dtwSat allows for land-cover change monitoring and can help answer questions such as how much of the Amazon rainforest has been replaced with soy or grass for cattle grazing during the last decade? It could also help study the effects of policies and international agreements, such Brazil’s Soy Moratorium, where soybean traders agreed not to buy soy from areas deforested after 2006 in the Brazilian Amazon. If soy farming cannot expand over areas deforested after 2006, it might expand to areas formerly used for cattle grazing deforested before 2006, and force the cattle grazing farmers to open new areas that have been cleared more recently. Therefore, besides monitoring changes, the land-cover information can help better understand direct and indirect drivers of deforestation and support new land-use policy.
Further info: dtwSat is distributed under the GPL (≥2) license. The software is available from the IIASA repository PURE pure.iiasa.ac.at/14514/. Precompiled binary available from CRAN at cran.r-project.org/web/packages/dtwSat/index.html
dtwSat development version available from GitHub at github.com/vwmaus/dtwSat
Reference:
Maus V, Camara G, Appel M, & Pebesma E (2017). dtwSat: Time-Weighted Dynamic Time Warping for Satellite Image Time Series Analysis in R. Journal of Statistical Software (In Press).
Maus, V, Camara, G, Cartaxo, R, Sanchez, A, Ramos, FM, & de Queiroz, GR (2016). A Time-Weighted Dynamic Time Warping Method for Land-Use and Land-Cover Mapping. IEEE Journal of Selected Topics in Applied Earth Observations and Remote Sensing 9 (8): 3729–39.
This article gives the views of the author, and not the position of the Nexus blog, nor of the International Institute for Applied Systems Analysis.
Apr 3, 2017 | Demography
By Roman Hoffmann, Wittgenstein Centre for Demography and Global Human Capital (IIASA, VID/ÖAW and WU), Vienna Institute of Demography, Austrian Academy of Sciences
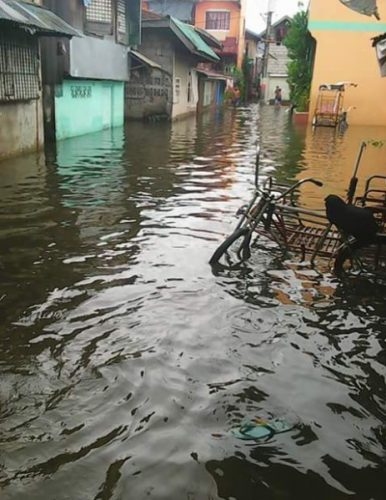
Flooded street in Meycauayan, Bulacan, Philippines (credit: Kasagana-Ka Development Center Inc., 2016 )
Floods, droughts, and tropical storms have significantly increased, both in frequency and intensity in recent years. The burden of these events—both human and economic—falls in large part on low and middle-income countries with high exposure, such as coastal and island nations. In a recent study, with IIASA researcher Raya Muttarak, we found that education significantly contributes to increasing disaster resilience among poor households in the Philippines and Thailand, two countries which are frequently affected by natural calamities.
In these countries, public disaster risk reduction is important, yet public measures, such as investments in structural mitigation for large buildings or infrastructure, implementation of early warning systems, or planned evacuation routes and shelters, may not be enough to sufficiently protect communities from the devastating impacts of natural calamities. In addition, the undertaking of individual preparedness measures by households, such as stockpiling of food and water, strengthening of house structures, and having a family emergency plan, is crucial. Yet, even in areas which are heavily exposed to disasters, people often do not take any precautionary measures against environmental threats.
How people can be motivated to take precautionary action has been a fundamental question in the field of risk analysis. In the new study, which was based on face-to-face interviews in both Thailand and the Philippines, we found that prior disaster experience, which is influenced by geographical location of the home, is one of the key predictors of disaster preparedness. For those who were affected by a disaster in the recent past, education does not seem to play a significant role—they have already learned by experience. However, among those who had not previously been affected, educational attainment becomes a key determinant. Even without having experienced a disaster, the educated are more likely to make preparations. In fact, educated people who haven’t experienced a disaster have preparedness levels that are as high as those of households who were only recently affected. Since education improves abstract reasoning and abstraction skills, highly educated individuals may not need to experience a disaster to understand that they can be devastating. This suggests that education, as a channel through which individuals can learn about disaster risks and preventive strategies, may effectively serve as a substitute for (often harmful) disaster experiences as a main trigger of preparedness actions.
In additional analyses, we investigated through which channels education promotes disaster preparedness by looking at the relationship between education and different mediating factors such as income, social capital and risk perception, which are likely to influence preparedness actions. We found that how education promotes disaster preparedness is highly context-specific. In Thailand, we found that the highly educated have higher perceptions of disaster risks that can occur in a community as well as higher social capital (measured by engagement in community activities) which in turn increase disaster resilience. In the Philippines, on the other hand, it appears that none of the studied mediating factors explain the effect of education on preparedness behavior.
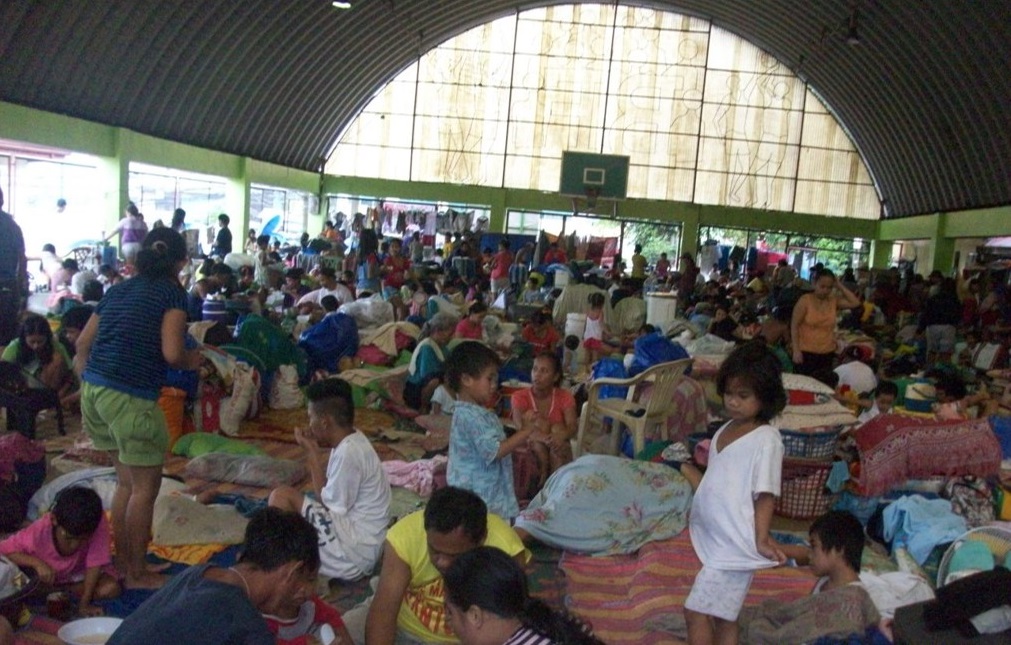
Emergency shelter, San Mateo, Rizal, Philippines (credit: Kasagana-Ka Development Center Inc., 2013 )
Certainly, it remains important for national governments to invest in disaster risk reduction measures such as early warning systems or evacuation centers. However, our study suggests that public funding in universal education will also benefit precautionary behavior at the personal and household level. In line with recent efforts of the UN to promote education for sustainable development, our study provides solid empirical evidence confirming the important role of education in building disaster resilience in low and middle-income countries.
Reference
Hoffmann, R. & Muttarak, R (2017). Learn from the past, prepare for the future: Impacts of education and experience on disaster preparedness in the Philippines and Thailand. World Development [doi:10.1016/j.worlddev.2017.02.016]
This article gives the views of the author, and not the position of the Nexus blog, nor of the International Institute for Applied Systems Analysis.
Mar 21, 2017 | Climate Change, Energy & Climate, Science and Policy, Young Scientists
By Jessica Jewell, IIASA Energy Program
Why have Germany and Japan, two large, and in many respects similar developed democracies pursued different energy options? A recently published study examines why Germany has become the world’s leader in renewable energy while phasing out its nuclear power and Japan has deployed only a trivial amount of renewables while constructing a record number of nuclear reactors.
The widespread story is that Germany rejected nuclear power in a politically bold move after Fukushima and instead pursued ‘Energiewende’ prioritizing wind and solar energy to combat climate change. Leading scholars such as Amory Lovins described Japanese policymakers as manipulated by the nuclear lobby, clinging to their old ways, and unwilling to properly support renewable energy. The lesson to other countries is that public anti-nuclear sentiments and a capable democratic government is what it takes to turn to decentralized renewable energy.
This research shows that these stories are myths. As I and my coauthor wrote in a letter to the editor in Nature last year, Japan had ambitious renewable targets already before Fukushima and there is no evidence that these have been affected by its nuclear plans. The same holds for Germany: its targets for renewable energy were not affected by the change in its nuclear strategy following Fukushima’s disaster in 2011.
© nixki | Shutterstock
In fact, the differences between Germany and Japan started not in 2011 after Fukushima, but some 20 years earlier in the early 1990s when Japan’s electricity consumption was rapidly growing and it desperately needed to expand electricity generation to feed demand that could not be matched with very scarce domestic fossil fuels. Furthermore, Japan was developing ‘energy angst’ related not only to its high dependence on Middle Eastern oil and gas but also to potential competition with China’s with its rising appetite for energy. At the same time, Germany’s electricity consumption stagnated in the 1990s and its energy security improved following the end of the Cold War. Germany was also one of the world’s largest coal producers and could in principle supply all its domestic electricity from coal. As a result, in the 1990s, Japan was forced to build nuclear power plants, but Germany could easily do without them.
There was another important development in the early 1990s: wind power technology diffused to Germany from neighboring Denmark. This was triggered by an electricity feed-in-law of 1990s, which obliged German electric utilities to buy electricity from small producers at close-to-retail prices. The law, which aimed to benefit a small number of micro-hydro plant owners, unexpectedly led to almost a 100-fold rise in wind installations in Germany. Although still insignificant in terms of electricity, this development created a large and vocal lobby of owners and manufacturers of wind turbines. In the early 2000s, the wind sector provided less than one-tenth of nuclear electricity but had more jobs than in the nuclear sector. In contrast, Japan’s similar policies of buying wind energy from decentralized producers did not result in any considerable growth of wind power, because the Danish technologies prevalent in the early 1990s could not be as easily diffused to Japan.
By the turn of the century, the electricity sectors in Germany and Japan still looked largely similar, but the political dynamics could not be more different. In Germany, a huge politically-powerful coal sector was represented by Socio-Democratic Party and the so-called ‘red-green’ coalition was formed with the Green party, who represented the rapidly growing wind power sector. The stagnating nuclear industry, however, had not seen new domestic orders or construction for 15 years and large industrial players like Siemens had begun to diversify away from it. All this was in the context of a positive energy security outlook and declining electricity prices. In contrast, in Japan, the nuclear sector had vigorously grown over the last decade and was becoming globally dominant by acquiring significant manufacturing capacities. Nuclear power was the only plausible response to the energy angst and it lacked any credible political opponents: the domestic coal sector in Japan virtually did not exist (Germany had around 70,000 coal mining jobs, Japan – about 1,000) and wind had never taken off.
© Pla2na | Shutterstock
The results of these very different political dynamics were predictably different: the red-green coalition in Germany legislated nuclear phase-out in 2002 and unprecedented financial support for renewables in 2000, while retaining coal subsidies and triggering construction of new coal power plants. Japan continued to support solar energy in which it had been the global leader since the 1970s but it also adopted a plan for constructing many more nuclear reactors designed to substitute imported fuels. Fukushima, rather than highlighting differences actually made the energy trajectories of two countries more similar as both countries began to struggle to replace their aging nuclear capacities with new renewables.
How does this story relate to wider questions such as: why are some countries more successful in deploying renewables than others? The answer is not in ‘stronger political will’ and in the strength of climate change concerns, but in economy, geography, and the structure of energy systems. Political wins for renewables and the climate can also be the result of dubious political compromises such as the alliance with the coal lobby in Germany, which led to the rapid growth of renewables and demise of nuclear power. It may be particularly difficult for countries with fossil fuel resources to implement renewable energy policies if they lead to the contraction of domestic coal, gas or oil industries.
Reference: Cherp A, Vinichenko V, Jewell J, Suzuki M, & Antal M (2016). Comparing electricity transitions: A historical analysis of nuclear, wind and solar power in Germany and Japan. Energy Policy 101: 612-628.
Acknowledgements
The study was supported by the CD-LINKS project and the Central European University’s Intellectual Theme’s Initiative.
This article gives the views of the author, and not the position of the Nexus blog, nor of the International Institute for Applied Systems Analysis.
Feb 21, 2017 | Citizen Science
By Linda See, IIASA Ecosystems Services and Management Program
One of the biggest questions when it comes to citizen science is the quality of the data. Scientists worry that citizens are not as rigorous in their data collection as professionals might be, which calls into question the reliability of the data. At a meeting this month in Brussels on using citizen science to track invasive species, we grappled with the question: what it will take to trust this data source, particularly if it’s going to be used to alert authorities regarding the presence of an invasive species in a timely manner.
This discussion got me thinking about what other types of data are supplied by citizens that authorities simply trust, for example, when a citizen calls the emergency services to report an incident, such as a fire. Such reports are investigated by the authorities and the veracity of the alert is not questioned. Instead authorities are obliged to investigate such reports.
Yet the statistics show that false alarms do occur. For example, in 2015, there were more than 2.5 million false fire alarms in the United States, of which just under a third were due to system malfunctions. The remaining calls were unintentional, malicious, or other types of false alarms, such as a bomb scare. Statistics for calls to the emergency services more generally show similar trends in different European countries, where the percentage of false reports range from 40% in Latvia up to 75% in Lithuania and Norway. So why is it that we inherently trust this data source, despite the false alarm rate, and not data from citizen scientists? Is it because life is threatened or because fires are easier to spot than invasive species, or simply because emergency services are mandated with the requirement to investigate?
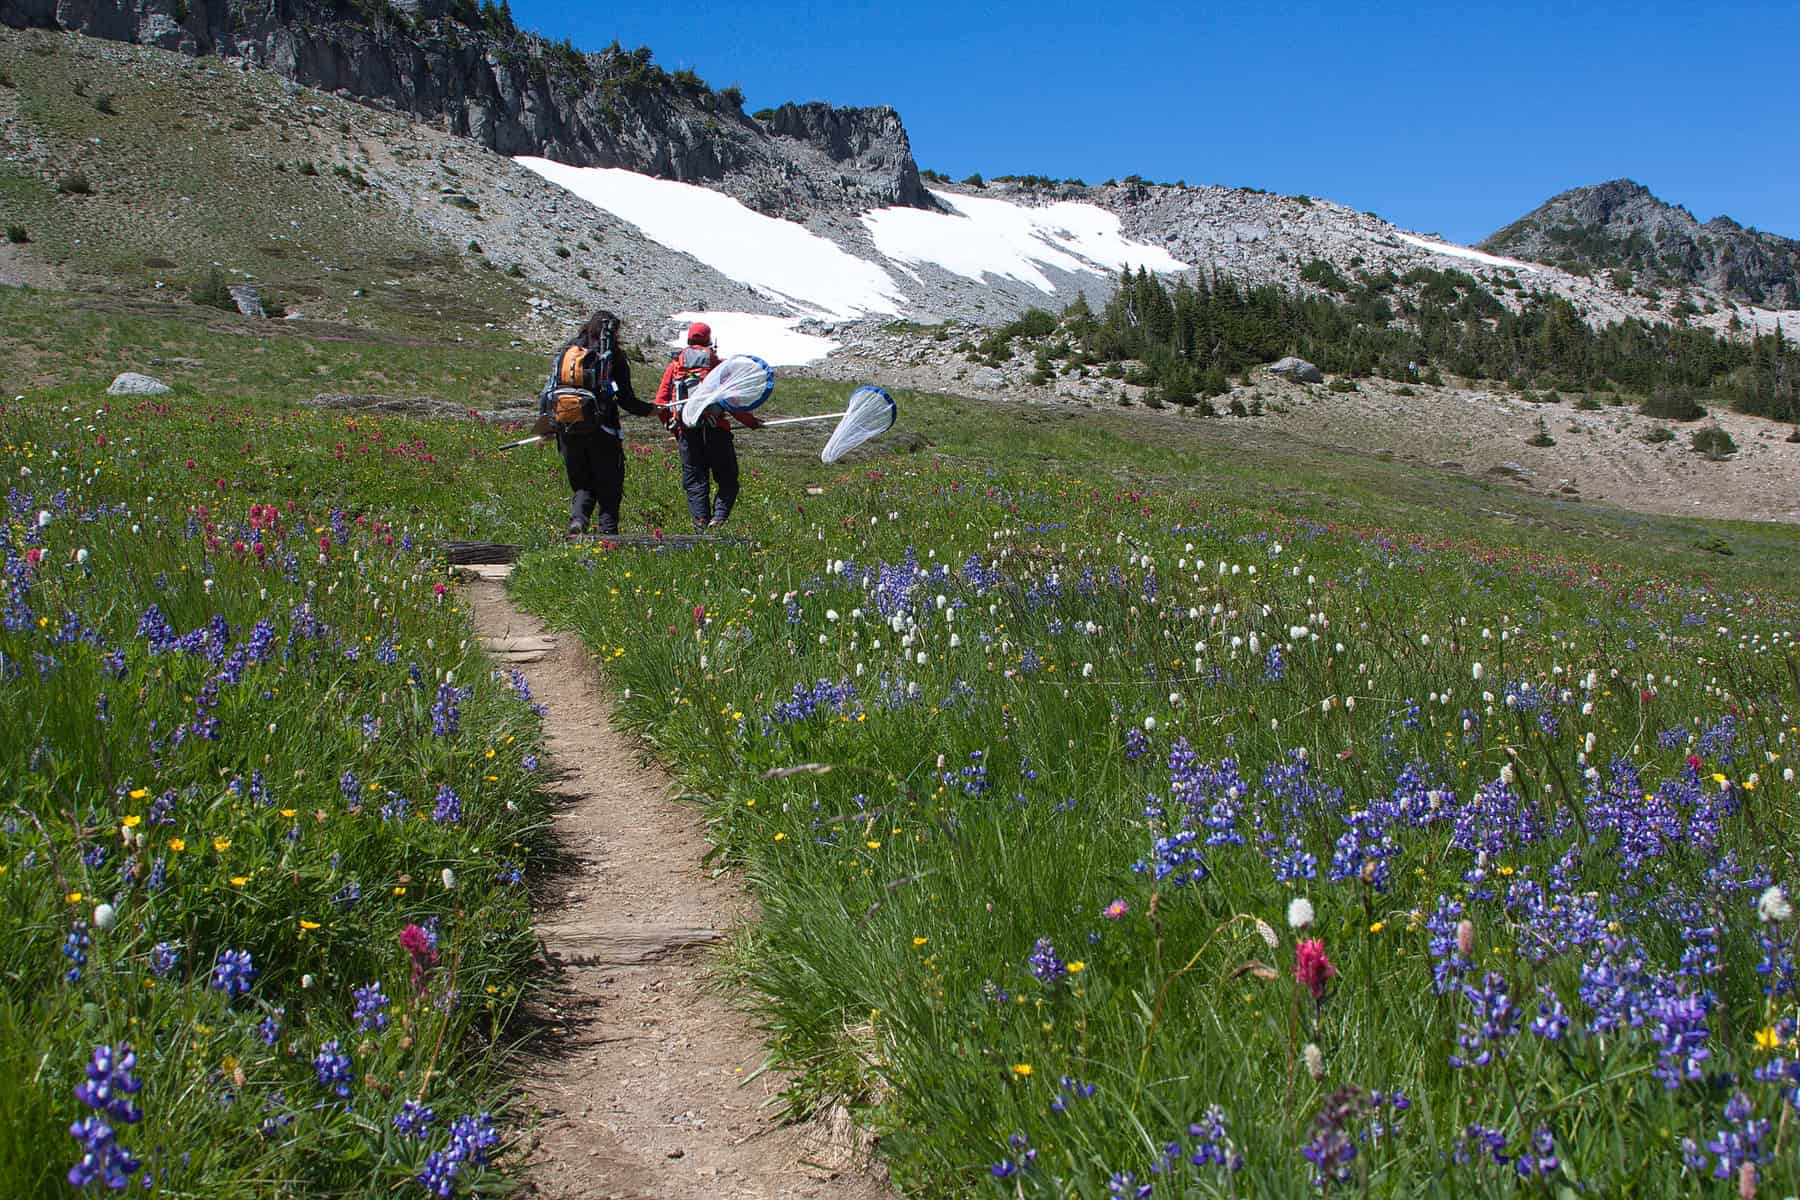
Volunteers monitor butterflies in Mount Rainier National Park, as part of the Cascade Butterfly Project, a citizen science effort organized by the US National Park Service © Kevin Bacher | US National Park Service
A recent encouraging development for citizen science was the signing of an executive order by President Obama on 6 January 2017, which gave federal agencies the jurisdiction to use citizen science and crowdsourced data in their operations. Do we need something similar in the EU or at the level of member states? And what will it really take for authorities to trust scientific data from citizens?
To move from the current situation of general distrust in citizen science data to one in which the data are viewed as a potentially useful source of information, we need further action. First we need to showcase examples of where data collected by citizens are already being used for monitoring. At the meeting in Brussels, Kyle Copas of the Global Biodiversity Information Facility (GBIF) noted that up to 40% of the data records in GBIF are supplied by citizens, which surprised many of the meeting participants. Data from GBIF are used for national and international monitoring of biodiversity. Secondly, we need to quantify the value of information coming from citizen scientists. For example, how much money could have been saved if reports on invasive species from citizens were acted upon? Third, we need to forge partnerships with government agencies to institutionally embed citizen science data streams into everyday operations. For example, the LandSense citizen observatory, a new project, aims to do exactly this. We are working with the National Mapping Agency in France to use citizen science data to update their maps but there are many other similar examples with other local and national agencies that will be tested over the next 3.5 years.
Finally, we need to develop quality assurance systems that can be easily plugged into the infrastructure of existing organizations. The EU-funded COBWEB project began building such a citizen science-based quality assurance system, which we are continuing to develop in LandSense as a service. Providing out-of-the-box tools may be one solution to help organizations to begin working with citizen science data more seriously at an institutional level.
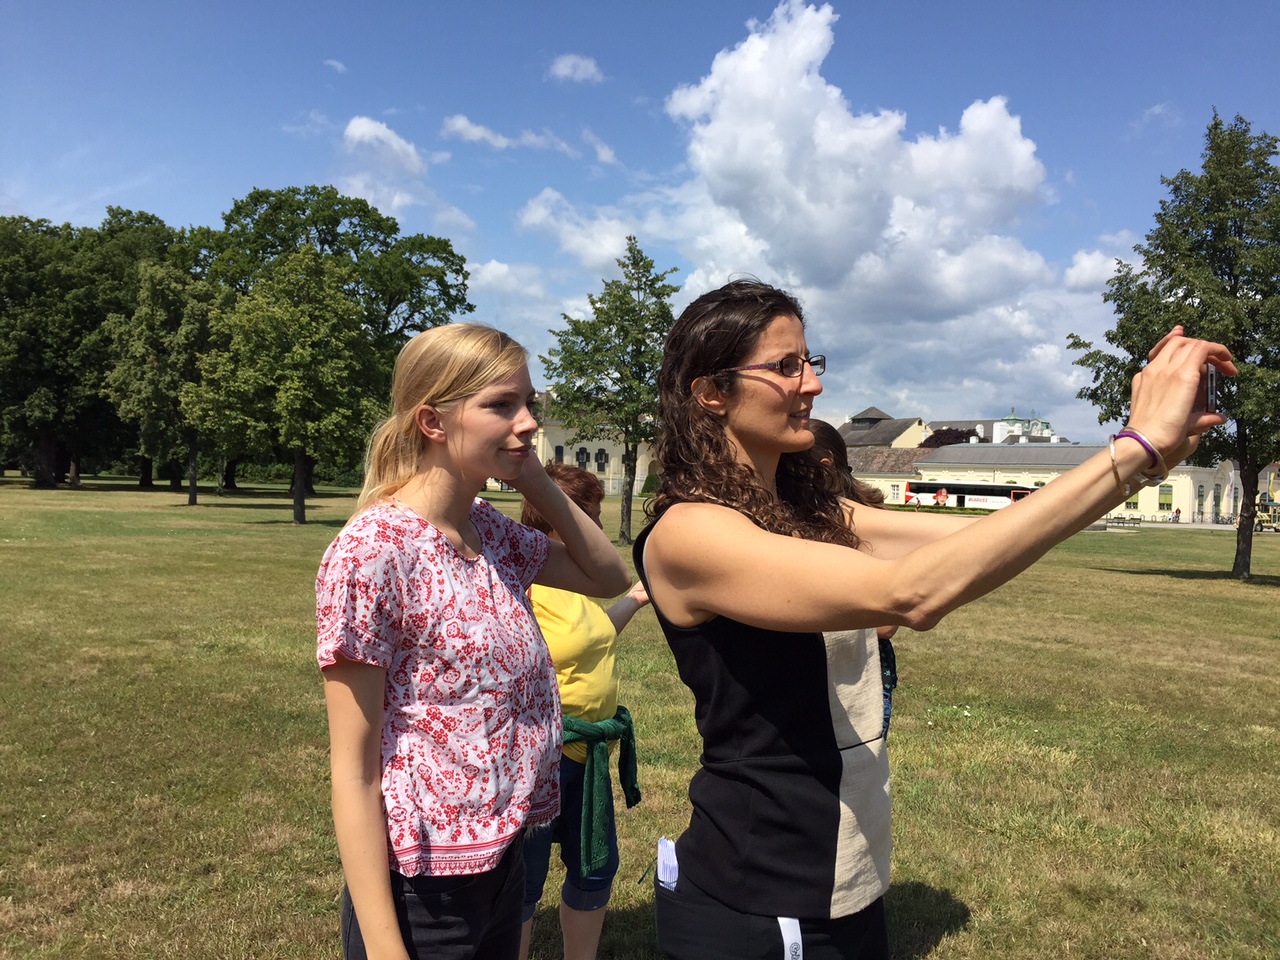
IIASA researchers test the Fotoquest app, a citizen science game developed at IIASA. ©Katherine Leitzell | IIASA
These measures will clearly take time to implement so I don’t expect that the discussion on the quality of the data will be removed from any agenda for some time to come. However, I look forward to the day when the main issue revolves around how we can possibly handle the masses of big data coming from citizens, a situation that many of us would like to be in.
More Information about the meeting: https://ec.europa.eu/jrc/en/event/workshop/citizen-science-open-data-model-invasive-alien-species-europe
This article gives the views of the author, and not the position of the Nexus blog, nor of the International Institute for Applied Systems Analysis.
Dec 5, 2016 | Climate Change, Environment, Sustainable Development
By Alvaro Silva Iribarrem, researcher in the IIASA Ecosystems Services and Management Program.
Restoration of degraded ecosystems is an exciting and relatively new way of looking into the conservation of natural capital—the world’s natural assets, including soil, air, water, and all living things. For one, the success of restoration is more readily verifiable than, for example, avoided degradation. Further, it increases the landscape’s resilience: natural areas can be placed around agricultural crops, increasing their yields by providing habitat for pollinators and therefore increasing pollination, protecting them from natural disasters, and improving the provision of important ecosystem services for human wellbeing.
These services include removing CO2 from the atmosphere (which contributes directly to climate change mitigation); ensuring that more sediment is filtered from the rivers (which reduces the risk of landslides and floods); and providing habitat for a large diversity of species. For scientists, it feels like being at the head of the counter-offensive: it is us, humans, finally doing something not only to slow our seemingly unstoppable degradation of the environment, but to actively start pushing it back.
Restoring an ecosystem to its original state can be an expensive endeavor, but tropical rainforests are very resilient. For example, even after centuries of extensive use of the Brazilian Atlantic Forest, which has been reduced to a tenth of its size, in many places it would still grow back to much of its original state in a manner of decades, if allowed to do so. For such ecosystems, natural regeneration represents an extraordinary opportunity to enable restoration at scales that would otherwise be cost-prohibitive.
In places like the Paraitinga watershed, in the countryside of São Paulo state, most of the original forest has long been cleared, and replaced, predominantly, by small dairy farms. After over a century of careless land use, large areas of the converted landscape has degraded to the point where yields are so low that farms are barely viable. The lack of forest cover has led to frequent floods. The worst of the recent ones, in 2010, destroyed most of the historical city of São Luiz do Paraitinga, with a population of 11 thousand inhabitants.
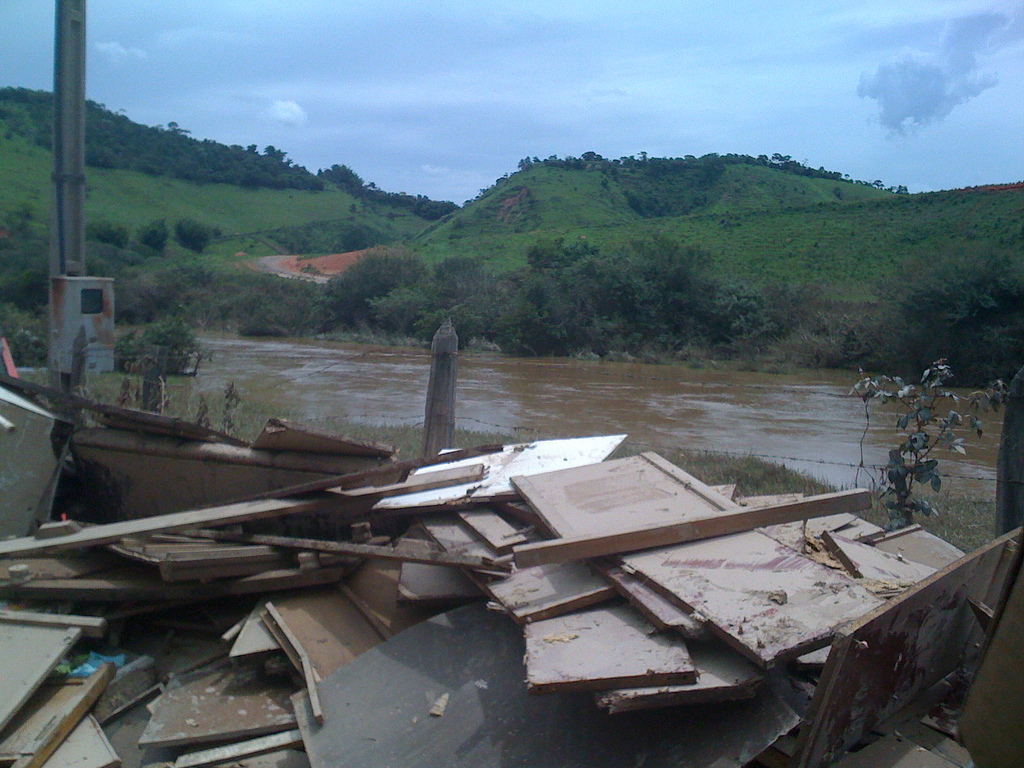
The aftermath of the 2010 flood in Paraitinga. © Luciano Dinamarco
In a couple of recent publications, we made a comprehensive effort to include the natural regeneration of that watershed’s native forest as part of a bigger plan for more sustainable development of the region, one that would increase its resilience to this kind of disaster.
Starting from a landscape approach, we looked at the potential for grass growth in the region, and concluded that it was possible to accommodate all foreseeable future demands for cattle production and still make space for the restoration of a large area in the watershed. Sustainable intensification of current pasture is key to avoid the economic losses that could otherwise follow the land shortage caused by such a large-scale restoration. It would also help to gain the farmers’ acceptance. By producing more in a smaller area, they could let go of the degraded areas they currently use, allowing the native forest fragments nearby to spread.
In our regeneration scenario, we assume that around 24,000 hectares of pastureland that is presently abandoned in the watershed will be allowed to undergo natural regeneration in the next 20 years. This naturally occurring forest regrowth would sequester 6.2 million tons of CO2 from the atmosphere. Additionally, it would reduce sediment load into rivers by 570,000 tons annually, bringing water purification costs in the area down by 0.37 dollars per year per hectare restored. Finally we showed that restoration of even this relatively small area would be enough to significantly increase habitat availability for all species, particularly for those which travel between forest fragments.
To understand the difficulties farmers face in improving productivity, we conducted interviews and focus groups with them. We found that the tendency to keep to their old, low-producing, land-extensive ways, is less related to a resistance to change, and more to a lack of technical knowledge and the means to make the upfront investments needed to switch to a more productive system. Credit for investment is available and cheap in the country, but only a small number of farmers in the region risk taking it. Technical assistance is key to tap into these resources and enable the necessary improvement of the watershed’s production. The conditions for unlocking large-scale forest regrowth, not only in the Paraitinga watershed but in many similar landscapes in the country, are in place—they need only to be implemented properly.
Strassburg BB, Barros FS, Crouzeilles R, Silva Iribarrem, A, dos Santos JS, Silva D, Sansevero JB, Alves-Pinto H, Feltrain-Barbieri R, & Latawiec AE (2016). The role of natural regeneration to ecosystem services provision and habitat availability: a case study in the Brazilian Atlantic Forest. Biotropics.
Alves-Pinto HN, Latawiec AE, Strassburg BBN, Barros FSM, Sansevero JBB, Iribarrem A, Crouzeilles R, Lemgruber LC, Rangel M, & Silva ACP (2016). Reconciling rural development and ecological restoration: Strategies and policy recommendations for the Brazilian Atlantic Forest. Land Use Policy.
This article gives the views of the author, and not the position of the Nexus blog, nor of the International Institute for Applied Systems Analysis.

You must be logged in to post a comment.