Apr 7, 2016 | Environment
By Andrey Krasovskii, IIASA Ecosystems Services and Management Program
By 2090, the area burned by forest fires in the European Union could increase by 200% because of climate change. However, preventive fires could keep that increase to below 50%. Improved firefighting response could provide additional protection against forest fires. These findings were the result of modeling work we did for the EU Mediation project on projecting future burned areas and adaptation options in Europe. When we talk about these results, people often want to know more about how our model works, what assumptions it makes, and how reliable it is.
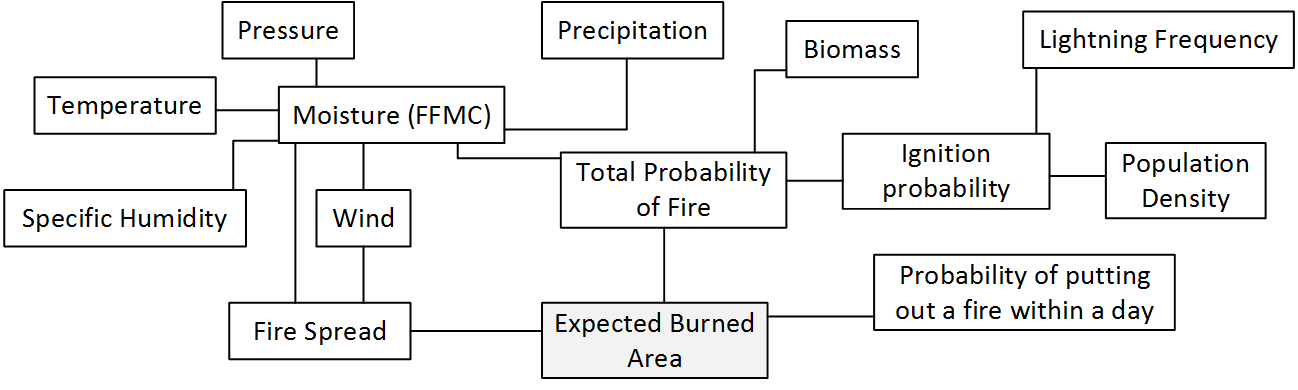
Figure 1. The WildFire cLimate impacts and Adaptation Model (FLAM) schematic – estimation of expected burned area.
The model is complex: every link in the schematic shown above represents a specific mathematical formula. These formulas have been developed by many researchers who studied how wildfire occurrence is related to climate, population, and biomass available for burning. Their results have been aggregated into mathematical relations and functions attempting to replicate real processes. The model code runs through the scheme with daily weather inputs in order to calculate the potential for fire ignition, spread, and burned areas. The model transforms spatial and intertemporal inputs into expected burned areas for 25km squares across the entirety of Europe. These squares can be summed up into geographic regions, e.g. countries, as well as burned areas can be aggregated over a given time period, e.g. 10 years.
It took days for our colleague Mirco Migliavacca to run the model during his work at the Joint Research Center of the European Commission. In fact, the scheme depicted in Figure 1 shows only a small piece of a larger picture reflecting the Community Land Model with the integrated fire module (CLM-AB), which he used. CLM-AB calculates all inputs in the indicated fire module, based on modeling processes in the global vegetation system. To speed up the running times for the case study focused on the wildfires in Europe, my colleague Nikolay Khabarov developed a standalone version of the fire model by decoupling the fire module from CLM-AB. When I joined the study, we had also found alternatives for input data, e.g. IIASA’s Global Forest Database, and implemented additional procedures in order to create our wildfire climate impacts and adaptation model (FLAM).
We used the historical data from satellite observations in order to validate modeling results. At the beginning many numerical experiments in CLM and FLAM did not give satisfactory results – there was either overestimation or underestimation of modeled burned areas compared to those reported in available datasets. One day a purely mathematical insight happened. We realized that in the fire algorithm implemented in FLAM, there is a parameter that can be factorized, mathematically speaking. This parameter, a probability of extinguishing a fire in a pixel in one day, was constant for Europe and set to 0.5. It became obvious that this parameter should vary with respect to a region. Factorization of this variable gave a possibility to avoid routine calculations, and use it for calibrating the model over a historical period. This can be done analytically by solving a corresponding polynomial equation. Analytical findings allowed us to introduce an effective calibration procedure and at the same time to estimate a firefighting efficiency on a country level. Further, using the advice of our colleagues Anatoly Shvidenko and Dmitry Schepaschenko, we have introduced adaptation options in the model, for example prescribed burnings, which firefighters use to reduce the fuel availability and, consequently, potential of a major fire.
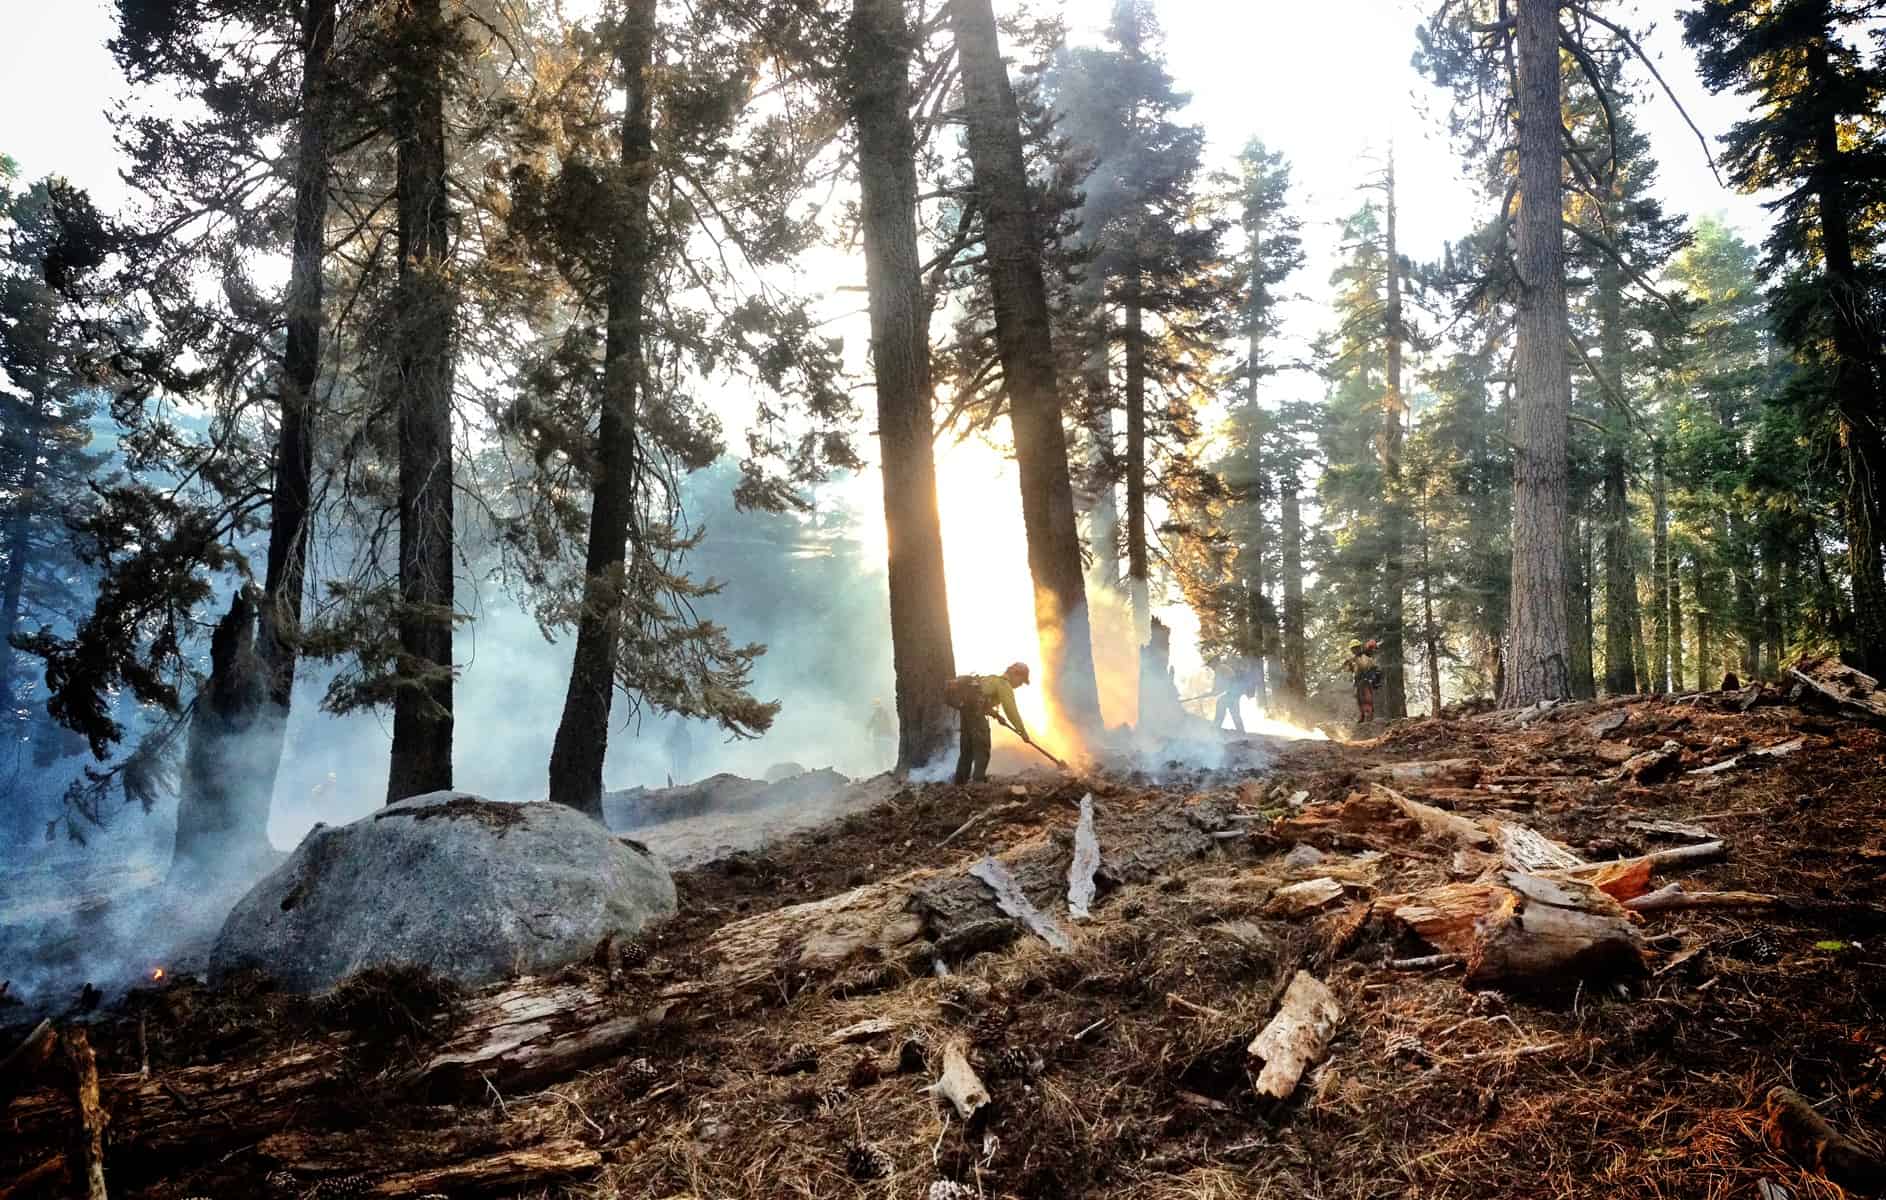
Prescribed burnings are one tool that can help prevent major wildfires. (cc) US Bureau of Land Management via Flickr
Once we had calibrated the model so that it adequately performed on the historical period (using historical climate data), we used climate scenarios to produce future projections. Currently, we are working on further improvements in modeling accuracy in annual burned areas by introducing additional regionally specific factors in the model. In the recent study published in the International Journal of Wildland Fire, we suggested improving the original model by modifying the fire probability function reflecting fuel moisture. This modification allows for a dramatic improvement of accuracy in modelled burned areas for a range of European countries.
Despite some success in modeling annual burned areas in Europe, we still have difficulties in predicting the extreme fires, in particular in some more arid and hence vulnerable regions such as Spain. However, we accept the challenge, because credible modeling results in terms of burned areas provide important information for assessing economic damages and CO2 emissions, due to climate and human activities. Our research has the potential to help society to realize these risks and undertake preventive measures. It also delivers an additional scientific value due to the fact, that fire risks must be included in forest management models.
I would like to thank all the study co-authors for their valuable contributions and efficient collaboration.
Reference
Krasovskii, A., Khabarov, N., Migliavacca, M., Kraxner, F. and Obersteiner, M. (2016) Regional aspects of modelling burned areas in Europe. International Journal of Wildland Fire. http://dx.doi.org/10.1071/WF15012
Note: This article gives the views of the interviewee, and not the position of the Nexus blog, nor of the International Institute for Applied Systems Analysis.
Sep 4, 2014 | Systems Analysis
At IIASA in Laxenburg this week, renowned mathematician Don Saari laid out a challenge for the Institute’s scientists: to better understand complex systems, he said, researchers must find better ways to model the interactions between different factors.
“In a large number of models, we use climate change or other factors as a variable. What we’re doing is throwing in these variables, rather than representing interactions—like how does energy affect population?” said Saari, a longtime IIASA collaborator and council member, and newly elected IIASA Council Chair, a position he will take up in November. “The great challenge of systems analysis is figuring out how to connect all the parts.”
“Whenever you take any type of system and look at parts and how you combine parts, you’re looking at a reductionist philosophy. We all do that in this room,” said Saari. “It is the obvious way to address a complex problem: to break it down into solvable parts.”
 The danger of reductionism, Saari said, is that it can turn out completely incorrect solutions—without any indication that they are incorrect. He said, “The whole may be completely different than the sum of its parts.”
Take a Rubik’s cube as an example: Saari said “If you try to solve it by first doing the red side, then the green, then the blue, you will end up with a mess. What happens on one side is influenced by what’s happening on all the other sides.”
In the same way, the world’s great systems of energy, water, climate all influence each other. During the discussions, IIASA Deputy Director Nebojsa Nakicenovic noted that current work to extend the findings of the Global Energy Assessment to include water resources could narrow the potential number of sustainable scenarios identified for energy futures by more than half.
Saari pointed out that many of the world’s great scientists—including Nobel Prize winner Tom Schelling and Kyoto prize winner Simon Levin, both IIASA alumni—reached their groundbreaking ideas by elucidating the connections between two different fields.
It may sound like a simple solution to a methodological challenge. However, understanding the connections and influences between complex systems is far from simple. As researcher Tatjana Ermoliova pointed out in the discussion, “In physical systems you can hope to observe and discover the linkages.” But between human, economic, and global environmental systems those linkages are elusive and fraught with uncertainty.
At the end of the lecture, IIASA Director & CEO Prof. Dr. Pavel Kabat turned the challenge towards IIASA scientists, and we now extend it also to our readers: How can scientists better model the connections between systems, and what needs to change in our thinking in order to do so?
Jan 7, 2014 | IIASA Network, Systems Analysis
On October 15, 2012, a young man from Bangladesh named Quazi Mohammad Rezwanul Ahsan Nafis parked next to New York Federal Reserve Bank in a van with what he believed was a 1000-pound bomb, walked a few blocks away, and then attempted to detonate the bomb by mobile phone.
In fact, the bomb was a fake, supplied by undercover agents for the United States FBI. The agents, posing as radical jihadists, had led Nafis along for months, allowing him to believe they were fellow terrorists and gathering information about his plot. The cover was maintained until the moment when his bomb failed to detonate, and Nafis was arrested. Disaster averted.
Researchers at IIASA study many risks to society, from floods, hurricanes, and natural disasters, to the impacts of climate change on future generations. They use models that can help disentangle the costs and benefits of different policies that could help prevent damage or deaths, or mitigate the impacts of global problems like climate change and air pollution. Could the same techniques apply to the dangers of terrorism and jihadists attacks? Could systems analysis help inform intelligence agencies in order to stop more terrorist attacks?

Could systems analysis techniques help guide policies to prevent terrorist attacks? Image Credit: Vjeran Pavic
Yale University Professor Ed Kaplan has done just that in work that he presented at IIASA in late December 2013. His research, which has intersected with IIASA in the past through collaborations with former IIASA Directors Howard Raiffa and Detlof von Winterfeldt, uses operations research to find ways to improve intelligence operations so as to catch more terrorists, before an attack can take place.
Kaplan, an expert on counterterrorism research, refined a simple economic model of customer service, known as a “queuing model” to instead represent the evolution of terror plots by terrorists, and interaction between the terrorists and the undercover agents who are working to uncover those plots.
“The best way to stop an attack is to know it’s about to happen beforehand,” says Kaplan. That means, in large part, having enough agents in the right places to detect attacks. But how many agents is the right number?
At IIASA, Kaplan described his terrorist “queuing model,” which can be applied to show how much a given number of agents would be likely to decrease attacks. Queuing models are an operations research method used to understand waiting times in lines, such as what happens at restaurants, offices, telephone queues or even internet servers.
But in the standard model, customers want to be served, and the servers know who the customers are. In Kaplan’s terrorist model, the terrorists – customers –don’t want to be served, and the servers—the agents—don’t know where their customers are. By modifying the model to account for those differences, Kaplan can answer some tricky questions about the best way for intelligence agencies to fight terrorism.
“Even if you don’t know how many terrorists there are or where they are, you can make it more likely that they will show themselves, you can make it more difficult for them to carry out an attack,” says Kaplan.

Kaplan’s method provides estimates of the numbers of undetected terrorist plots, as well as what it would take to increase detection rates.
Using data from court records of terrorism cases, Kaplan refined his models to include the average time that a terror plot is active – that is, the time from when a terrorist group first starts a plot, to the time that they are either caught, or the attack takes place. Based on the data, he could then calculate how many terror plots were likely to be in progress at any one time. He could also estimate the probability of detecting those plots, and how much that probability could be increased by employing more agents. For example, the model calculates that by increasing FBI agents by a factor of two would increase the detection rate from 80% to 89%.
But the data also point to one disturbing conclusion: A 100% detection rate is impossible. As the number of agents increases, the detection rate increases in ever smaller increments. Kaplan says, “We have to decide how safe is safe enough. When should we stop putting money into Homeland Security, and start putting more back into education and health?”
Download Kaplan’s IIASA presentation (PDF, 2.8 KB)
Note: This article gives the views of the author, and not the position of the Nexus blog, nor of the International Institute for Applied Systems Analysis.
00


You must be logged in to post a comment.