Jun 2, 2016 | Climate Change
By Katherine Leitzell, IIASA science writer and press officer (and cyclist)
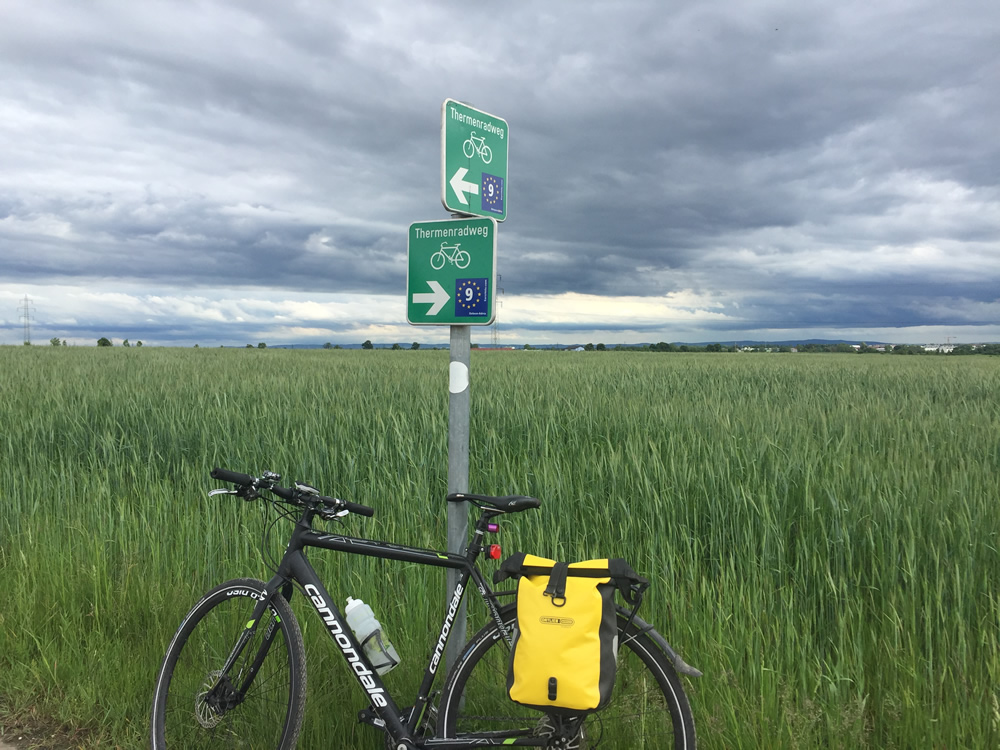
In May over 50 IIASA staff members took part in the Austrian Bike to Work month (Osterreich Radelt zur Arbeit), logging 11,681 kilometers riding to and from the institute in Laxenburg. The institute took fifth place in Austria in terms of kilometers ridden, and first place in Lower Austria.
According to the Austrian initiative’s calculations, this effort translated into saving over 1900 kg of CO2 emissions, or on average 36 kg per person—which is approximately 4% of an average Austrian’s monthly CO2 emissions. However, this calculation assumed that each of the IIASA cyclists would have been otherwise driving alone in a car. Since many people ride the bus or take public transport if they’re not biking, the actual emission savings from our cycling efforts in May were in fact much less. In fact, since buses and trains run anyway, cycling to work may make no impact whatsoever on emissions of air pollution and greenhouse gas emissions. Does that mean it’s not worth it to make the effort?
The author’s route to the office. © Katherine Leitzell | IIASA
IIASA researcher Jens Borken has analyzed the impacts that our daily travel has on the individual climate footprint. Personal mobility—all kinds of travel—make up about one third of the average European’s annual greenhouse gas emissions: the rest come from consumption choices and household heating and energy use. Of the carbon footprint from mobility, he says, commuting generally only makes up 10-15% of that. The largest part of the mobility budget is related to shorter and longer distance leisure travel, and in particular from air travel.
“From a quantitative perspective, the climate benefit of riding your bike is small, but it can be one step on a path to a low-carbon lifestyle.” says Borken. “As researchers who work on climate change, riding a bike to work (and possibly further) brings one piece of our lives in line with the message that avoiding fossil fuel consumption is imperative. I think that that is valuable. But it need not stop there. Travel choices are important, especially for longer distances, but so are consumption choices and energy usage and efficiency.”
Charlie Wilson, a researcher at the Tyndall Centre and IIASA, recently won a grant from the European Research Council to explore the role that social influence plays in spreading climate innovations. He says, “As social animals we are strongly influenced by what others do; as psychological beings we strive for consistency. Changing a behavior – like cycling to work – may have a small impact in isolation. But this impact is magnified through positive spillover effects. Others may imitate or be inspired by our commitment to cycling. And this change in behavior may also strengthen the pro-environmental aspects of our own self-identity, reducing dissonance between our work and domestic lives, and supporting further changes in behavior.”
Of course there are benefits of cycling beyond the environmental or climate impact, which is one reason that once they start, many people keep it up. Cycling regularly can save money compared to commuting by car or public transport, and like any regular form of exercise, it can bring health benefits and stress relief. It also brings autonomy and flexibility compared to public transport.
Borken points to research showing that the health benefits of cycling outweigh the exposure to air pollutants that a cyclist might experience on busy city streets—and that automobile drivers are exposed to even higher levels of air pollution within their cars. Cyclists who ride to IIASA, located about 15km outside Vienna, probably have even lower exposure to air pollution riding along tree-lined bike paths.
“Riding to work in the morning wakes me up and prepares me for the day ahead. Even if windy and challenging, the return in the evening calms the mind while riding with colleagues at a pace that allows us to chat at the end of a busy workday. It’s truly one of the best ways to get exercise and stay healthy – good for the heart, good for the environment and, most importantly, good for the soul,” says Michaela Rossini, manager of the IIASA library and a co-organizer of Bike to Work Month at the institute.

For some staff members, one side benefit of cycling to IIASA is the beautiful sunrise along the Danube River ©Michaela Rossini | IIASA
Note: This article gives the views of the author, and not the position of the Nexus blog, nor of the International Institute for Applied Systems Analysis.
Mar 15, 2016 | Alumni, Environment, Young Scientists
By Carlijn Hendriks, Netherlands Organization for Applied Scientific Research (TNO) & IIASA Peccei award winner
Last summer, I participated in IIASA’s Young Scientist Summer Program, working with the Mitigation of Air Pollution and Greenhouse Gases and Ecosystems Services and Management programs. My research focused on what impacts the EU climate and air quality policy could have on ground level ozone around the middle of this century. While clean air policies should help reduce the pollution that can lead to ozone formation, we found that that climate change and energy policies will still increase ozone concentrations and damage by mid-century, unless stricter air pollution measures are implemented.

Ozone forms through reactions of various pollutants and chemicals in the atmosphere – a process that speeds up at higher temperatures. © Damián Bakarcic via Flickr
Ozone at ground level is an air pollutant, causing health and ecosystem problems. It is also an important component of summer smog. Ozone is not emitted into the atmosphere directly, but is produced when volatile organic carbons are oxidized in the presence of nitrogen oxides and light. Nitrogen oxides are released into the atmosphere mainly as a result of combustion processes (like car engines and industry), while non-methane volatile organic carbons (NMVOCs) come in large part from vegetation, especially broad-leaf trees and some fast-growing crops.
Part of the EU energy policy is to stimulate the use of sustainable biomass as an energy source. This could lead to expansion of commercial bioenergy crop production in plantations and an increasing use of forests. While this may help to reduce greenhouse gas emissions, it will also increase NMVOC emissions. At the same time, EU air quality policies aim to reduce emissions of air pollutants such as nitrogen oxides and man-made NMVOC. Because some steps in the ground level ozone formation process are driven by absorption of light and/or proceed faster with higher temperatures, climate change could lead to higher ground level ozone concentrations in the future.
The separate effects of these three trends on ground level ozone have been studied before, but the question remains: what will be the combined impact of a) an increase of bioenergy plantations, b) EU’s air quality policy and c) climate change on health and ecosystem damage from ground level ozone? And which of the trends is the most important? To answer these questions, I used three models to study two energy and air quality scenarios for Europe under current and possible future climate conditions.
Two energy scenarios calculated by the Price-Induced Market Equilibrium System (PRIMES) model form the basis of this work. We used a reference scenario and one in which Europe reaches 80% CO2 emission reduction in 2050. These energy scenarios were used as a basis to calculate air pollutant emissions with IIASA’s Greenhouse Gas and Air Pollution Interactions and Synergies (GAINS) model. Then we put the same scenarios into IIASA’s Global Biosphere Model GLOBIOM to obtain the change in land cover because of increasing bioenergy demand. I combined these datasets in chemistry transport model LOTOS-EUROS (the model of choice at my home institute, TNO) to calculate the impact on ground level ozone concentrations across Europe. To simulate ‘future climate’ we used the year 2003, in which Europe had a very warm summer, with temperatures 2-5 °C higher than normal.
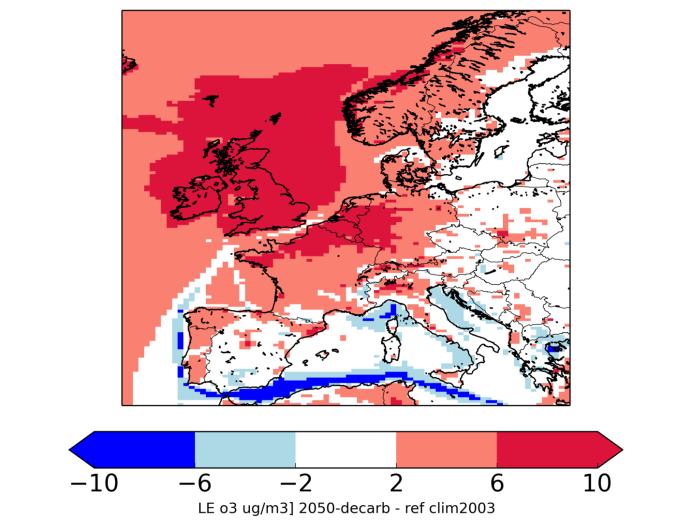
Difference in average ozone concentration (in µg/m3) between the current situation and the 80% CO2 reduction scenario in 2050 under future climate change conditions for the period April-September. Negative numbers mean a decrease in ozone levels.
We found that especially for the CO2-reduction scenario, the increase in bioenergy production could cause a slight increase in ozone damage. However, the impact of reduced emissions because of more stringent air quality policies far outweighs this effect, leading to a net reduction of ozone damage. The third effect, more efficient ozone formation in a warming climate, is so strong that in 2050 ozone damage to human health could be worse than today, especially for northwestern Europe. Stringent air quality policies close to a maximum feasible reduction scenario would be needed to make sure that health and ecosystem damage towards the middle of the century is smaller than it is today.
Note: This article gives the views of the author, and not the position of the Nexus blog, nor of the International Institute for Applied Systems Analysis.
Feb 10, 2016 | Demography
By Daniela Weber, research scholar in the IIASA World Population Program.
Did you ever notice that you walk faster than your friends, or are you the one lagging behind? Your walking speed doesn’t only reveal how fast you walk; it can predict survival and the “slowing down process” and – according to a recent study – it can tell how old you are in terms of your physical fitness. If you are highly educated, or work in a non-manual job, you could be up to 15 years younger when it comes to your “walking age”—the age you are supposed to be according to your physical performance.

Your chronological age does not necessarily reflect your “walking age,” which can be much younger depending on your lifestyle.
For almost all of us, walking is necessary for our everyday lives. For instance, did you know that walking at about 1.1 meters per second (m/s) means that you can cross the street safely in time before the light changes? The decline in walking speed starts around age 60, previous research has found, and a speed of less than 0.6 m/s is associated with substantial impairments to daily life. In my new study, I investigated physical aging and particularly the walking age of older adults in England.
It’s well documented that higher socioeconomic status is positively associated, for older individuals especially, with better physical functioning, such as faster walking. My results confirmed the effects of education, occupation, and regional wealth on physical aging. For instance, a more highly educated 70 year old walked around 0.1 m/s faster at their normal pace than a less educated person of the same age. I noticed a gap of a similar magnitude comparing manual and non-manual workers, with a higher walking speed in those that worked in non-manual jobs.
Interestingly, living in a wealthier region was also associated with higher walking speed, although the difference is only minor. The positive effect of living in a wealthier area might be down to fitness as a result of daily routine. People living in wealthier, urban areas are more likely to walk to the shops or to catch public transport than their counterparts living in rural areas, where people tend to use their cars for shopping or commuting.
What does a difference of for instance 0.1 m/s mean and why is it important? I highlighted the differences by converting them into years of age. In a nutshell, less educated 70-year-olds walked on average at the same pace as more highly educated individuals who were 6.5-9 years older. At higher ages they had lost 2.5 years of walking age, which has been linked to many general health issues. Overall, the advantage of more education, non-manual work, or living in a wealthier region comprises up to 15 walking age years for men and up to 10 years for women. However, the size of the advantage declines with increasing age.
More information: IIASA Research Project: Reassessing aging from a population perspective
Reference
Weber D (2016) Differences in physical aging measured by walking speed: evidence from the English Longitudinal Study of Ageing. BMC Geriatrics, 16(1):31 [December 2016] doi:10.1186/s12877-016-0201-x
Note: This article gives the views of the author, and not the position of the Nexus blog, nor of the International Institute for Applied Systems Analysis.
Sep 24, 2015 | Air Pollution

© kichigin19 | dreamstime.com
By Jens Borken-Kleefeld, IIASA Mitigation of Air Pollution and Greenhouse Gases Program
Earlier this week, Volkswagen admitted fraudulent software causing high exhaust emissions of nitrogen oxides (NOx) from several of its diesel car models during normal driving. That diesel cars emit many times more NOx in normal driving than their legal limit has been known for more than a decade in Europe. The surprise to me is that the enforcement of these legal limits is pursued now from the USA and not from a European authority, and that – in the face of a public outcry – the automaker admitted the same software was not only in US models.
Following this announcement, I took a second look into the on-road emission data from Europe and compared it with data collected by colleagues in the USA. We find that VW diesel cars in Europe emit as much NOx as the incriminated models in the USA, as shown in the chart for VW Golf, Jetta and Passat models model years 2009 to 2013.

On-road data US: Peter McClintock, remote sensing campaign by Envirotest Inc. for Colorado (2013). On-road data Europe: Jens Borken-Kleefeld, analyzing remote sensing campaigns by AWEL Zurich (2009-2013). Each filtered for normal driving conditions.
We measured significant differences between manufacturers, yet on the whole the gap between officially certified and real-driving NOx emissions from diesel cars in Europe has been growing. The few models with low emissions are by far outnumbered by cars with high NOx emissions. Yet, VW’s emission levels are not even the worst in class.
References:
US EPA Notice of Violation, 18 Sept 2015. http://www3.epa.gov/otaq/cert/documents/vw-nov-caa-09-18-15.pdf
Announcement by VW: http://www.volkswagenag.com/content/vwcorp/info_center/en/news/2015/09/Volkswagen_AG_has_issued_the_following_information.html
Chen and J. Borken-Kleefeld, “Real-Driving Emissions from Cars and Light Commercial Vehicles – Results from 13 Years Remote Sensing at Zurich/CH,” Atmospheric Environment 88 (May 2014): 157–64. http://dx.doi.org/10.1016%2Fj.atmosenv.2014.01.040
Note: This article gives the views of the author, and not the position of the Nexus blog, nor of the International Institute for Applied Systems Analysis.
Nov 5, 2014 | Demography
By Samir K.C., IIASA World Population Program
How old are you? This is the most basic demographic question about an individual, and an easy one to answer. What is the population of the world or your country? Well, many who read the news roughly know the number, about seven billion for the world and more than a billion in China and India. But when asked more detailed questions about demography, “What percentage of people are younger than you in the world or your country?” or “What’s the remaining life expectancy for you in your country and the world?” the eyes start rolling. Such questions are important because they lead to better knowledge and awareness about the population, especially the question of life expectancy.

(Photo: UN Photo/Sebastiao Barbosa)
This is why I, with my colleagues Wolfgang Fengler (World Bank), Benedikt Gross (data visualization designer), and many others, have developed a website where people can find out their respective place in the world population or the country population: population.io. The website was launched last Saturday at the TEDxVienna.
How long will we live? Most of us in the general public do not know the answer. But demographers and actuaries can actually project the expected date of death for populations, based on factors such as place of residence, age, and sex. Demographers use data on deaths occurring during a period and the population structure to estimate death rates. These death rates are then included in the life table calculations that show, among other details, expected number of years of remaining life given one’s place of residence, age, and sex.
On population.io, you can find your own expected death date, based on population projections and details such as where you were born, where you live, and your sex. Of course, this date is just an average with a distribution. If the remaining life expectancy for a 40-year-old is 30 more years, that does not mean that all today’s 40-year-olds will die in 2044: roughly half will die earlier and half later. But we hope that exploring this tool will give people some insight into the world and their country’s population and their place within it.
How do we know how long you will live?
To answer this question, we use population projections. To make good population projections, demographers need information about the demographic structure, including current age and sex structure and assumptions about the future scenarios of mortality, fertility, and migration. A “cohort component” method is then applied to calculate the future population size and structure and to obtain number of births, deaths, and migration. This method projects each cohort born in the same one- or five-year period forward in time, to replace the older cohort occupying the age. In the process some die or migrate out (population decreases) and some migrate in (population increases), while women in reproductive age groups might give birth to children, who will then enter the population as a new cohort. All of these numbers and assumptions are needed for many purposes within and outside the discipline of population studies including for a proper answer to our question, “How long will I live?”
Here’s how the calculations behind population.io work. As an example, I’ll take myself: For a male of my age, 40 years old, on average according to the current global mortality rates, my remaining life expectancy would be about 37 years. This is bit scary for me – that means as an average “global citizen, I would die at age 77. In Nepal, where I am from, my life expectancy would be a little more than one year less. However, since I will most likely live in Austria, my remaining life expectancy increases to 43 years, an increase of 7.4 years due to migration.

On population.io, you can explore–among lots of other population data–how living in a different country would affect your life expectancy. Click to try it yourself!
Now, if I add that I belong to the highest category in terms of education, what will happen to my life expectancy? Though education is not yet included in the population.io, it turns out that that also depends to a large degree on where I live. In Portugal or Italy, a person with a university degree would have lesser advantage compared to those with lower secondary education or below (2.5 and 2.6 years more respectively) than someone living in Estonia (13.8 years more) or the Czech Republic (12.5 years), Hungary and Bulgaria (12.1 years).
What if I am a smoker? Do not exercise? These factors too play an important role in future life expectancy, and we plan to add them soon to the population.io Web site.
Note: This article gives the views of the author, and not the position of the Nexus blog, nor of the International Institute for Applied Systems Analysis.


You must be logged in to post a comment.