Aug 16, 2017 | Climate Change, Young Scientists
By Parul Tewari, IIASA Science Communication Fellow 2017
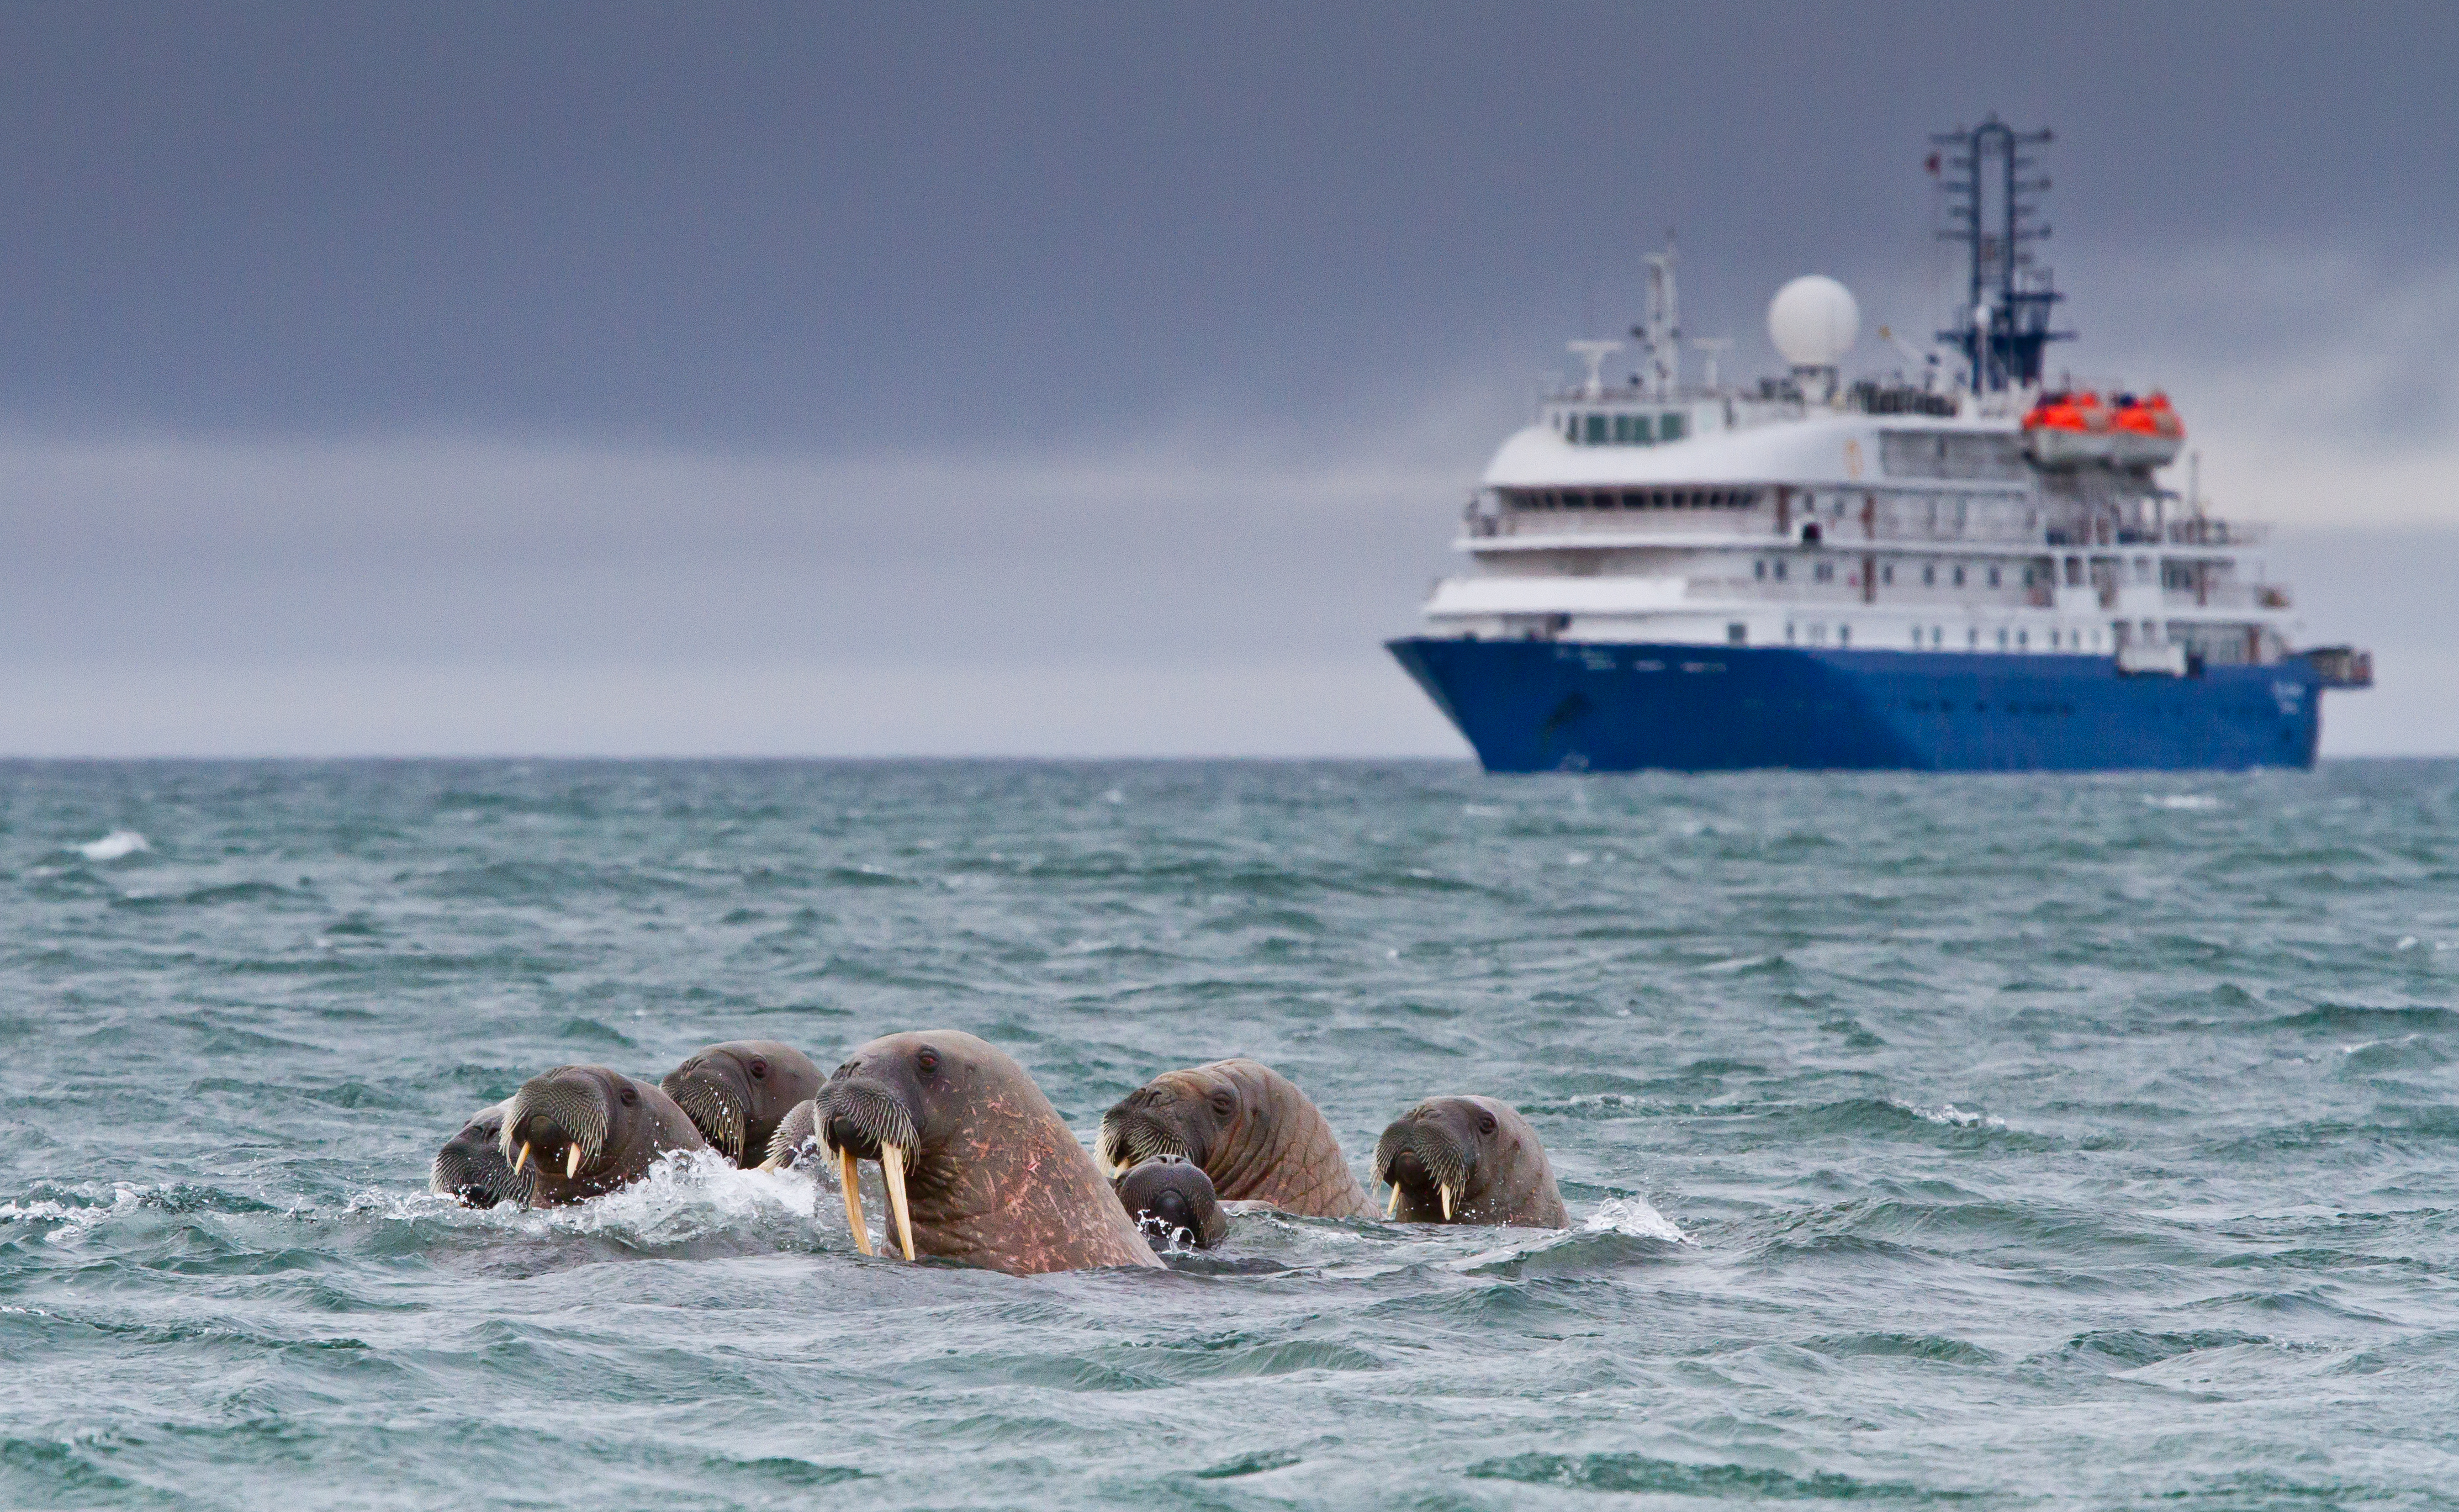
As climate change warms up the planet, it is the Arctic where the effects are most pronounced. According to scientific reports, the Arctic is warming twice as fast in comparison to the rest of the world. That in itself is a cause for concern. However, as the region increasingly becomes ice-free in summer, making shipping and other activities possible, another threat looms large. That of an oil spill.

©AllanHokins I Flickr
While it can never be good news, an oil spill in the Arctic could be particularly dangerous because of its sensitive ecosystem and harsh climatic conditions, which make a cleanup next to impossible. With an increase in maritime traffic and an interest in the untapped petroleum reserves of the Arctic, the likelihood of an oil spill increases significantly.
Maisa Nevalainen, as part of the 2017 Young Scientists Summer Program (YSSP), is working to assess the extent of the risk posed by oil spills in the Arctic marine areas.
“That the Arctic is perhaps the last place on the planet which hasn’t yet been destroyed or changed drastically due to human activity, should be reason enough to tread with utmost caution,” says Nevalainen
Although the controversial 1989 Exxon Valdez spill in Prince William Sound was quite close to the Arctic Circle, so far no major spills have occurred in the region. However, that also means that there is no data and little to no understanding of the uncertainties related to such accidents in the region.
For instance, one of the significant impacts of an oil spill would be on the varied marine species living in the region, likely with consequences carrying far in to the future. Because of the cold and ice, oil decomposes very slowly in the region, so an accident involving oil spill would mean that the oil could remain in the ice for decades to come.

Thick-billed Murre come together to breed in Svalbard, Norway. Nevalainen’s study so far suggests that birds are most likely to die of an oil spill as compared to other animals. © AllanHopkins I Flickr
Yet, researchers don’t know how vulnerable Arctic species would be to a spill, and which species would be affected more than others. Nevalainen, as part of her study at IIASA will come up with an index-based approach for estimating the vulnerability (an animal’s probability of coming into contact with oil) and sensitivity (probability of dying because of oiling) of key Arctic functional groups of similar species in the face of an oil spill.
“The way a species uses ice will affect what will happen to them if an oil spill were to happen,” says Nevalainen. Moreover, oil tends to concentrate in the openings in ice and this is where many species like to live, she adds.
During the summer season, some islands in the region become breeding grounds for birds and other marine species both from within the Arctic and those that travel thousands of miles from other parts of the world. If these species or their young are exposed to an oil spill, then it could not only result in large-scale deaths but also affect the reproductive capabilities of those that survive. This could translate in to a sizeable impact on the world population of the affected species. Polar bears, for example, have, on an average two cubs every three years. This is a very low fertility rate – so, even if one polar bear is killed, the loss can be significant for the total population. Fish on the other hand are very efficient and lay eggs year round. Even if all their eggs at a particular time were destroyed, it would most likely not affect their overall population. However, if their breeding ground is destroyed then it can have a major impact on the total population depending on their ability and willingness to relocate to a new area to lay eggs, explains Nevalainen.
Due to lack of sufficient data on the number of species in the region as well as that on migratory population, it is difficult to predict future scenarios in case of an accident, she adds. “Depending on the extent of the spill and the ecosystem in the nearing areas, a spill can lead to anything from an unfortunate incident to a terrible disaster,” says Nevalainen.
©katiekk I Shutterstock
It might even affect the food chain, at a local or global level. “If oil sinks to the seafloor, some species run the risk of dying or migrating due to destroyed habitat – an example being walruses as they merely dive to get food from the sea floor,” adds Nevalainen. As the walrus is a key species in the food web, this has a high probability of upsetting the food chain.
When the final results of her study come through, Nevalainen aims to compare different regions of the Arctic and the probability of damage in these areas, as well as potential solutions to protect the ecosystem. This would include several factors. One of them could be breeding patterns – spring, for instance, is when certain areas need to be cordoned off for shipping activities, as most animals breed during this time.
“At the moment there are no mechanisms to deal with an oil spill in the Arctics. I hope that it never happens. The Arctic ecosystem is very delicate and it won’t take too much to disturb it, and the consequences can be huge, globally,” warns Nevalainen.
About the Researcher
Maisa Nevalainen is a third- year PhD student at the University of Helsinki, Finland. Her main focus is on environmental impacts caused by Arctic oil spills, while her main research interests include marine environment, and environmental impacts of oil spills among others. Nevalainen is working with the Arctic Futures Initiative at IIASA over the summer, with Professor Brian Fath as her supervisor and Mia Landauer and Wei Liu as her co-supervisors.
This article gives the views of the author, and not the position of the Nexus blog, nor of the International Institute for Applied Systems Analysis.
Mar 21, 2017 | Climate Change, Energy & Climate, Science and Policy, Young Scientists
By Jessica Jewell, IIASA Energy Program
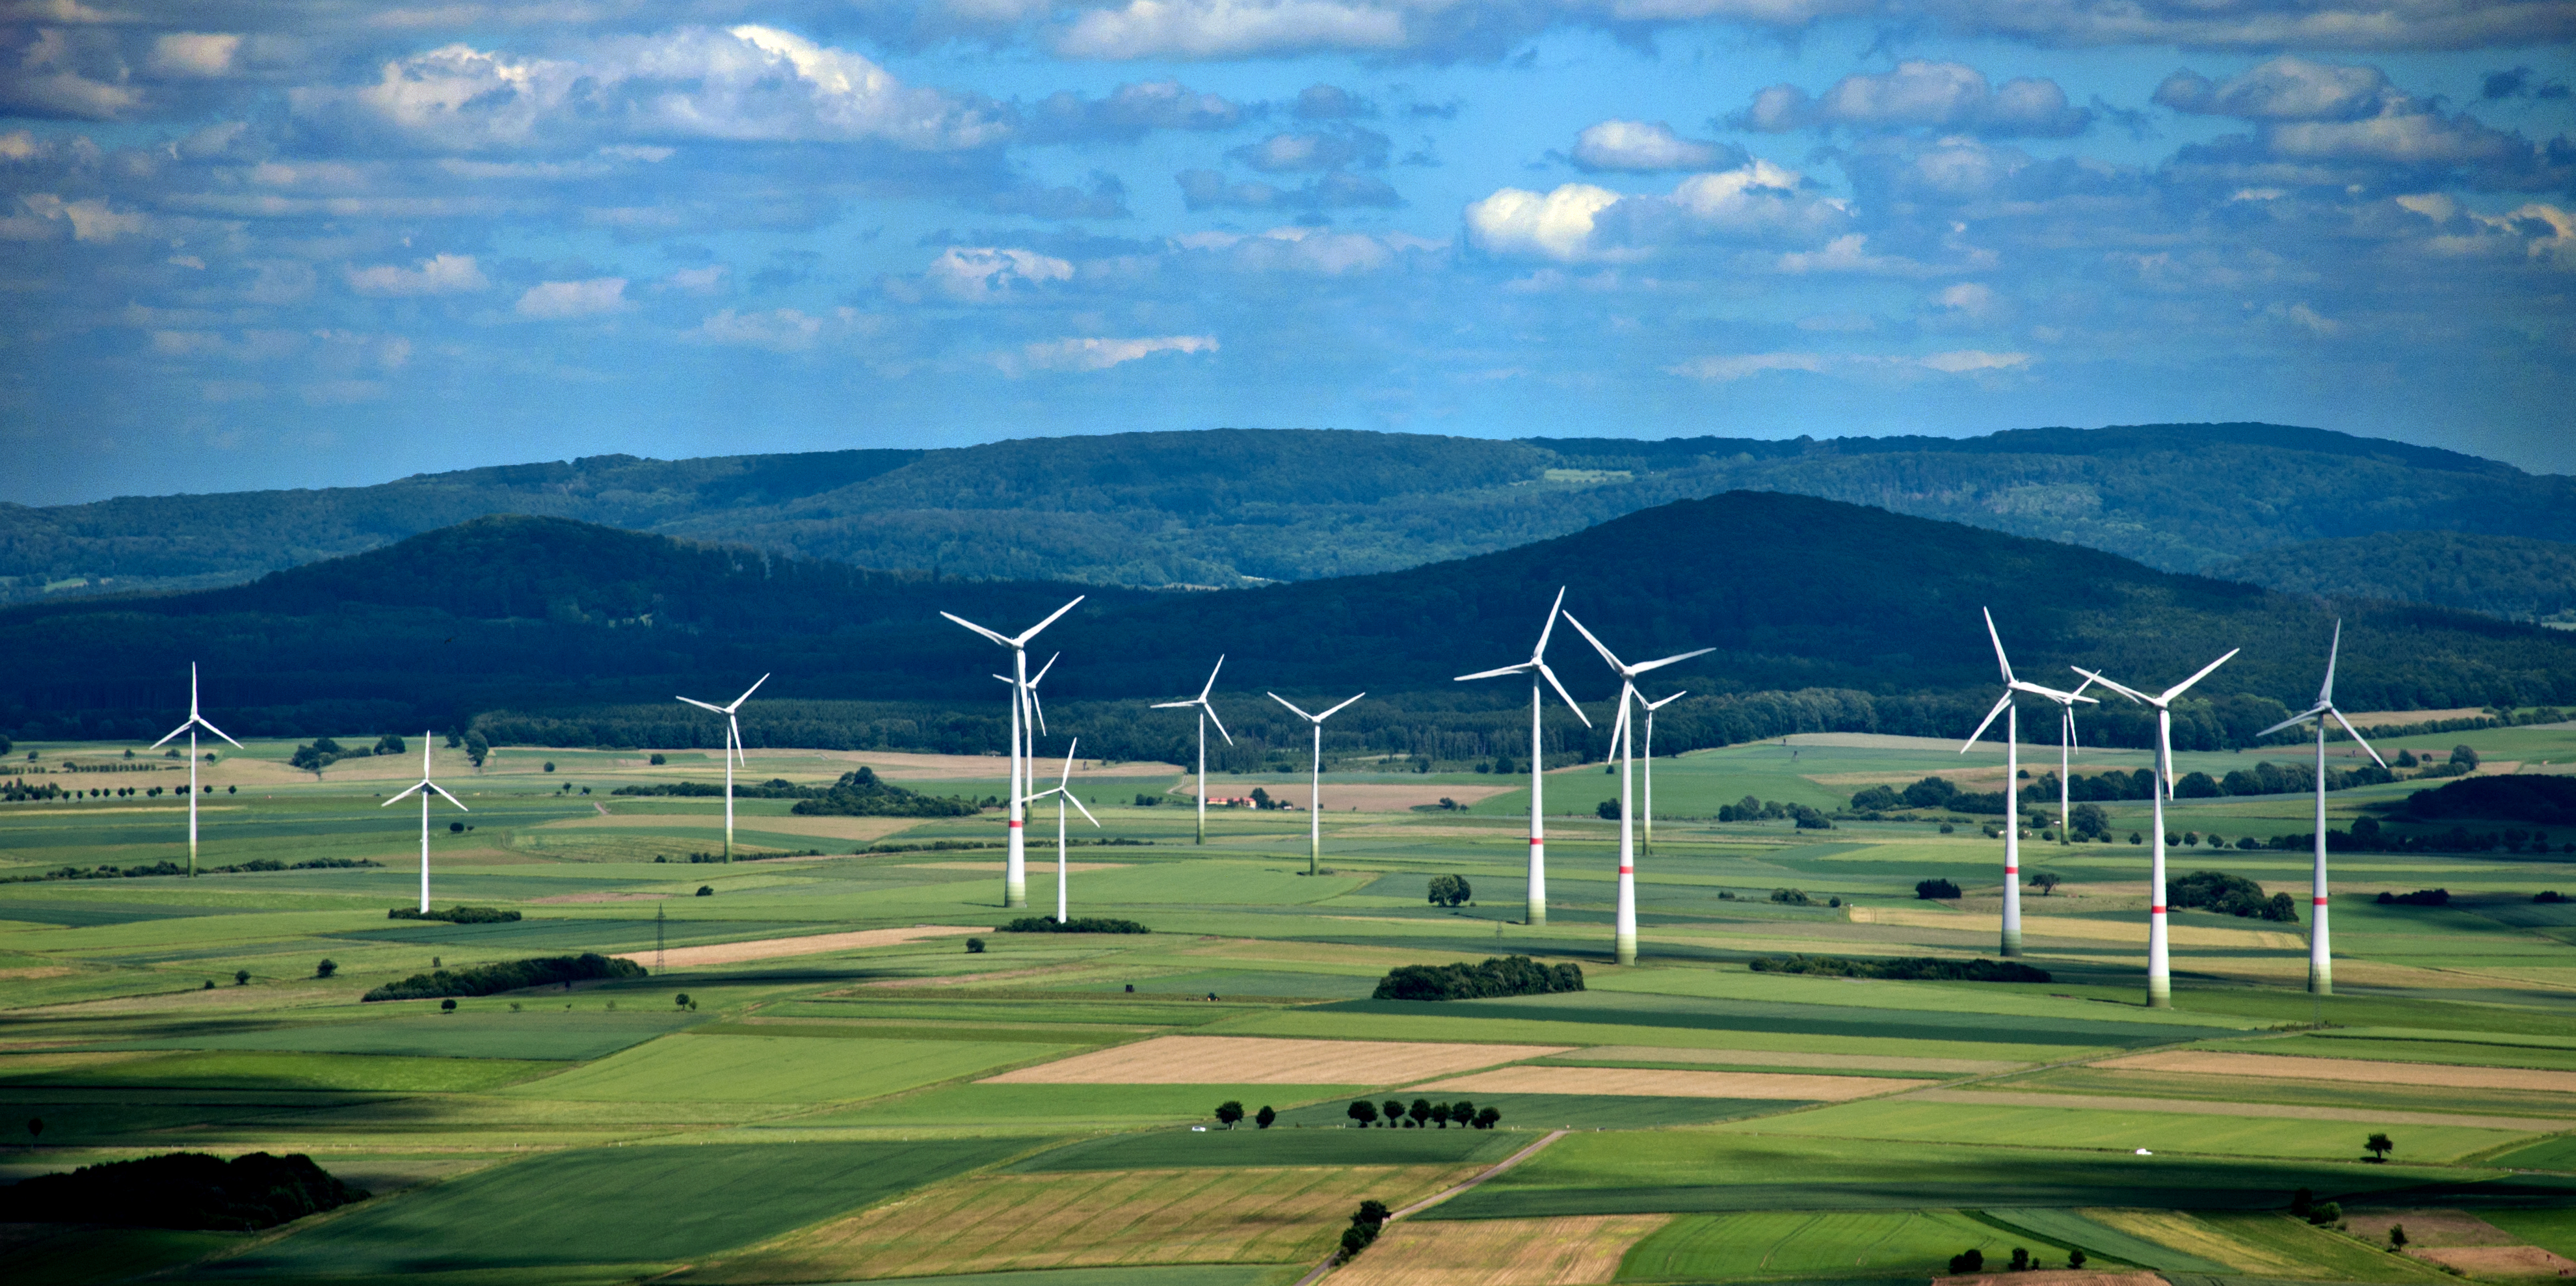
Why have Germany and Japan, two large, and in many respects similar developed democracies pursued different energy options? A recently published study examines why Germany has become the world’s leader in renewable energy while phasing out its nuclear power and Japan has deployed only a trivial amount of renewables while constructing a record number of nuclear reactors.
The widespread story is that Germany rejected nuclear power in a politically bold move after Fukushima and instead pursued ‘Energiewende’ prioritizing wind and solar energy to combat climate change. Leading scholars such as Amory Lovins described Japanese policymakers as manipulated by the nuclear lobby, clinging to their old ways, and unwilling to properly support renewable energy. The lesson to other countries is that public anti-nuclear sentiments and a capable democratic government is what it takes to turn to decentralized renewable energy.
This research shows that these stories are myths. As I and my coauthor wrote in a letter to the editor in Nature last year, Japan had ambitious renewable targets already before Fukushima and there is no evidence that these have been affected by its nuclear plans. The same holds for Germany: its targets for renewable energy were not affected by the change in its nuclear strategy following Fukushima’s disaster in 2011.

© nixki | Shutterstock
In fact, the differences between Germany and Japan started not in 2011 after Fukushima, but some 20 years earlier in the early 1990s when Japan’s electricity consumption was rapidly growing and it desperately needed to expand electricity generation to feed demand that could not be matched with very scarce domestic fossil fuels. Furthermore, Japan was developing ‘energy angst’ related not only to its high dependence on Middle Eastern oil and gas but also to potential competition with China’s with its rising appetite for energy. At the same time, Germany’s electricity consumption stagnated in the 1990s and its energy security improved following the end of the Cold War. Germany was also one of the world’s largest coal producers and could in principle supply all its domestic electricity from coal. As a result, in the 1990s, Japan was forced to build nuclear power plants, but Germany could easily do without them.
There was another important development in the early 1990s: wind power technology diffused to Germany from neighboring Denmark. This was triggered by an electricity feed-in-law of 1990s, which obliged German electric utilities to buy electricity from small producers at close-to-retail prices. The law, which aimed to benefit a small number of micro-hydro plant owners, unexpectedly led to almost a 100-fold rise in wind installations in Germany. Although still insignificant in terms of electricity, this development created a large and vocal lobby of owners and manufacturers of wind turbines. In the early 2000s, the wind sector provided less than one-tenth of nuclear electricity but had more jobs than in the nuclear sector. In contrast, Japan’s similar policies of buying wind energy from decentralized producers did not result in any considerable growth of wind power, because the Danish technologies prevalent in the early 1990s could not be as easily diffused to Japan.
By the turn of the century, the electricity sectors in Germany and Japan still looked largely similar, but the political dynamics could not be more different. In Germany, a huge politically-powerful coal sector was represented by Socio-Democratic Party and the so-called ‘red-green’ coalition was formed with the Green party, who represented the rapidly growing wind power sector. The stagnating nuclear industry, however, had not seen new domestic orders or construction for 15 years and large industrial players like Siemens had begun to diversify away from it. All this was in the context of a positive energy security outlook and declining electricity prices. In contrast, in Japan, the nuclear sector had vigorously grown over the last decade and was becoming globally dominant by acquiring significant manufacturing capacities. Nuclear power was the only plausible response to the energy angst and it lacked any credible political opponents: the domestic coal sector in Japan virtually did not exist (Germany had around 70,000 coal mining jobs, Japan – about 1,000) and wind had never taken off.
© Pla2na | Shutterstock
The results of these very different political dynamics were predictably different: the red-green coalition in Germany legislated nuclear phase-out in 2002 and unprecedented financial support for renewables in 2000, while retaining coal subsidies and triggering construction of new coal power plants. Japan continued to support solar energy in which it had been the global leader since the 1970s but it also adopted a plan for constructing many more nuclear reactors designed to substitute imported fuels. Fukushima, rather than highlighting differences actually made the energy trajectories of two countries more similar as both countries began to struggle to replace their aging nuclear capacities with new renewables.
How does this story relate to wider questions such as: why are some countries more successful in deploying renewables than others? The answer is not in ‘stronger political will’ and in the strength of climate change concerns, but in economy, geography, and the structure of energy systems. Political wins for renewables and the climate can also be the result of dubious political compromises such as the alliance with the coal lobby in Germany, which led to the rapid growth of renewables and demise of nuclear power. It may be particularly difficult for countries with fossil fuel resources to implement renewable energy policies if they lead to the contraction of domestic coal, gas or oil industries.
Reference: Cherp A, Vinichenko V, Jewell J, Suzuki M, & Antal M (2016). Comparing electricity transitions: A historical analysis of nuclear, wind and solar power in Germany and Japan. Energy Policy 101: 612-628.
Acknowledgements
The study was supported by the CD-LINKS project and the Central European University’s Intellectual Theme’s Initiative.
This article gives the views of the author, and not the position of the Nexus blog, nor of the International Institute for Applied Systems Analysis.
Nov 25, 2016 | Climate Change, Demography
Samir KC is a researcher in the IIASA World Population Program. He worked on the population projections that form the “human core” of the Shared Socioeconomic Pathways (SSPs), a set of scenarios designed for climate change research, but increasingly being applied more broadly to research in sustainability and environmental change.
What are the SSPs?
The Shared Socioeconomic Pathways are about the future, how the future could look like under different set of conditions. When we want to talk about the future or we need to think about the future, we always have to do some kind of a projection. Whatever the topic is, even in our personal life, we can use scenarios to map out how things might develop, creating different pathways, which can allow us to better understand how our choices could affect these pathways.
Socioeconomic means the major factors socially as well as economically that can affect future changes on our planet—demographic, socially, and economic. But within this broad umbrella, there are multiple disciplines who work on their own topics and have their own methods and data. If they want to work together they have to match with each other so that output of one work could be the input to another group. That’s why the word shared is there.
The SSPs were developed for the Intergovernmental Panel on Climate Change (IPCC). Why were they needed?
For one thing, we just needed to update the data from the earlier generation of emissions scenarios, and define new scenarios. But secondly, the focus changed a bit between the IPCC’s last report and the most recent one, released in 2014. In the new scenarios, the focus is more on challenges to adaptation and mitigation of climate change. These dimensions are harder to incorporate because they depend on a lot of socioeconomic factors.
Researchers use scenarios to map out a range of possible future developments in the socioeocomic factors that influence climate change. © Salvatore Vastano via Flickr
You worked specifically on the population projections for the SSPs, which were published in 2014. How did this process work?
The first thing that we did was to define narratives for each of the SSPs, essentially a story about how the world would look like in the future. This first part is very important. These narratives were based on the current knowledge of science and how the variables are related and interact.
Then for each of the pathways, we had to start defining the variables like population, urbanization, technological change, and economy. Since population is one of the first variables you need in order to calculate other socioeconomic variables, it was the first thing we looked at when turning the narratives into a quantitative projection. Population is needed as a multiplier to calculate demand in the future, for example to calculate how much energy will be required in the future, how much water, and many other things. At the same time when there are adverse effects of climate change, the population determines how many people are impacted as well as who and where. For example the air pollution group who would need population to see how will air pollution affect the population. So population is an important variable.
It was an iterative process—there were lots of calls, involving sometimes 10 or 15 people from many different fields. Whenever we had something to share or something to decide, it was done in this big group. It was a lot of talking and listening to others. That was a very educational for me, because I learned a lot about how people are using population data. It was a very good dialogue—people had sometimes very simple questions but sometimes very interesting questions about population, fertility, mortality, and those kinds of things.
How did your population projections differ from previous demographic data used for climate research?
In most climate research, until recently, population was used as a total number. Populations were assumed to be homogenous—everybody the same, the average will represent everyone. We argued that that is not the case, that you need to consider population heterogeneity, not only age and sex, but also education levels. There is a growing body of research showing that these details make a difference.
Still not everybody is using it, but for example, people working on GDP have used it, and hopefully more and more will use these factors in the future. We have shown in the past that knowing the education level of the population can help us make better projections. Having a more educated population has effects on many other socioeconomic measures. For example, more educated societies have higher level of productivity. Education level has also been used to calculate the speed of technological change. In societies where there are highly educated people the advancement in technological change comes faster than otherwise. And these factors are key to understanding humanity’s vulnerability to climate change, our ability to adapt, and our chances to solve the problem.

Schoolchildren in Indonesia: Population variables like education have big impacts on greenhouse gas emissions and vulnerability to climate change. © Asian Development Bank
A lot of your work focuses on what might happen in the future. How do you explain to people the difference between scenarios or projections and predictions? When we make projections about the future, we don’t use the word “prediction.” The chances that such a projection will be wrong are 100%. We can never say exactly what will happen in the future.
It’s important to understand how the narratives were defined, how we defined the scenarios. We cannot guarantee the future, the results, but we can guarantee the quality of what can be done, what we can say now, today about the future. And then there is the idea of uncertainty – we have said something about the future but we haven’t reported any kind of uncertainty there other than reporting ranges of scenarios. This is a big area for future work. It’s difficult to do, and it would be difficult to interpret, but it’s important to consider.
More information
References
KC S, Lutz W (2014). The human core of the shared socioeconomic pathways: Population scenarios by age, sex and level of education for all countries to 2100. Global Environmental Change http://pure.iiasa.ac.at/10759/
Riahi K, van Vuuren DP, Kriegler E, et al. (2016). The Shared Socioeconomic Pathways and their energy, land use, and greenhouse gas emissions implications: An overview. Global Environmental Change. http://pure.iiasa.ac.at/13280/
This article gives the views of the interviewee, and not the position of the Nexus blog, nor of the International Institute for Applied Systems Analysis.
Nov 22, 2016 | Climate Change, Energy & Climate
Shinichiro Fujimori, guest researcher in the IIASA Energy Program, discusses the implications of a recent paper with IIASA Science writer and Editor Daisy Brickhill.
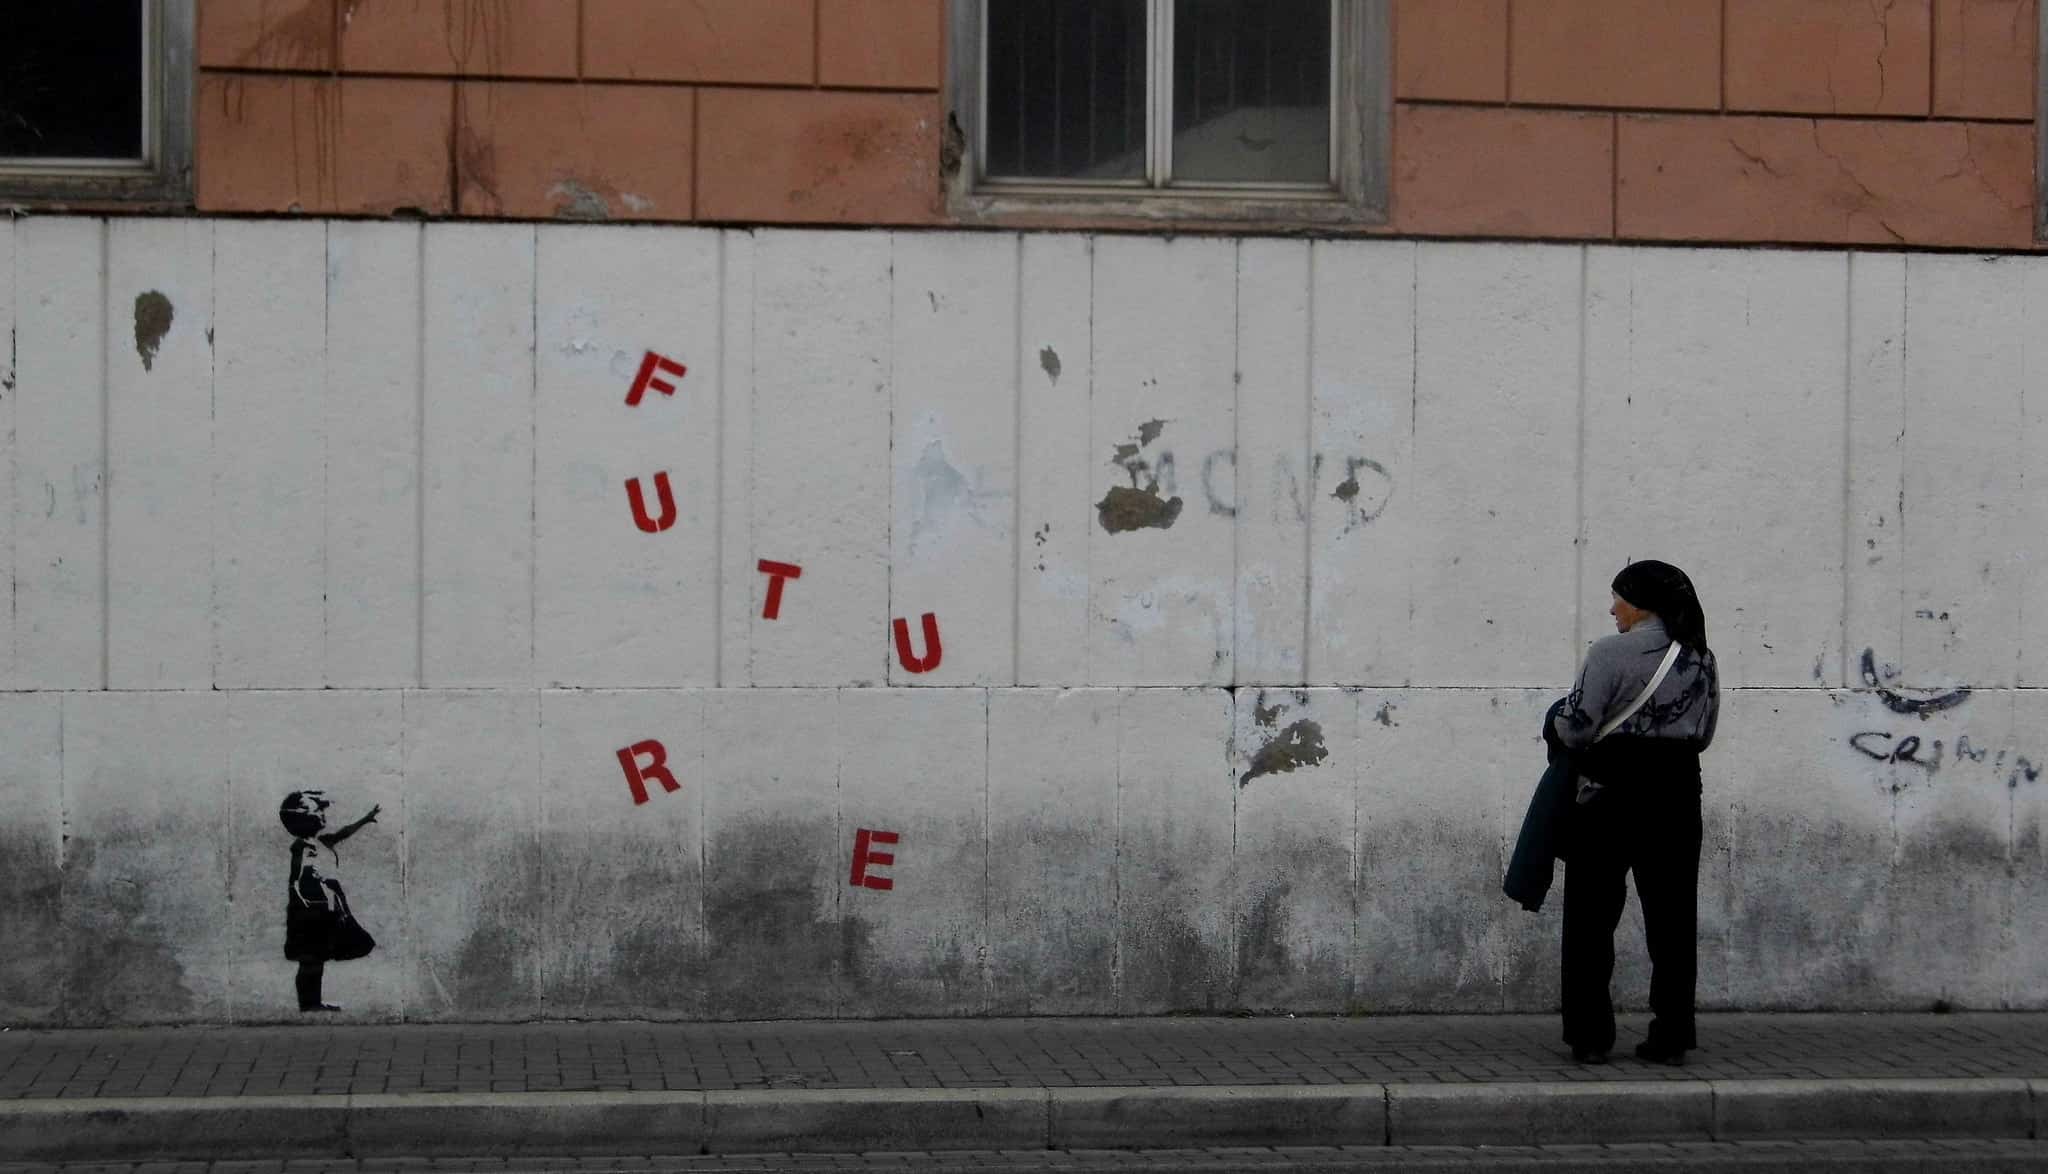
The climate mitigation costs of the Paris Agreement are fairly distributed between countries, but they are not fair for future generations, a new IIASA study has found. This suggests that the relative differences between countries’ climate commitments can be kept the same, but to ensure equity for our descendants they must all be raised .
The Paris Agreement allows each country to set its own climate commitments (known as the Intended Nationally Determined Contributions, or INDCs), and while this autonomy encourages more states to enter into the agreement, it may result in some countries freeloading by not making their fair share of cuts. There is also a trade-off between the mitigation investments we make now, and how much we leave for our descendants to deal with. The study by Fujimori and colleagues examines the issue of equity from different angles.
How did you measure the equity of the climate commitments?
We designed four scenarios: there was the baseline, which has no climate policy, and therefore no emission constraints at all. Then there was a scenario with a carbon price that is the same all over the world, set high enough to put us on course to meet targets to keep warming well below 2°C by 2100. The third scenario allowed different countries to have different carbon prices, meaning that they followed their current INDCs until 2030, but at that point a global carbon price was again put in place to ensure that we reach 2°C targets by the end of the century. Finally, we created a scenario where all emissions reduction targets were 20% higher than the INDCs until 2030. Again, after that a global carbon price was set. For all of the scenarios we also varied what is known in economics as the “discount rate.”
What is a discount rate?
People tend to devalue the future. So, for example, given the choice of €100 now or €150 in five years, many people would choose the €100 now. This is known as a time preference. You can add to this an “inequality aversion.” This is the amount that a wealthy person is willing to reduce their consumption by in order to increase the amount a poor person can consume. Together they make the discount rate.
We used different values of discount rate to see what might happen if people cared a lot about future generations, or poorer countries, or if they did not.
And, are the INDCs fair?
We found that delaying emissions reductions will push the costs onto future generations. In all our scenarios, regardless of the discount rate, there was inequality between the generations. The best scenario for equity between current and future generations was the second scenario with high, globally uniform carbon taxes that start immediately.

© Robwilson39 | Dreamstime
The inequity between generations was not unexpected, but what was surprising was that under the Paris Agreement the equity between countries was good. The third scenario, which followed the INDCs until 2030, has much better equality between the regions until the global carbon price began in 2030. This is because low-income countries tended to set lower carbon prices, and more developed countries had higher carbon prices.
That means that the last scenario is the ideal. We can keep the relative differences between the INDCs the same but raise them all so that we can meet the targets. That would give us both inter-regional equity and inter-generation equity.
What about the costs of the impacts of climate change? The Paris Agreement mentioned the need for a mechanism to support the victims of climate-related loss and damage. Might that not create a completely different picture of equity?
That is not something we covered in the study, but it is very important. We need many more studies in that area. We need flood teams, agricultural teams, and others, all collaborating across disciplines. Very much how IIASA works, in fact. Fortunately, the model we constructed for this study can incorporate all of these aspects, as they become available, and translate them into a comprehensive economic assessment.
Liu JY, Fujimori S, & Masui T (2016). Temporal and spatial distribution of global mitigation cost: INDCs and equity Environmental Research Letters, 11 (11): 114004.
This article gives the views of the interviewee, and not the position of the Nexus blog, nor of the International Institute for Applied Systems Analysis.
Oct 6, 2016 | Alumni, Systems Analysis
Chibulu Luo, PhD Student in the Department of Civil Engineering at the University of Toronto, and a 2016 participant in the IIASA Young Scientists Summer Program
We cannot think about sustainable development without having a clear agenda for cities. So, for the first time, the world has agreed – under the UN’s Sustainable Development Goals (SDGs) and the New Urban Agenda – to promote more sustainable, resilient, and inclusive cities. Achieving this ambitious target is highly relevant in the context of African cities, where most future urban growth will occur. But it is also a major challenge.
Of the projected 2.4 billion people expected to be added to the global urban population between now and 2050, over half (1.3 billion) will be in Africa. The continent’s urban communities will experience dramatic shifts in living and place significant pressure on built infrastructure and supporting ecosystem services. As many cities are yet to be fully developed, newly built infrastructure (estimated to cost an additional US$30 to $100 billion per year) will impact their urban form (i.e. the configuration of buildings and open spaces) and future land use.
In order to realize the SDGs, African cities, in particular, need an ecosystem-based spatial approach to urban planning that recognizes the role of nature and communities in enabling a more resilient urban form. In this regard, more comprehensive understanding of the dynamics between urban form and the social and ecological aspects of cities is critical.
Unfortunately, research to investigate these relationships in the context of African cities has been limited. That’s why, as a Young Scientist at IIASA, I sought to address these research priorities, by asking the following questions: What is the relationship between urban form and the social and ecological aspects of African cities? How has form been changing over time and what are the exhibiting emergent properties? And what factors are hindering a transition towards a more resilient urban form?
Fundamentally, my research approach applies a social-ecological system (SES) lens to investigate these dynamics, where resilience is defined as the capacity of urban form to cope under conditions of change and uncertainty, to be able to recover from shocks and stresses, and to retain basic function. At the same time, resilience is characterized by the interplay between the physical, social, and ecological performance of cities.
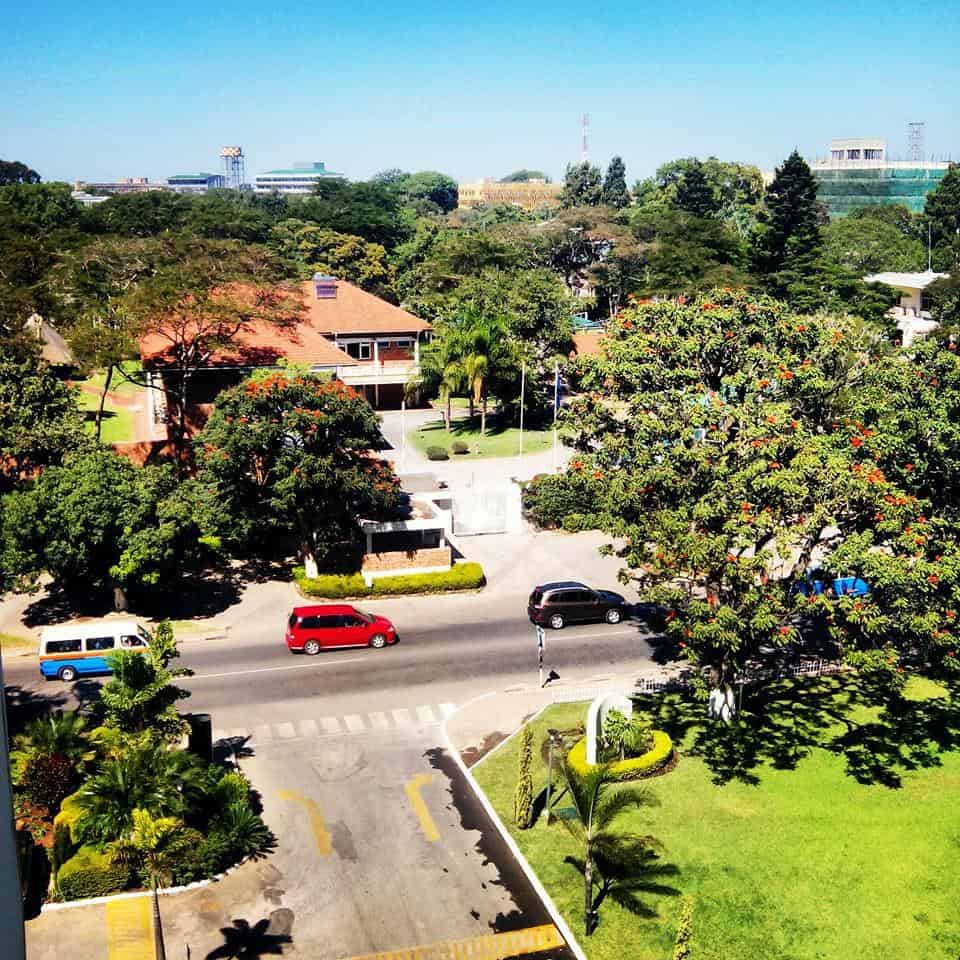
Resilient urban forms are spatially designed to support social and ecological diversity, such as preserving and managing urban greenery
Photo Credit: Image of Lusaka, Zambia, posted on #BeautifulLusaka Facebook Page
Currently, Africa’s urbanization is largely unplanned. Urban expansion has led to the destruction of natural resources and increased levels of pollution and related diseases. These challenges are further compounded by inadequate master plans – which often date back to the colonial era in many countries – and capacity to ensure equitable access to basic services, particularly for the poorest dwellers. Consequently, over 70% of people in urban areas live in informal settlements or slums.
My summer research focused on the specific case of Dar es Salaam, Tanzania, and Lusaka, Zambia – two cities with very different forms, and social and ecological settings. I used the SES approach to develop a more holistic understanding of the local dynamics in these cities and emerging patterns of growth. My findings show that urbanization has resulted in high rates of sprawl and slum growth, as well as reductions in green space and increasing built-up area. This has ultimately increased vulnerabilities to climate-related impacts such as flooding.
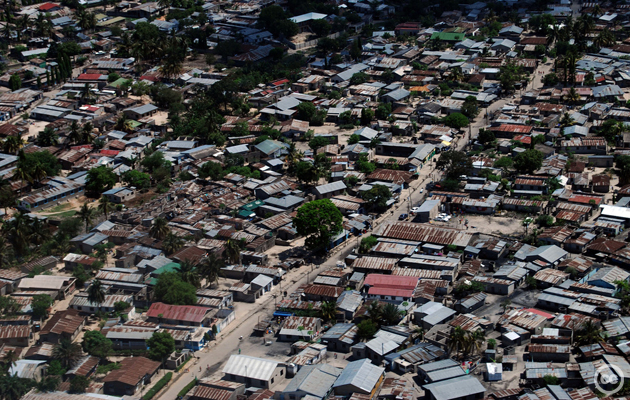
Densely built slum in Dar es Salaam due to unplanned urban development
Photo Credit: tcktcktck.org
Using satellite images in Google Earth Engine, I also mapped land cover and urban forms in both cities in 2005 and 2015 respectively, and quantitatively assessed changes during the 10-year period. Major changes such as the rapid densification of slum areas are considered to be emergent properties of the complex dynamics ascribed by the SES framework. Also, urban communities are playing a significant role in shaping the form of cities in an informal manner, and are not often engaged in the planning process.
Approaches to address these challenges have been varied. On the one hand, initiatives such as the Future Resilience for African Cities and Lands (FRACTAL) project in Lusaka are working to address urban climate vulnerabilities and risks in cities, and integrate this scientific knowledge into decision-making processes. One the other hand, international property developers and firms are offering “new visions for African cities” based on common ideas of “smart” or “eco“ cities. However, these visions are often incongruous with local contexts, and grounded on limited understanding of the underlying local dynamics shaping cities.
My research offers starting point to frame the understanding of these complex dynamics, and ultimately support more realistic approaches to urban planning and governance on the continent.
References
Cobbinah, P. B., & Darkwah, R. M. (2016). African Urbanism: the Geography of Urban Greenery. Urban Forum.
IPCC (b). (2014). Working Group II, Chapter 22: Africa. IPCC.
LSE Cities. (2013). Evolving Cities: Exploring the relations between urban form resilience and the governance of urban form. London School of Economics and Political Science.
OECD. (2016). African Economic Outlook 2016 Sustainable Cities and Structural Transformation. OECD.
The Global Urbanist. (2013, November 26). Who will plan Africa’s cities? Changing the way urban planning is taught in African universities.
UNDESA. (2015). Global Urbanization Prospects (Key Findings).
Watson, V. (2013). African urban fantasies: dreams or nightmares. Environment & Urbanization.
Note: This article gives the views of the author, and not the position of the Nexus blog, nor of the International Institute for Applied Systems Analysis.
You must be logged in to post a comment.