Aug 30, 2017 | Environment, Food & Water, Young Scientists
By Parul Tewari, IIASA Science Communication Fellow 2017
Two things are distinctly noticeable when you meet Cornelius Hirsch—a cheerful smile that rarely leaves his face and the spark in his eyes as he talks about issues close to his heart. The range is quite broad though—from politics and economics to electronic music.

Cornelius Hirsch
After finishing high school, Hirsch decided to travel and explore the world. This paid off quite well. It was during his travels, encompassing Hong Kong, New Zealand, and California, that Hirsch started taking a keen interest in economic and political systems. This sparked his curiosity and helped him decide that he wanted to take up economics for higher studies. Therefore, after completing his masters in agricultural economics, Hirsch applied for a position as a research associate at the Austrian Institute of Economic Research and enrolled in the PhD-program of the Vienna University of Economics and Business to study trade, globalization, and its impact on rural areas. Currently, he is looking at subsidies and tariffs for farmers and the agricultural sector at a global scale.
As part of the 2017 Young Scientists Summer Program at IIASA, Hirsch is digging a little deeper to analyze how foreign direct investments (FDI) in agricultural land operate. “Since 2000, the number of foreign land acquisitions have been growing—governmental or private players buy a lot of land in different countries to produce crops. I was interested in knowing why there are so many of these hotspots in the world— sub-Saharan Africa, Papua New Guinea, Indonesia—why are people investing in these areas?,” says Hirsch.
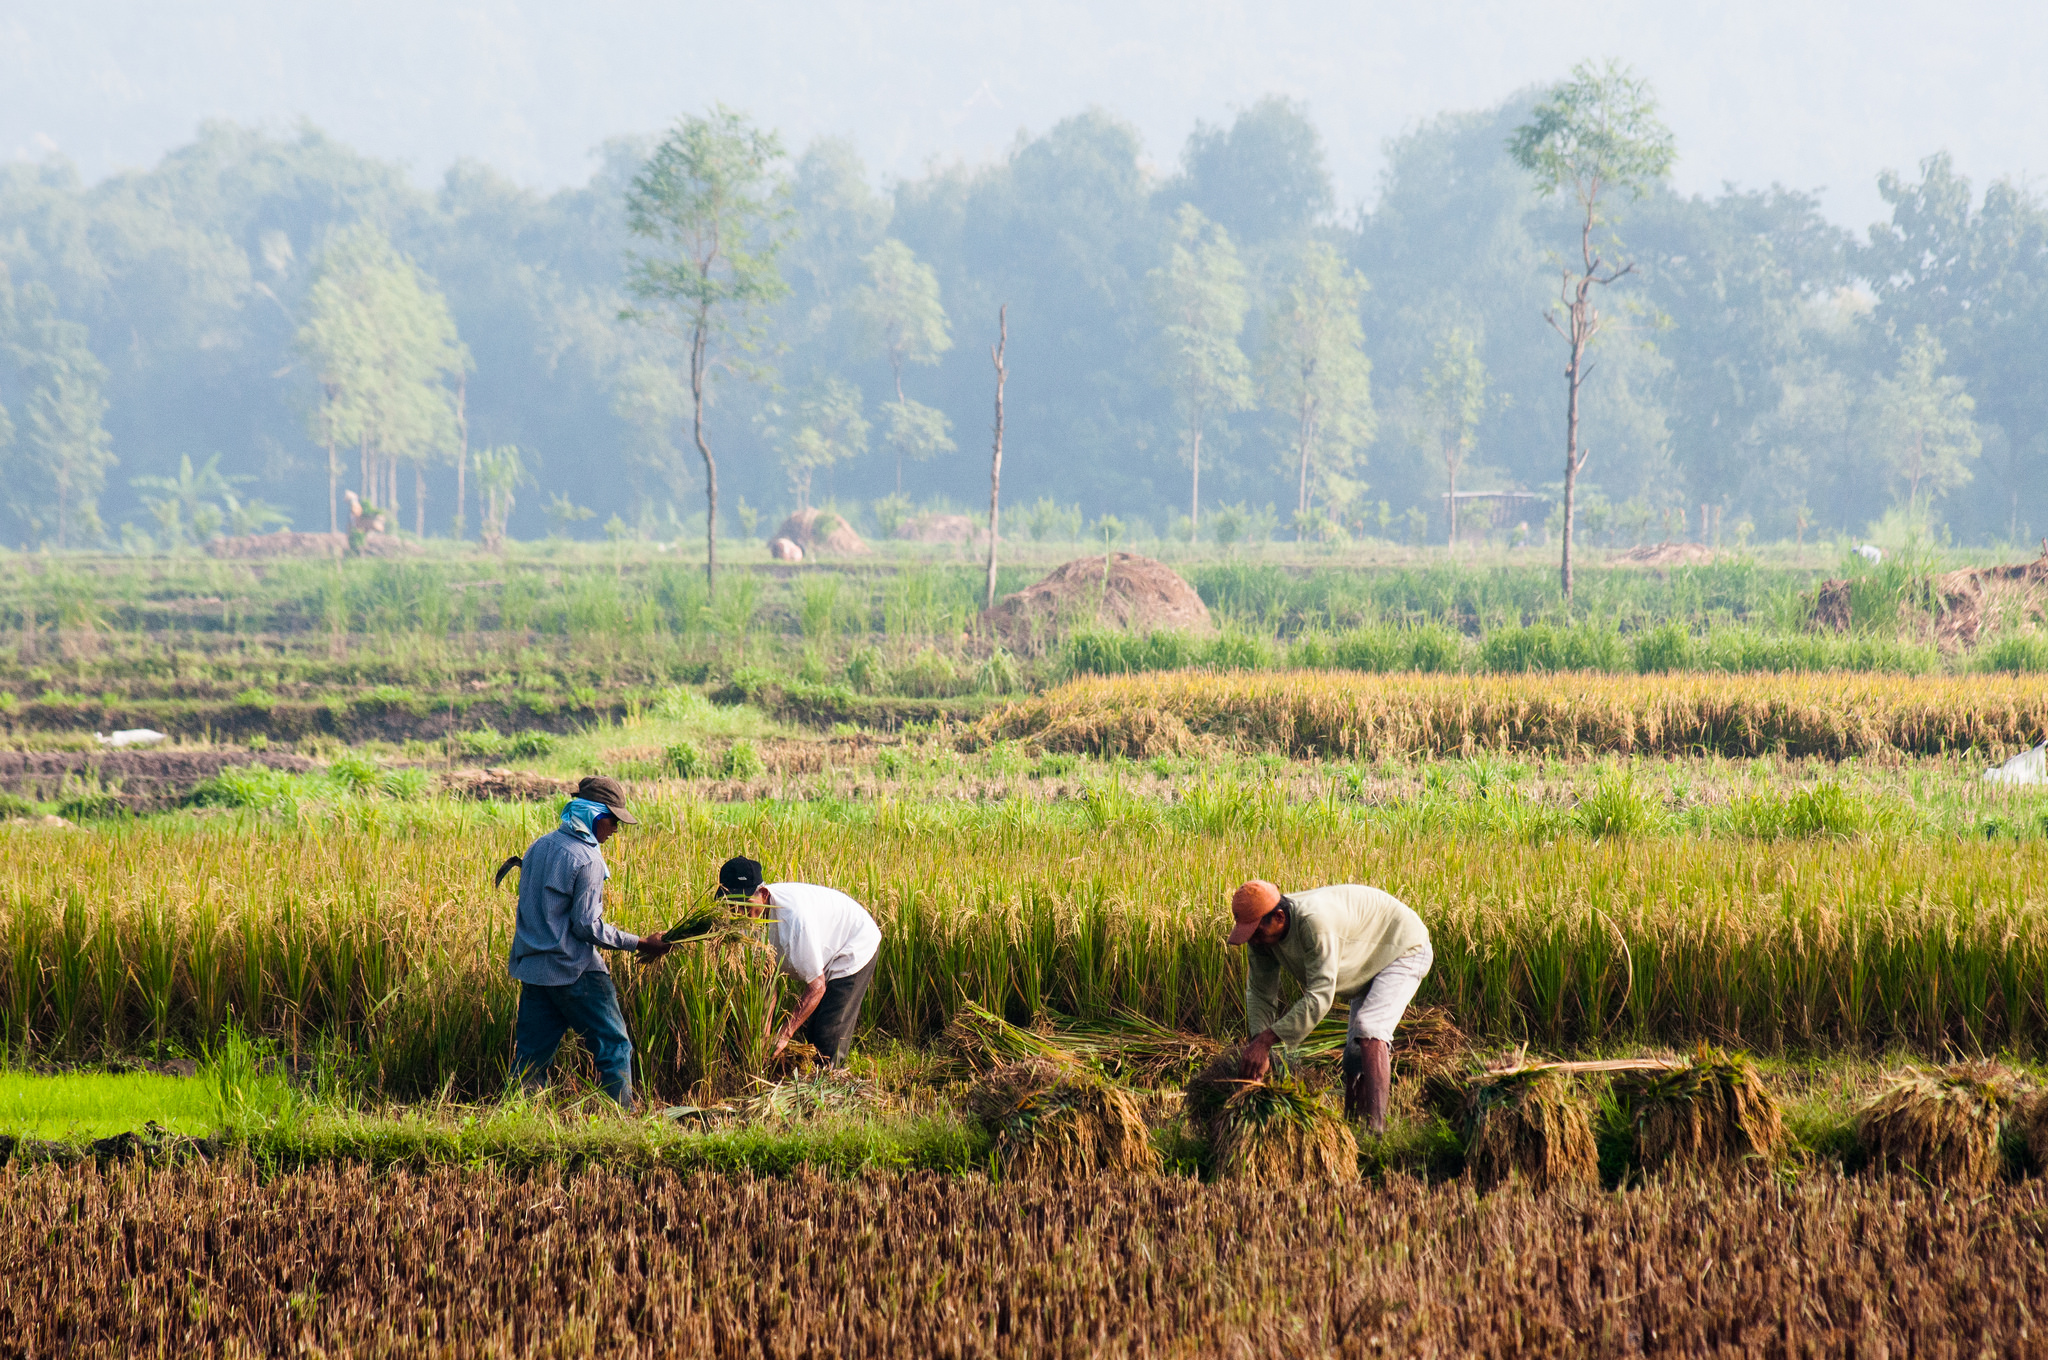
Farming in one of the large agricultural areas in Indonesia ©CIFOR I Flickr
Increased food demand from a growing world population is leading to an increased rate of investment in agriculture in regions with large stretches of fertile land. That these regions are largely rain-fed make them even more attractive for investors as they save the cost of expensive irrigation services. In fact, Hirsch argues that “the term land-grabbing is misleading. It should actually be water-grabbing as water is the foremost deciding factor—even more important than simply land abundance.”
Some researchers have found an interesting contrast between FDI in traditional sectors, such as manufacturing, and the ones in agricultural land. While investors in the former look for stable institutions and good governmental efficiency, FDI in land deals seems to target regions with less stable institutions. This positive relationship between corruption and FDI is completely counterintuitive. Hirsch says that one reason could be that “sometimes weaker institutions are easier to get through when it comes to such vast amount of lands. A lot of times these deals and contracts are oral and have no written proof—the contracts are not transparent anyway.”
For example in South Sudan, the land and soil conditions seem to be so good that investors aren’t deterred despite conflicts due to corrupt practices or inefficient government agencies.
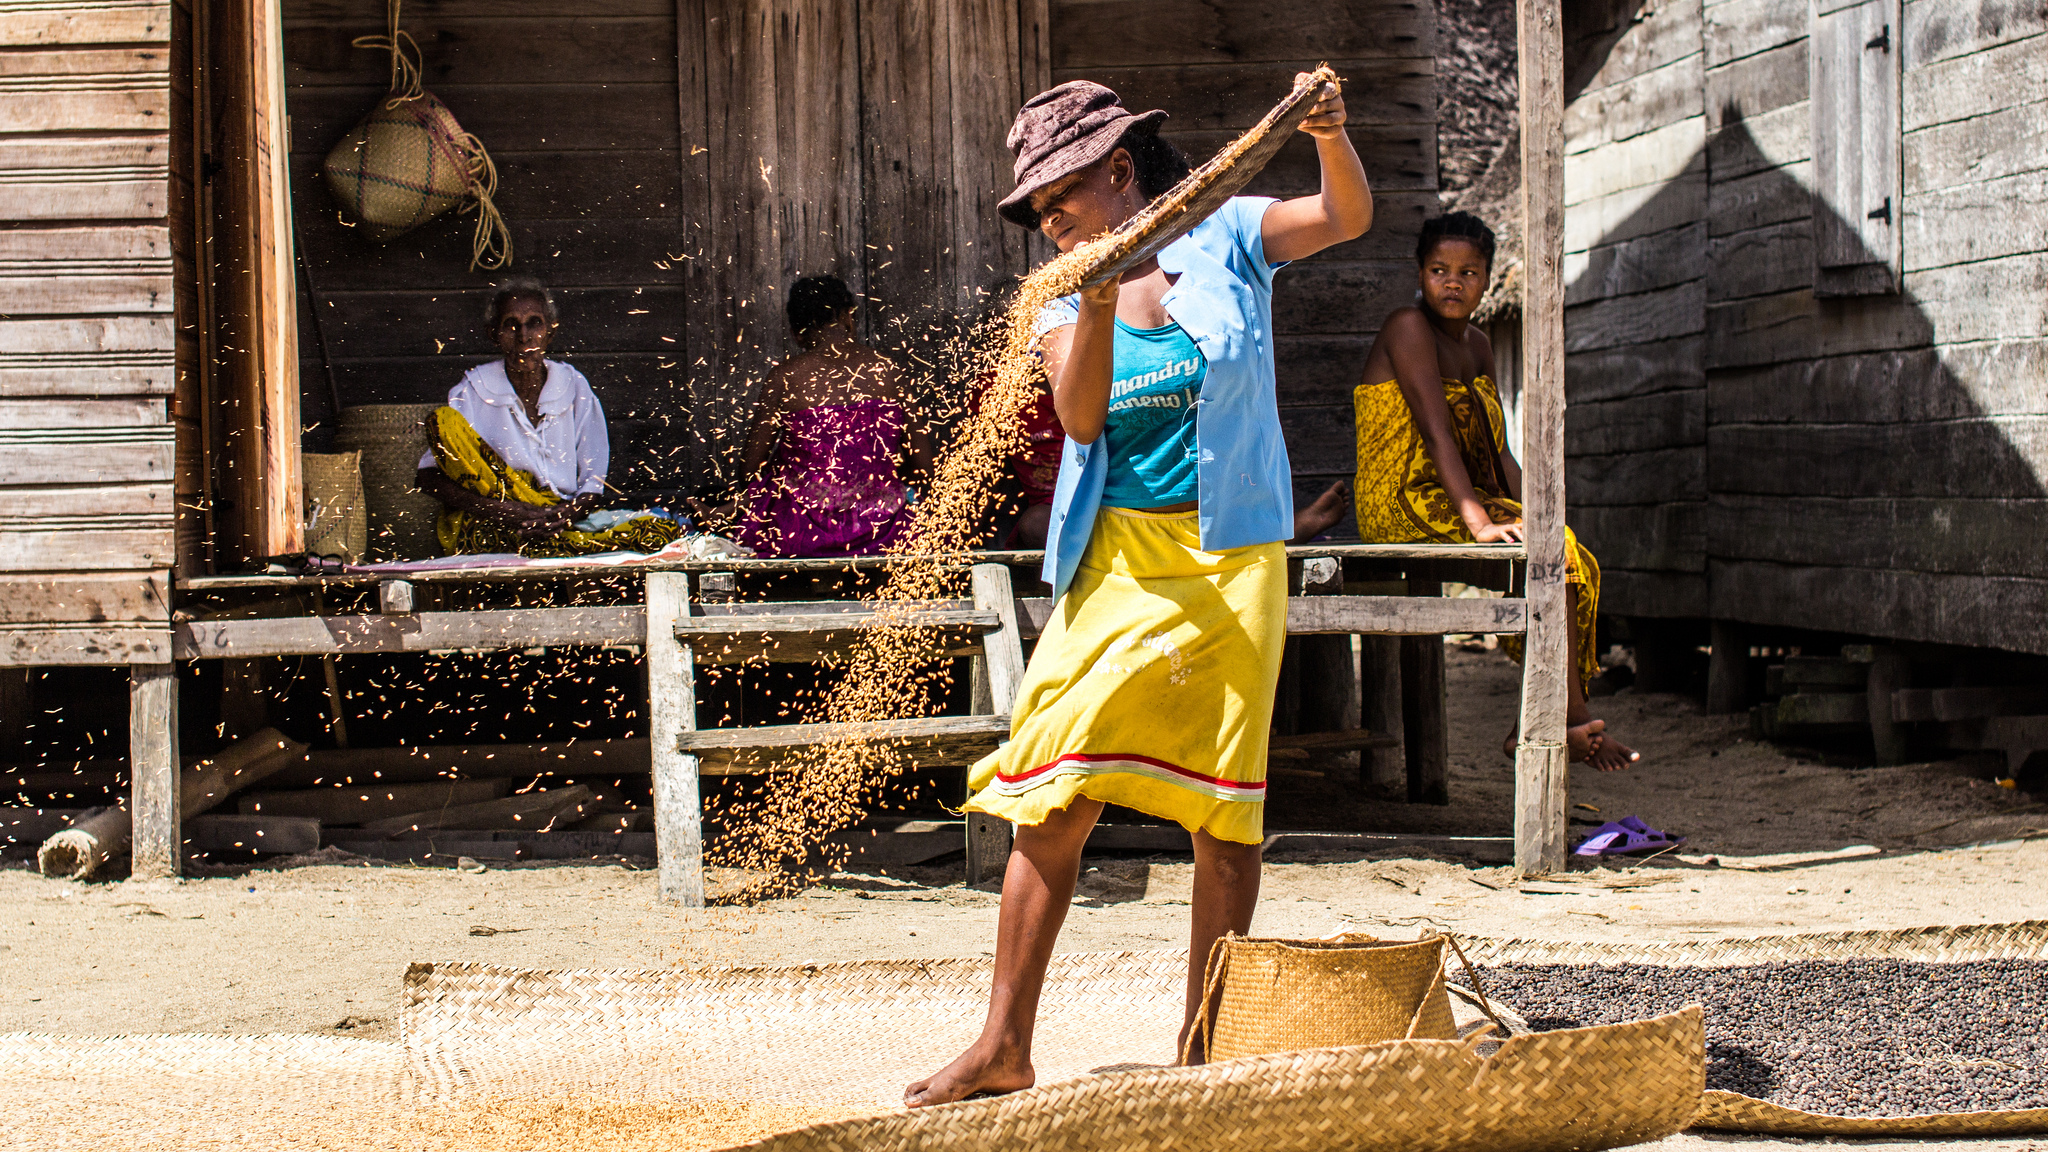
One of the indigenous communities in Madagascar, a place which is vulnerable to land acquisitions © IamNotUnique I Flickr
One area that often goes unnoticed is the violation of land rights of indigenous communities. If a government body decides to sell land or give out production licenses to investors for leasing the land without consulting the actual community, it is only much later that the affected community finds out that their land has been given away. Left with no land and hence no source of livelihood, these communities are forced to migrate to urban areas.
A strain of concern enters his voice as Hirsch talks about the impact. “Land as big as two times the area of Ecuador has been sold off in the past—but it accounts for a tiny percentage of the global production area.” With rising incomes and greater consumption of meat, a lot of land is used to produce animal feed crops. “This is a very inefficient way of using land,” he says.
During the summer program at IIASA, Hirsch is generating data that will help him look at these deals in detail and analyze the main factors that are taken into consideration before finalizing a land deal. At the moment he is only able to give an overview of land-grabbing at the global level. With more data on the location of the deals he can look at the factors that influence these decisions in the first place such as the proximity between the two countries involved in agricultural investments and the size of their economies.
While there is always huge media coverage when a scandal about these land acquisitions comes out in the open, Hirsch seems determined to dig deeper and uncover the dynamics involved.
About the researcher
Cornelius Hirsch is a research associate at the Austrian Institute of Economics and Research (WIFO). At IIASA he is working under the supervision of Tamas Krisztin and Linda See in the Ecosystems Services and Management Program (ESM).
This article gives the views of the author, and not the position of the Nexus blog, nor of the International Institute for Applied Systems Analysis.
Aug 7, 2017 | Climate Change, Food & Water, Water, Young Scientists
By Parul Tewari, IIASA Science Communication Fellow 2017
In 2016, Bolivia saw its worst drought in nearly 30 years. While the city of La Paz faced an acute water shortage with no piped water in some parts, the agricultural sector was hit the hardest. According to The Agricultural Chamber of the East, the region suffered a loss of almost 50% of total produce. Animal carcasses lay scattered in plain sight in the valleys, where they had died looking for watering holes.
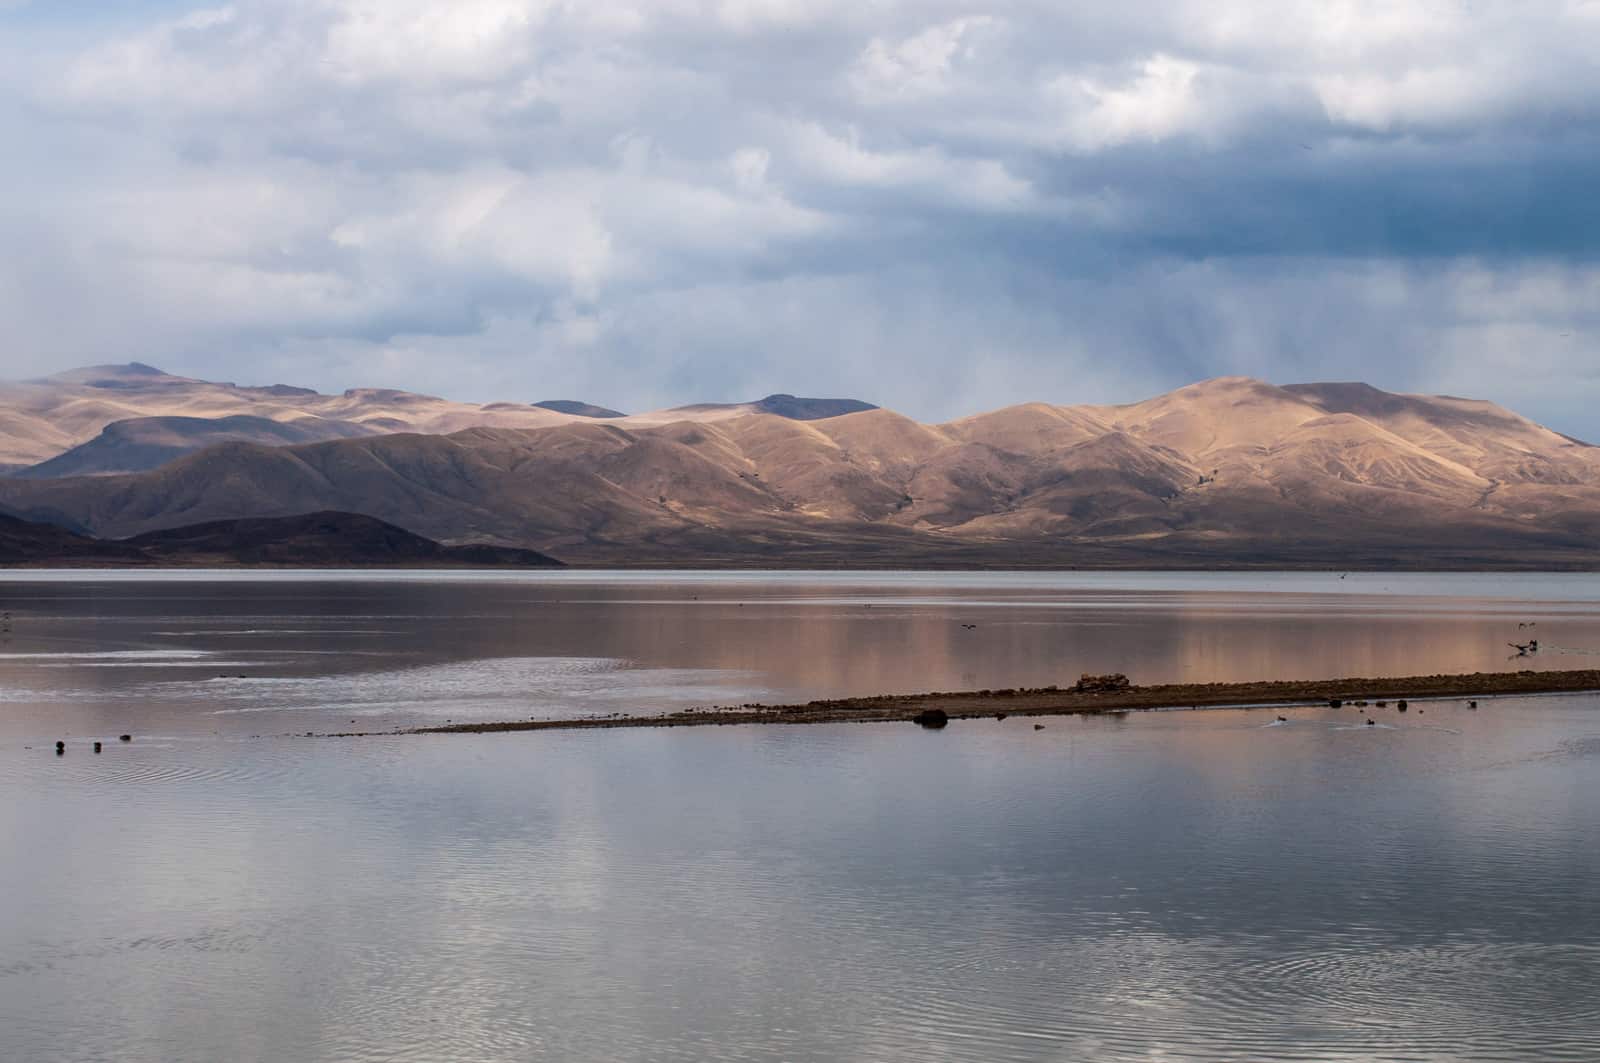
Lake Poopo (Bolivia) before it dried up © David Almeida I Flickr
One of the most dramatic results of this catastrophic drought was that Lake Poopo, (pronounced po-po) Bolivia’s second largest lake was drained of every drop of water. Located at a height of approximately 1127 meters, and covering an area of 1,000 square kilometers, what remains of it now resembles a desert more than a lake. This event forced the fishing community of Uru Uru, which depended on the lake, to either migrate to other lakes or look for alternate livelihood options.
Lake Poopo is located in the central South American Altiplano, one of the largest high plateaus in the world (Bolivia’s largest lake, Titicaca, is located in the north of the region). Due to its unique topography, the highland faces extreme climatic conditions, which are responsible for difficult lives as well as widespread poverty among the people who live there.
While Titicaca is over 100 meters deep, Poopo had a depth of less than three meters. Combined with a high rate of evapotranspiration, erratic rainfall, and limited flow of water from the Desaguadero River, Poopo was in a precarious position even during the best of times. Whatever little water flowed in from the river is further depleted by intensive irrigation activities at the south of Lake Titicaca before the water makes it way down to Poopo.
Sattelite images of Lake Poopo
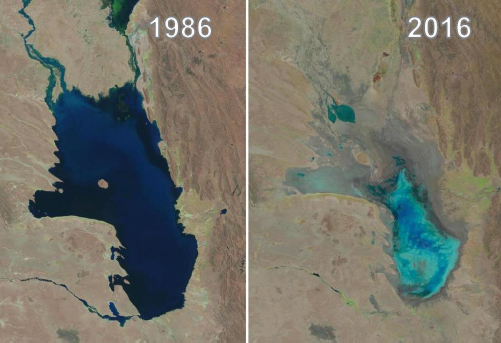
Changes in water levels of Lake Poopo over 30 years © U.S. Geological Survey, Associated Press
The lake’s existence had been threatened several times in the past. However, the 2016 drought was one of the most devastating ones. According to the Defense Ministry of Bolivia, early this year the lake started recovering after several days of heavy rain, restoring as much as 70% of the water. However, since the lake is a part of a very fragile ecosystem, there have been some irreversible changes to the flora and fauna in addition to the losses to the fishing communities living around the lake.
Charting a better future
Claudia Canedo, a participant of the 2017 Young Scientists Summer Program (YSSP) at IIASA, is exploring the impact of droughts and the risk on agricultural production in the light of this event, after which Bolivia declared a state of water emergency. Canedo was born and raised in the city of La Paz and experienced water shortages while growing up close to the Altiplano. This motivated her to investigate a sustainable solution for water availability in the region. With the results of her study she is hoping to ensure that such a situation doesn’t arise again in the Altiplano – that other communities directly dependent on ecosystem services, like that of Lake Poopo, do not have to lose everything because of an extreme weather event.
For a region where more than half the population is dependent on agriculture for their livelihoods, droughts serve as a major setback to the national economy. “It is not just one factor that led to the drought, though. There were different factors that contributed to the drying up of the lake and also contribute to the agricultural distress,” she says.
“The southern Altiplano lies in an arid zone and receives low precipitation due to its proximity to the Atacama Desert. Poor soil quality (high saline content and lack of nutrients) makes it unsuitable for most crops, except quinoa and potato in some areas,” adds Canedo. Residents also lack the knowledge and the monetary resources to invest in newer technology, which could possibly lead to better water management.
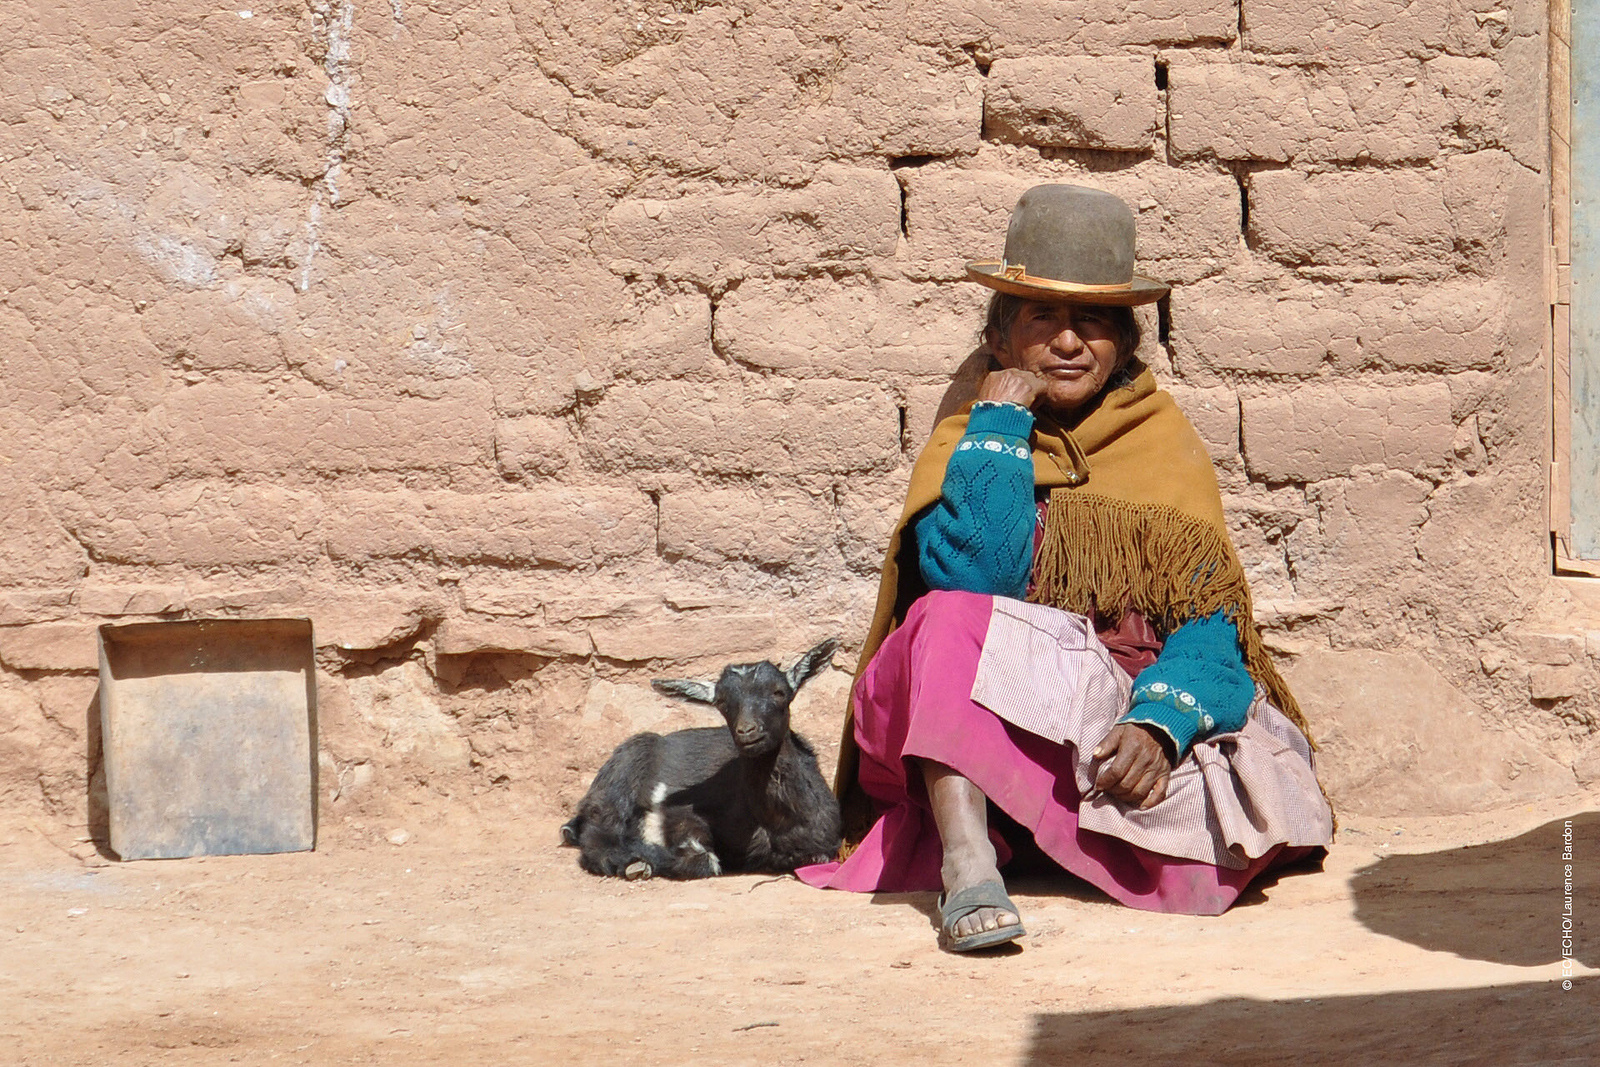
A woman from one of the drought affected communities in Bolivia © EU – Photo credits: EC/ECHO/Laurence Bardon I Flickr
One of the most critical factors in the recent drought was the El Nino- Southern Oscillation, the warming of the sea temperatures in the Pacific Ocean, which in turn carries the warmer oceanic winds and lowers the rate of precipitation in the highland leading to increased evapotranspiration. In 2015 and 2016, the losses due to this phenomenon were devastating for agriculture in the Altiplano, says Canedo.
In her quest to find solutions, the biggest challenge is the lack of recorded data from local weather stations for the past years. Although satellite data is available, it is too generic in nature to do a local analysis. Therefore combining ground and satellite data could enhance the present knowledge and provide consistent results of the climate and vegetation variability. If done successfully, Canedo hopes to identify a correlation between precipitation and vegetation. With this information, she can improve climate forecasting that could help the local people adapt to droughts powerful enough to turn their lives upside down.
With weather forecasts and early warning systems for extreme weather events like droughts, farmers would know what to expect and would be able to plant resilient varieties of crops. This might not earn them the same profits as in a normal year, but would not result in a failed crop. Claudia aims to come up with a drought index useful for drought monitoring and early warning, which will integrate short-term and long-term meteorological predictions.
Perhaps, in the future, with this newfound knowledge, the price for extreme weather events won’t be paid in terms of lost ecosystems like that of Lake Poopo, robbing people of their lives and livelihoods.
About the Researcher
Claudia Canedo is a participant in the 2017 IIASA YSSP. She is pursuing a doctoral program in water resources engineering at Lund University, Sweden. She is interested in studying the hydrological and climatological conditions over small basins in the South American highlands. The aim of her research is to define water resources availability and find strategies for sustainable water management in the semi-arid region.
This article gives the views of the author, and not the position of the Nexus blog, nor of the International Institute for Applied Systems Analysis.
Jul 3, 2017 | Data and Methods, Food
By Victor Maus, IIASA Ecosystems Services and Management Program
Nowadays, satellite images are an abundant supply of data which we can use to get information about our planet and its changes. Satellite images can, for example, help us detect an approaching storm, measure the expansion of a city, identify deforested areas, or estimate how crop areas change over time. Usually, we are interested in extracting information from large areas, for example, deforestation in the Amazon Rainforest (5.5 million km², around 15 times the area of Germany). It would be challenging for us to monitor and map such vast areas without combining satellite images with automated and semi-automated computer programs.

Aerial view of the Amazon Rainforest, near Manaus, Brazil. Monitoring deforestation in the Amazon is difficult because the area is massive and remote. ©Neil Palmer | CIAT
To address this problem, I developed — along with my colleagues Gilberto Camara from the Brazilian National Institute for Space Research and Marius Appel and Edzer Pebesma from the University of Münster, Germany — a new open source software to extract information about land-cover changes from satellite images. The tool maps different crop types (e.g., soybean, maize, and wheat), forests, and grassland, and can be used to support land-use monitoring and planning.
Our software, called dtwSat, is open-source and can be freely installed and used for academic and commercial purposes. It builds upon on other graphical and statistical open-source extensions of the statistical program R. Adding to that, our article in press in Journal of Statistical Software is completely reproducible and provides a step-by-step example of how to use the tool to produce land-cover maps. Given that we have public access to an extensive amount satellite images, we also get much benefit from tools that are openly available, reproducible, and comparable. These, in particular, can contribute to rapid scientific development.
The software dtwSat is based on a method widely used for speech recognition called Dynamic Time Warping (DTW). Instead of spoken words, we adapted DTW to identify ‘phenological cycles’ of the vegetation. These encompass the plants’ life cycle events, such as how deciduous trees lose their leaves in the fall. The software compares a set of phenological cycles of the vegetation measured from satellite images (just like a dictionary of spoken words) with all pixels in successive satellite images, taken at different times. After comparing the satellite time series with all phenological cycles in the dictionary, dtwSat builds a sequence of the land-cover maps according to similarity to the phenological cycles.
The series of maps produced by dtwSat allows for land-cover change monitoring and can help answer questions such as how much of the Amazon rainforest has been replaced with soy or grass for cattle grazing during the last decade? It could also help study the effects of policies and international agreements, such Brazil’s Soy Moratorium, where soybean traders agreed not to buy soy from areas deforested after 2006 in the Brazilian Amazon. If soy farming cannot expand over areas deforested after 2006, it might expand to areas formerly used for cattle grazing deforested before 2006, and force the cattle grazing farmers to open new areas that have been cleared more recently. Therefore, besides monitoring changes, the land-cover information can help better understand direct and indirect drivers of deforestation and support new land-use policy.
Further info: dtwSat is distributed under the GPL (≥2) license. The software is available from the IIASA repository PURE pure.iiasa.ac.at/14514/. Precompiled binary available from CRAN at cran.r-project.org/web/packages/dtwSat/index.html
dtwSat development version available from GitHub at github.com/vwmaus/dtwSat
Reference:
Maus V, Camara G, Appel M, & Pebesma E (2017). dtwSat: Time-Weighted Dynamic Time Warping for Satellite Image Time Series Analysis in R. Journal of Statistical Software (In Press).
Maus, V, Camara, G, Cartaxo, R, Sanchez, A, Ramos, FM, & de Queiroz, GR (2016). A Time-Weighted Dynamic Time Warping Method for Land-Use and Land-Cover Mapping. IEEE Journal of Selected Topics in Applied Earth Observations and Remote Sensing 9 (8): 3729–39.
This article gives the views of the author, and not the position of the Nexus blog, nor of the International Institute for Applied Systems Analysis.
Jun 12, 2017 | Citizen Science
By Linda See, IIASA Ecosystems Services and Management Program
Satellites have changed the way that we see the world. For more than 40 years, we have had regular images of the Earth’s surface, which have allowed us to monitor deforestation, visualize dramatic changes in urbanization, and comprehensively map the Earth’s surface. Without satellites, our understanding of the impacts that humans are having on the terrestrial ecosystem would be much diminished.
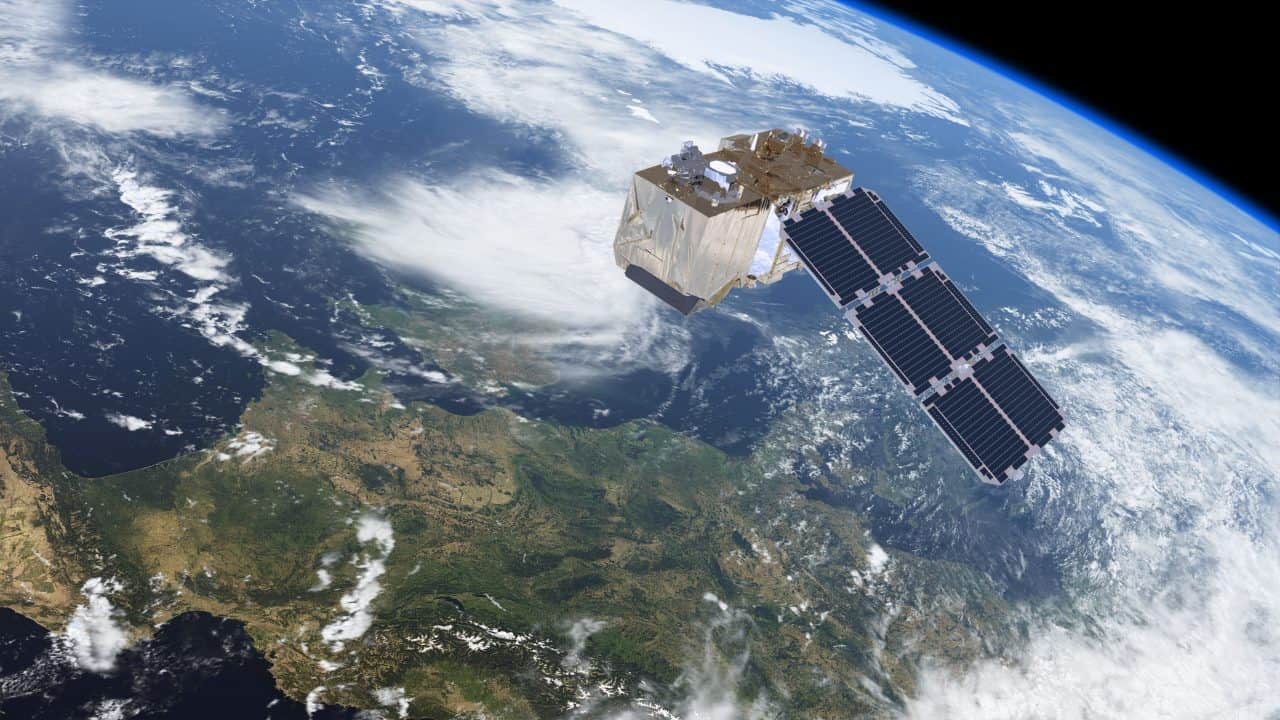
The Sentinel-2 satellite provides high-resolution land-cover data. © ESA/ATG medialab
Over the past decade, many more satellites have been launched, with improvements in how much detail we can see and the frequency at which locations are revisited. This means that we can monitor changes in the landscape more effectively, particularly in areas where optical imagery is used and cloud cover is frequent. Yet perhaps even more important than these technological innovations, one of the most pivotal changes in satellite remote sensing was when NASA opened up free access to Landsat imagery in 2008. As a result, there has been a rapid uptake in the use of the data, and researchers and organizations have produced many new global products based on these data, such as Matt Hansen’s forest cover maps, JRC’s water and global human settlement layers, and global land cover maps (FROM-GLC and GlobeLand30) produced by different groups in China.
Complementing Landsat, the European Space Agency’s (ESA) Sentinel-2 satellites provide even higher spatial and temporal resolution, and once fully operational, coverage of the Earth will be provided every five days. Like NASA, ESA has also made the data freely available. However, the volume of data is much higher, on the order of 1.6 terabytes per day. These data volumes, as well as the need to pre-process the imagery, can pose real problems to new users. Pre-processing can also lead to incredible duplication of effort if done independently by many different organizations around the world. For example, I attended a recent World Cover conference hosted by ESA, and there were many impressive presentations of new applications and products that use these openly available data streams. But most had one thing in common: they all downloaded and processed the imagery before it was used. For large map producers, control over the pre-processing of the imagery might be desirable, but this is a daunting task for novice users wanting to really exploit the data.
In order to remove these barriers, we need new ways of providing access to the data that don’t involve downloading and pre-processing every new data point. In some respects this could be similar to the way in which Google and Bing provide access to very high-resolution satellite imagery in a seamless way. But it’s not just about visualization, or Google and Bing would be sufficient for most user needs. Instead it’s about being able to use the underlying spectral information to create derived products on the fly. The Google Earth Engine might provide some of these capabilities, but the learning curve is pretty steep and some programming knowledge is required.
Instead, what we need is an even simpler system like that produced by Sinergise in Slovenia. In collaboration with Amazon Web Services, the Sentinel Hub provides access to all Sentinel-2 data in one place, with many different ways to view the imagery, including derived products such as vegetation status or on-the-fly creation of user-defined indices. Such a system opens up new possibilities for environmental monitoring without the need to have either remote sensing expertise, programming ability, or in-house processing power. An exemplary web application using Sentinel Hub services, the Sentinel Playground, allows users to browse the full global multi-spectral Sentinel-2 archive in matter of seconds.
This is why we have chosen Sentinel Hub to provide data for our LandSense Citizen Observatory, an initiative to harness remote sensing data for land cover monitoring by citizens. We will access a range of services from vegetation monitoring through to land cover change detection and place the power of remote sensing within the grasp of the crowd.
Without these types of innovations, exploitation of the huge volumes of satellite data from Sentinel-2, and other newly emerging sources of satellite data, will remain within the domain of a small group of experts, creating a barrier that restricts many potential applications of the data. Instead we must encourage developments like Sentinel Hub to ensure that satellite remote sensing becomes truly usable by the masses in ways that benefits everyone.
This article gives the views of the author, and not the position of the Nexus blog, nor of the International Institute for Applied Systems Analysis.
Jun 24, 2016 | Climate, Food
By Daniel Mason-D’Croz, Senior Research Analyst at International Food Policy Research Institute (IFPRI)
(This post was originally published on the IFPRI Research Blog)
There are many challenges confronting decision makers in building robust and effective policies. They must balance pressing short-term needs with long-run challenges. They must confront these varying demands while facing imperfect knowledge of the complex systems (i.e. the economy, the environment, etc.) in which their policies will have impact. Above all, they also face the same uncertainty about the future as the rest of us, making perfect prediction about future outcomes impossible.
Nevertheless, decision makers must make choices in response to future challenges; inaction itself is an implicit choice, as change is inevitable. The challenge is to find a way to improve decision making, and in Multi-factor, multi-state, multi-model scenarios: exploring food and climate futures for Southeast Asia, recently published in Environmental Modelling Software, we believe we have presented a unique methodology to improve the decision-making process, by leveraging a participatory stakeholder-driven scenario development process with a multi-model ensemble to interactively explore future uncertainty with regional stakeholders.
This methodology was first applied in a workshop in Vietnam, where a diverse set of stakeholders from a wide range of sectors in Cambodia, Laos, and Vietnam collaborated to develop four multidimensional scenarios focusing on future agricultural development, food security, and climate change. Through building these multidimensional scenarios, stakeholders were challenged to consider potential interactions between varied parts of complex systems, like society and the environment. By doing this with a diverse set of stakeholders from public and private sectors, participants considered the future in a holistic and multidisciplinary manner. They were asked not only how different the future might look from the present, but also how they might respond to and shape future change. In so doing, regional stakeholders gained a better understanding of future uncertainty, while introspectively reviewing their own assumptions on the drivers of change, while creating four diverse scenarios that presented challenging plausible futures.
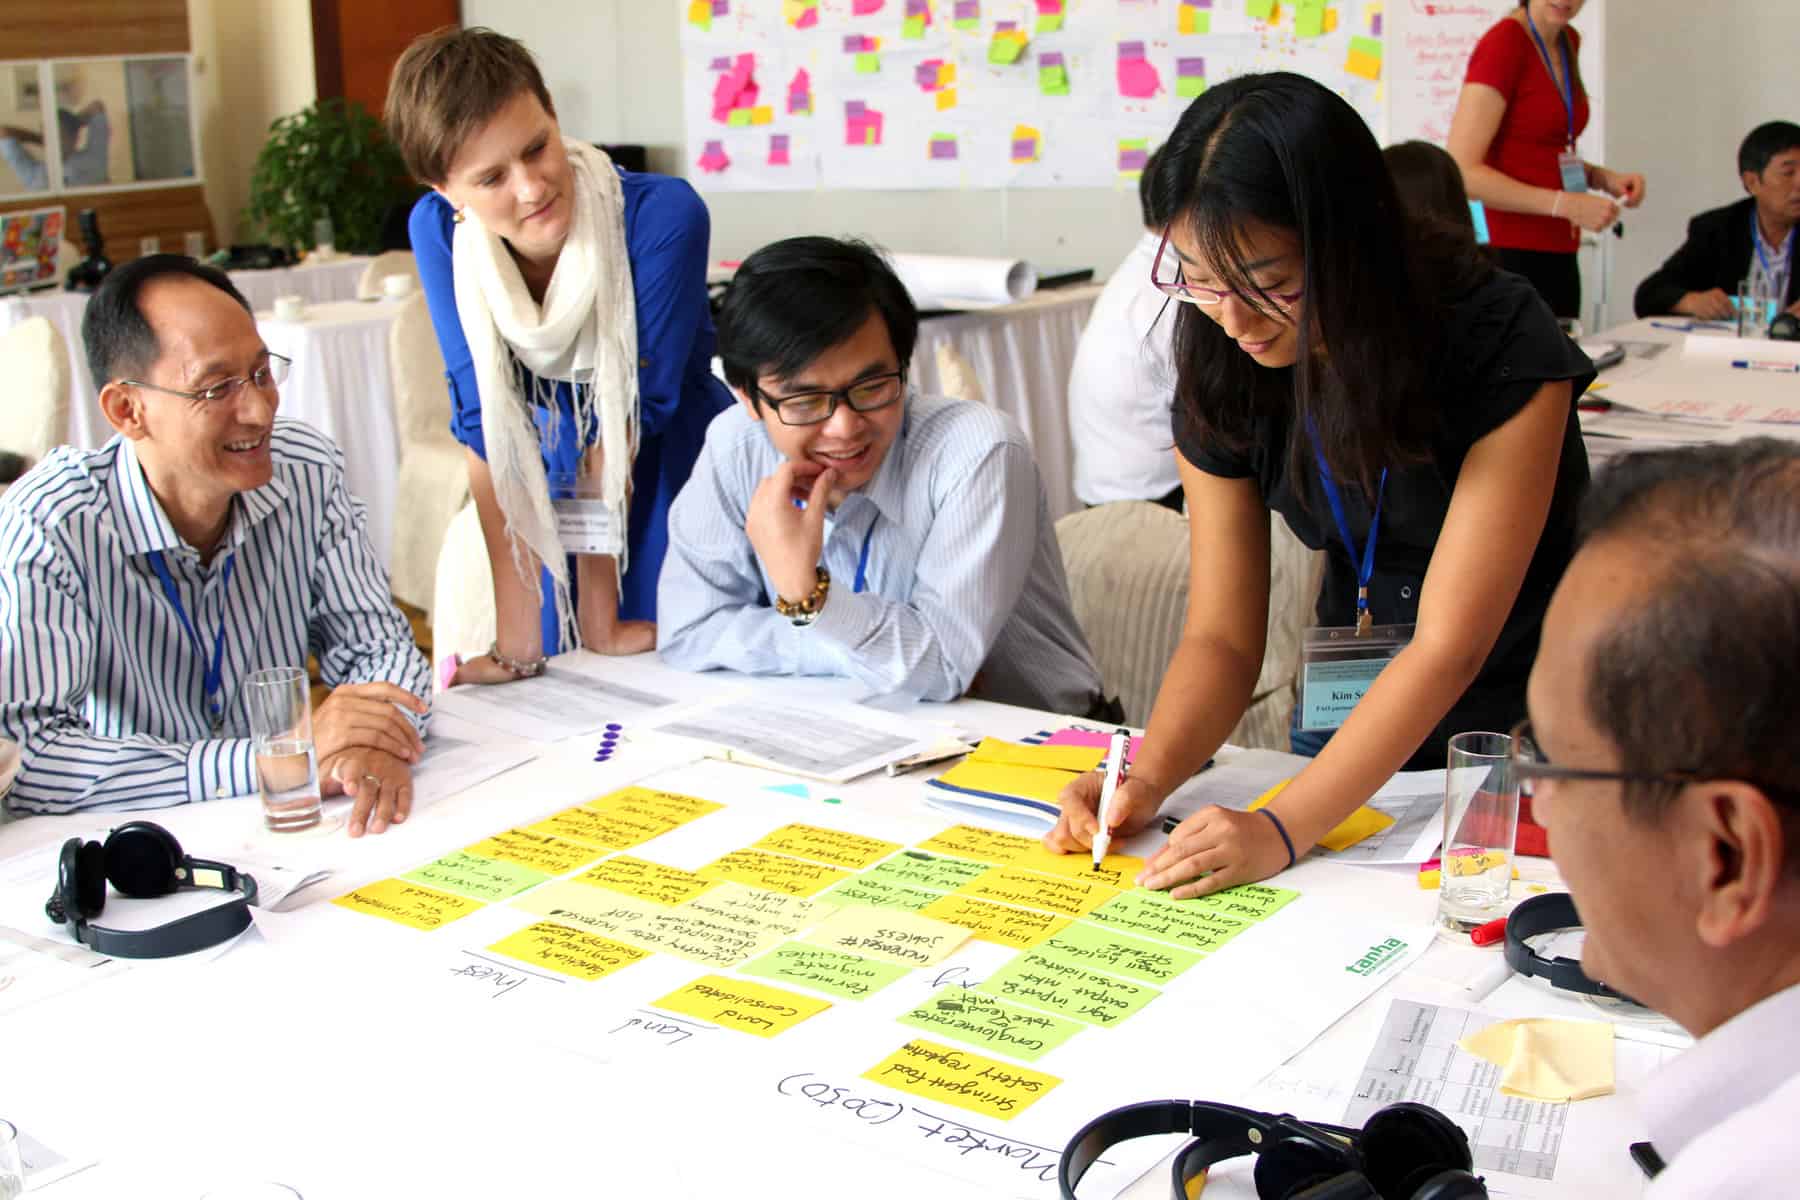
Participants at a 2013 workshop in Ha Long Bay, Vietnam – including regional stakeholders from development organizations, governments, the private sector, civil society, and academia – game out policies for the future of agriculture in Southeast Asia under different climate change scenarios, in an innovative approach combining collaboration with predictive modeling. © CGIAR photo
These scenarios were then quantified and simulated using a series of climate models, crop simulation models, and economic models including IFPRI’s IMPACT model and IIASA’s GLOBIOM model. Quantifying the scenarios in models can assist decision makers by pairing the qualitative aspects of the scenarios with quantitative analysis that systematically considers complex interactions and potential unintended consequences. Doing this quantification across a multi-model ensemble maintains the scenario diversity and richness, which in turn ensures that a broad possibility space is maintained throughout the process. This offers decision makers a larger test bed in which to evaluate potential policies. This multidimensionality and diversity of scenario outputs has been well received in the region, allowing them to be adapted and reused in a variety of policy engagements in Cambodia, Laos, and Vietnam.
- In Cambodia, scenario results were used to inform their Climate Change Priorities Action Plan (CCPAP) to better target and prioritize the spending of its 164 million U.S. dollar projected budget, a policy engagement that was done over 6 to 8 months as scenario analysis and use were embedded in the CCPAP
- In Laos, scenario results were presented in a regional workshop led by CCAFS and UNEP WCMC to evaluate regional policies for economic development, agricultural development, and climate change and consider potential environmental tradeoffs
- In Vietnam, scenario results were shared in a workshop led by CCAFS and FAO to review and revise climate-smart agriculture investments proposals by considering the potential effectiveness of different investments under various climatic and socioeconomic conditions
The regional scenarios were a collaborative effort that involved colleagues from many institutions including IFPRI, IIASA, FAO, UNEP WCMC, the CGIAR research program on Climate Change, Agriculture and Food Security (CCAFS), and the University of Oxford, among others. It would not have been possible without the funding and support from CCAFS, the CGIAR research program on Policies, Institutions, and Markets (PIM),Global Futures and Strategic Foresight, the FAO’s program on Economic and Policy Innovations for Climate-Smart Agriculture (EPIC), and UNEP WCMC through a MacArthur Foundation grant.
Reference
Mason-D’Croz D, et. al. (2016). Multi-factor, multi-state, multi-model scenarios: Exploring food and climate futures for Southeast Asia. Environmental Modelling & Software
Volume 83, September 2016, Pages 255–270. doi:10.1016/j.envsoft.2016.05.008
Note: This article gives the views of the author, and not the position of the Nexus blog, nor of the International Institute for Applied Systems Analysis.

You must be logged in to post a comment.