Nov 7, 2017 | Data and Methods, Food, Postdoc, Water
By Valeria Javalera Rincón, IIASA CONACYT Postdoctoral Fellow in the Ecosystems Services and Management and Advanced Systems Analysis programs.
What is more important: water, energy, or food?
If you work in the water, energy or agriculture sector we can guess what your answer might be! But if you are a policy or decision maker trying to balance all three, then you know that it is getting more and more difficult to meet the growing demand for water, energy, and food with the natural resources available. The need for this balance was confirmed by the 17 Sustainable Development Goals, agreed by 193 countries, and the Paris climate agreement. But how to achieve it? Intelligent cooperation is the key.
The thing is that water, energy, and food are all related in such a way that are reliant on each other for production or distribution. This is the so-called Water-Energy-Food nexus. In many cases, you need water to produce energy, you need energy to pump water, and you need water and energy to produce, distribute, and conserve food.
Many scientists have tried to relate or to link models for water, agriculture, land, and energy to study these synergic relationships. In general, so far, there are two ways that this has been solved: One is integrating models with “hard linkages” like this:
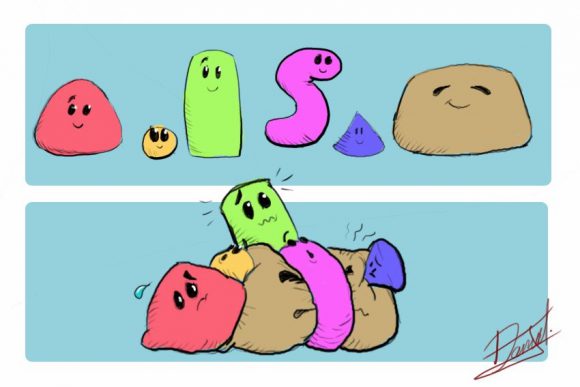
© Daniel Javalera
In the picture there are six models (let’s say water, land use, hydro energy, gas, coal, food production models) that are then integrated into just one. The resulting integrated model then preserves the relationships but is complex, and in order to make it work with our current computer power you often have to sacrifice details.
Another way is to link them is using so-called “soft linkages” where the output of one model is the input of the next one, like this:
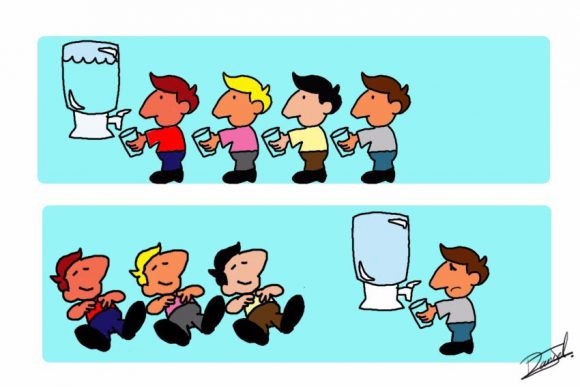
© Daniel Javalera
In the picture, each person is a model and the input is the amount of water left. These models all refer to a common resource (the water) and are connected using “soft linkages.” These linkages are based on sequential interaction, so there is no feedback, and no real synergy.
The intelligent linker agent
But what if we could have the relations and synergies between the models? It would mean much more accurate findings and helpful policy advice. Well, now we can. The secret is to link through an intelligent linker agent.
I developed a methodology in which an intelligent linker agent is used as a “negotiator” between models that can communicate with each other. This negotiator applies a machine-learning algorithm that gives it the capability to learn from the interactions with the models. Through these interactions, the intelligent linker can advise on globally optimal actions.
The knowledge of the intelligent linker is based on past experience and also on hypothetical future actions that are evaluated in a training process. This methodology has been used to link drinking water networks, such as Barcelona’s drinking water network.
When I came to IIASA, I was asked to apply this approach to optimize trading between cities in the Shanxi region of China. I used a set of previously development models which aimed to distribute water and land available for each city in order to produce food (eight types of crops) and coal for energy. The intelligent linker agent optimizes trading between cities in order to satisfy demand at the lowest cost for each city.
The purpose of this exercise was to compare the solutions with those from “hard linkages” – like those in the first picture. We found that the intelligent linker is flexible enough to find the optimal solution to questions such as: How much of each of these products should each city export/import to satisfy global demand at a global lower economic and ecological cost? What actions are optimal when the total production is insufficient to meet the total demand? Under what conditions is it preferable to stop imports/exports when production is insufficient to supply the demand of each city?
The answers to these questions can be calculated by the interaction with the models of each city just by the interfacing with the intelligent linker agent, this means that no major changes in the models of each city were needed. We also found that, under the same conditions, the solutions using the intelligent linker agent were in agreement with those found when hard linking was used.
My next challenge is to build a prototype of a “distributed computer platform,” which will allow us to link models on different computers in different parts of the world—so that we in Austria could link to a model built by colleagues in Brazil, for example. I also want to link models of different sectors and regions of the globe, in order to prove that intelligent cooperation is the key to improving global welfare.
References
Xu X, Gao J, Cao G-Y, Ermoliev Y, Ermolieva T, Kryazhimskiy AV, & Rovenskaya E (2015). Modeling water-energy-food nexus for planning energy and agriculture developments: case study of coal mining industry in Shanxi province, China. IIASA Interim Report. IIASA, Laxenburg, Austria: IR-15-020
Javalera V, Morcego B, & Puig V, Negotiation and Learning in distributed MPC of Large Scale Systems, Proceedings of the 2010 American Control Conference, Baltimore, MD, 2010, pp. 3168-3173. doi: 10.1109/ACC.2010.5530986
Valeria J, Morcego B, & Puig V, Distributed MPC for Large Scale Systems using Agent-based Reinforcement Learning, In IFAC Proceedings Volumes, Volume 43, Issue 8, 2010, Pages 597-602, ISSN 1474-6670, ISBN 9783902661913, https://doi.org/10.3182/20100712-3-FR-2020.00097.
Morcego B, Javalera V, Puig V, & Vito R (2014). Distributed MPC Using Reinforcement Learning Based Negotiation: Application to Large Scale Systems. In: Maestre J., Negenborn R. (eds) Distributed Model Predictive Control Made Easy. Intelligent Systems, Control and automation: Science and Engineering, vol 69. Springer, Dordrecht
Javalera Rincón V, Distributed large scale systems: a multi-agent RL-MPC architecture, Universitat Politècnica de Catalunya. Institut d’Organització i Control de Sistemes Industrials,Doctoral thesis. 2016. http://upcommons.upc.edu/handle/2117/96332
Note: This article gives the views of the author and not the position of the Nexus blog, nor of the International Institute for Applied Systems Analysis.
Sep 19, 2017 | Citizen Science, Food, Sustainable Development
By Myroslava Lesiv, IIASA Ecosystems Services and Management Program.
The public can contribute considerably to science by filling the gaps of missing information in many research areas, for example, monitoring land use, biodiversity, or forest degradation. Crowdsourcing campaigns organized by research institutions bring together citizens interested in science and help solving research questions to the benefit of the whole world.
This June, the IIASA Geo-Wiki team ran the Global Field Size campaign, encouraging citizen scientists to classify field sizes on satellite images. Its aim was to develop a global field sizes dataset, which will be used as input to create an improved global cropland field size map for agricultural monitoring and food security assessments. The field sizes dataset can also help us determine what types of satellite data are needed for agricultural monitoring in different parts of the world.

Geo-Wiki interface for collecting field size data. Background layer: Google Maps.
Why are field sizes so important? They provide us with valuable information to tackle challenges of food security. A recent study showed that more than a half the food calories produced globally comes from smallholder farmers, who often make up the most vulnerable parts of population, living in poverty. Within this scope, the field size dataset fills the gaps of missing information, especially for countries that have a limited food supply and lack a well-developed agricultural monitoring system.
The Global Field Size campaign has been one of the most successful crowdsourcing campaigns run through the Geo-Wiki engagement platform. Within one month, 130 participants completed 390,000 tasks – that is, they classified the field sizes in 130,000 locations around the globe!
So we can see that crowdsourcing is powerful, but can we trust the data? Is it accurate enough to be used in different applications? I think it is! The Geo-Wiki team has significant experience in running crowdsourcing campaigns; one of the key lessons we have learned from previous Geo-Wiki campaigns is the importance of training the public to increase the quality of the crowdsourced data.
This campaign was designed so that the participants learned over time how to delineate fields in different regions of the world, and, at the same time, pay special attention to the quality of their submissions. At the end of the campaign, the majority of participants gave us a feedback that, to them, this campaign was indeed a learning exercise. From our end, I have to add, this was also a challenging campaign, as fields are so diverse in shape, continuity of coverage, crop type, irrigation, etc.

Global distribution of dominant field sizes. Cartography by Myroslava Lesiv. Country boundaries: GAUL. Software: ArcMap 10.1.
During the campaign, the crowd was asked to identify whether there were fields in a certain location, and determine the relevant field sizes by the visual interpretation of very high-resolution Google and Bing imagery. A “field” was defined as an agricultural area that included annual or perennial croplands, fallow, shifting cultivation, pastures or hayfields. The collected data can also be used to identify areas falsely mapped as cropland.
Now the team is focused on summarizing the results of the campaign, processing the collected field size data, and preparing them for scientific publication. We will ensure that the published dataset is of high quality and can be used by others with confidence!
This article gives the views of the author, and not the position of the Nexus blog, nor of the International Institute for Applied Systems Analysis.
Jul 3, 2017 | Data and Methods, Food
By Victor Maus, IIASA Ecosystems Services and Management Program
Nowadays, satellite images are an abundant supply of data which we can use to get information about our planet and its changes. Satellite images can, for example, help us detect an approaching storm, measure the expansion of a city, identify deforested areas, or estimate how crop areas change over time. Usually, we are interested in extracting information from large areas, for example, deforestation in the Amazon Rainforest (5.5 million km², around 15 times the area of Germany). It would be challenging for us to monitor and map such vast areas without combining satellite images with automated and semi-automated computer programs.

Aerial view of the Amazon Rainforest, near Manaus, Brazil. Monitoring deforestation in the Amazon is difficult because the area is massive and remote. ©Neil Palmer | CIAT
To address this problem, I developed — along with my colleagues Gilberto Camara from the Brazilian National Institute for Space Research and Marius Appel and Edzer Pebesma from the University of Münster, Germany — a new open source software to extract information about land-cover changes from satellite images. The tool maps different crop types (e.g., soybean, maize, and wheat), forests, and grassland, and can be used to support land-use monitoring and planning.
Our software, called dtwSat, is open-source and can be freely installed and used for academic and commercial purposes. It builds upon on other graphical and statistical open-source extensions of the statistical program R. Adding to that, our article in press in Journal of Statistical Software is completely reproducible and provides a step-by-step example of how to use the tool to produce land-cover maps. Given that we have public access to an extensive amount satellite images, we also get much benefit from tools that are openly available, reproducible, and comparable. These, in particular, can contribute to rapid scientific development.
The software dtwSat is based on a method widely used for speech recognition called Dynamic Time Warping (DTW). Instead of spoken words, we adapted DTW to identify ‘phenological cycles’ of the vegetation. These encompass the plants’ life cycle events, such as how deciduous trees lose their leaves in the fall. The software compares a set of phenological cycles of the vegetation measured from satellite images (just like a dictionary of spoken words) with all pixels in successive satellite images, taken at different times. After comparing the satellite time series with all phenological cycles in the dictionary, dtwSat builds a sequence of the land-cover maps according to similarity to the phenological cycles.
The series of maps produced by dtwSat allows for land-cover change monitoring and can help answer questions such as how much of the Amazon rainforest has been replaced with soy or grass for cattle grazing during the last decade? It could also help study the effects of policies and international agreements, such Brazil’s Soy Moratorium, where soybean traders agreed not to buy soy from areas deforested after 2006 in the Brazilian Amazon. If soy farming cannot expand over areas deforested after 2006, it might expand to areas formerly used for cattle grazing deforested before 2006, and force the cattle grazing farmers to open new areas that have been cleared more recently. Therefore, besides monitoring changes, the land-cover information can help better understand direct and indirect drivers of deforestation and support new land-use policy.
Further info: dtwSat is distributed under the GPL (≥2) license. The software is available from the IIASA repository PURE pure.iiasa.ac.at/14514/. Precompiled binary available from CRAN at cran.r-project.org/web/packages/dtwSat/index.html
dtwSat development version available from GitHub at github.com/vwmaus/dtwSat
Reference:
Maus V, Camara G, Appel M, & Pebesma E (2017). dtwSat: Time-Weighted Dynamic Time Warping for Satellite Image Time Series Analysis in R. Journal of Statistical Software (In Press).
Maus, V, Camara, G, Cartaxo, R, Sanchez, A, Ramos, FM, & de Queiroz, GR (2016). A Time-Weighted Dynamic Time Warping Method for Land-Use and Land-Cover Mapping. IEEE Journal of Selected Topics in Applied Earth Observations and Remote Sensing 9 (8): 3729–39.
This article gives the views of the author, and not the position of the Nexus blog, nor of the International Institute for Applied Systems Analysis.
Oct 4, 2016 | Climate Change, Food
By David Leclère, IIASA Ecosystems Services and Management Program
August was the warmest ever recorded globally, as was every single month since October 2015. It will not take long for these records to become the norm, and this will tremendously challenge food provision for everyone on the planet. Each additional Celsius degree in global mean temperature will reduce wheat yield by about 5%. While we struggle to take action for limiting global warming by the end of the century to 2°C above preindustrial levels, business as usual scenarios come closer to +5 °C.
However, we lack good and actionable knowledge on this perfect storm in the making. Despite the heat, world wheat production should hit a new record high in 2016, but EU production is expected to be 10% lower than last year. In France, this drop should be around 25-30% and one has to go back to 1983 to find yields equally low. Explanations indeed now point to weather as a large contributor. But underlying mechanisms were poorly anticipated by forecasts and are poorly addressed in climate change impacts research.
©Paul Townsend via Flickr
Second, many blind spots remain. For example, livestock has a tremendous share in the carbon footprint of agriculture, but also a high nutritional and cultural value. Yet, livestock were not even mentioned once in the summary for policymakers of the last IPCC report dedicated to impacts and adaptation. Heat stress reduces animal production, and increases greenhouse gas emissions per unit of product. In addition, a lower share of animal products in our diet could dramatically reduce pollution and food insecurity. However, we don’t understand well consumers’ preferences in that respect, and how they can be translated in actionable policies.
How can we generate adequate knowledge in time while climate is changing? To be able to forecast yields and prevent dramatic price swings like the 2008 food crisis? To avoid bad surprises due to large missing knowledge, like the livestock question?
In short: it will take far more research to answer these questions—and that means a major increase in funding.
I recently presented two studies by our team at a scientific conference in Germany, which was organized by a European network of agricultural research scientists (MACSUR). One was a literature review on how to estimate the consequences of heat stress on livestock at a global scale. The other one presented scenarios on future food security in Europe, generated in a way that delivers useful knowledge for stakeholders. The MACSUR network was funded as a knowledge hub to foster interactions between research institutes of European countries. In many countries, the funding covered travels and workshops, not new research. Of course, nowadays researchers have to compete for funding to do actual research.
So let’s play the game. The MACSUR network is now aiming at a ‘Future and Emerging Technologies Flagship’, the biggest type of EU funding: 1 billion Euros over 10 years for hundreds of researchers. Recent examples include the Human Brain Project, the Graphene Flagship, and the Quantum Technology Flagship. We are trying to get one on modeling food security under climate change.

© Sacha Drouart
Such a project could leapfrog our ability to deal with climate change, a major societal challenge Europe is confronted with (one of the two requirements for FET Flagship funding). The other requirement gave us a hard time at first sight: generating technological innovation, growth and jobs in Europe -but one just needs the right lens. First, agriculture already sustains about 44 million jobs in the EU and this will increase if we are serious about reducing the carbon content of our economy. Second, data now flows at an unprecedented speed (aka, big data). Think about the amount of data acquired with Pokemon Go, and imagine we would harness such concept for science through crowdsourcing and citizen-based science. With such data, agricultural forecasts would perform much better. Similarly, light drones and connected devices will likely open a new era for farm management. Third, we need models that translate big data into knowledge, and not only for the agricultural sector. Similarly, models can also be powerful tools to confront views and could trigger large social innovation.
To get this funding, we need support from a lot of people. The Graphene project claimed support from than 3500 actors, from citizens to industrial players in Europe. We have until end of November to reach 3500 votes, at least. If you think EU should give food security under climate change the same importance as improving the understanding of the human brain, or developing quantum computers, we need you. This will simply never happen without you! Please help us out with two simple actions:
- Go the proposal, and vote for/comment it (see instructions, please highlight the potential for concrete innovations)!
- Spread the word – share this post with your friends, your family, and your colleagues!
Note: This article gives the views of the author, and not the position of the Nexus blog, nor of the International Institute for Applied Systems Analysis.
Jun 24, 2016 | Climate, Food
By Daniel Mason-D’Croz, Senior Research Analyst at International Food Policy Research Institute (IFPRI)
(This post was originally published on the IFPRI Research Blog)
There are many challenges confronting decision makers in building robust and effective policies. They must balance pressing short-term needs with long-run challenges. They must confront these varying demands while facing imperfect knowledge of the complex systems (i.e. the economy, the environment, etc.) in which their policies will have impact. Above all, they also face the same uncertainty about the future as the rest of us, making perfect prediction about future outcomes impossible.
Nevertheless, decision makers must make choices in response to future challenges; inaction itself is an implicit choice, as change is inevitable. The challenge is to find a way to improve decision making, and in Multi-factor, multi-state, multi-model scenarios: exploring food and climate futures for Southeast Asia, recently published in Environmental Modelling Software, we believe we have presented a unique methodology to improve the decision-making process, by leveraging a participatory stakeholder-driven scenario development process with a multi-model ensemble to interactively explore future uncertainty with regional stakeholders.
This methodology was first applied in a workshop in Vietnam, where a diverse set of stakeholders from a wide range of sectors in Cambodia, Laos, and Vietnam collaborated to develop four multidimensional scenarios focusing on future agricultural development, food security, and climate change. Through building these multidimensional scenarios, stakeholders were challenged to consider potential interactions between varied parts of complex systems, like society and the environment. By doing this with a diverse set of stakeholders from public and private sectors, participants considered the future in a holistic and multidisciplinary manner. They were asked not only how different the future might look from the present, but also how they might respond to and shape future change. In so doing, regional stakeholders gained a better understanding of future uncertainty, while introspectively reviewing their own assumptions on the drivers of change, while creating four diverse scenarios that presented challenging plausible futures.
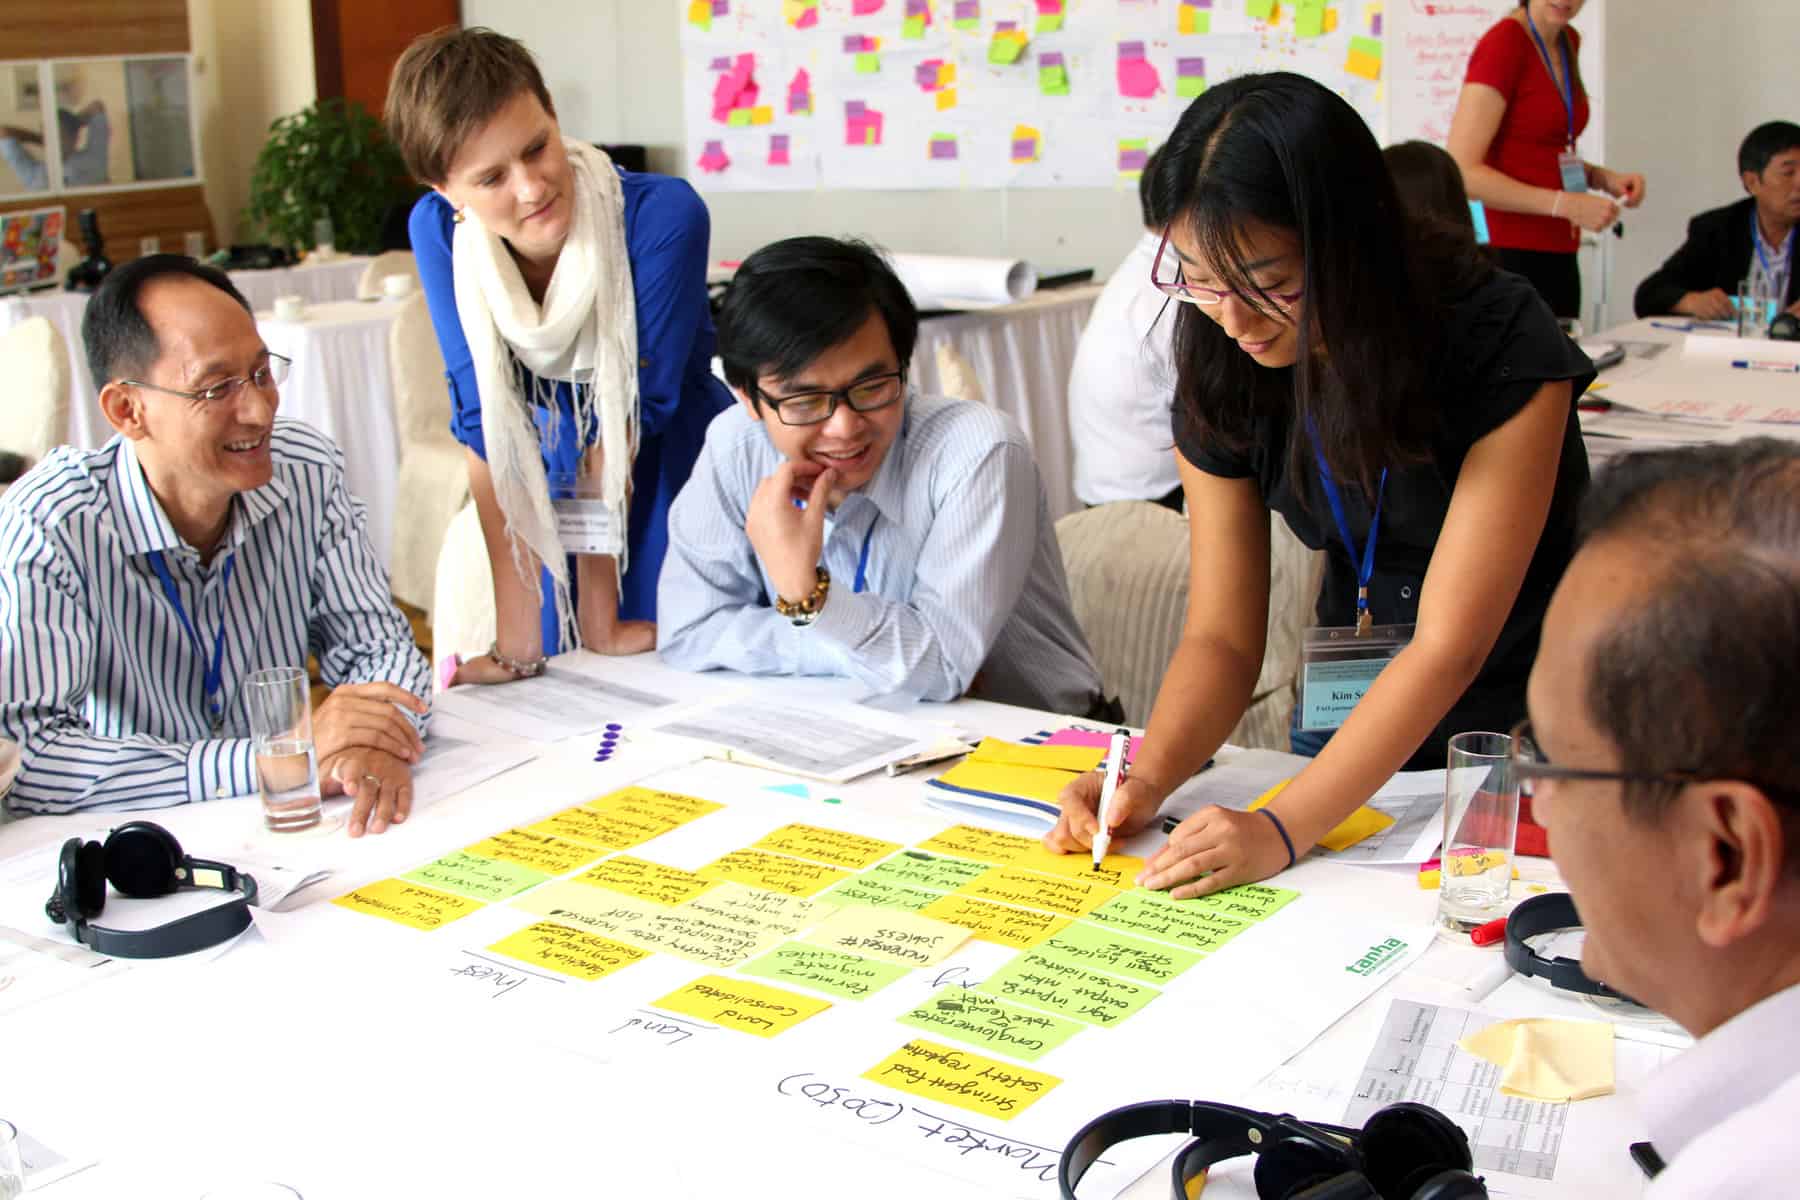
Participants at a 2013 workshop in Ha Long Bay, Vietnam – including regional stakeholders from development organizations, governments, the private sector, civil society, and academia – game out policies for the future of agriculture in Southeast Asia under different climate change scenarios, in an innovative approach combining collaboration with predictive modeling. © CGIAR photo
These scenarios were then quantified and simulated using a series of climate models, crop simulation models, and economic models including IFPRI’s IMPACT model and IIASA’s GLOBIOM model. Quantifying the scenarios in models can assist decision makers by pairing the qualitative aspects of the scenarios with quantitative analysis that systematically considers complex interactions and potential unintended consequences. Doing this quantification across a multi-model ensemble maintains the scenario diversity and richness, which in turn ensures that a broad possibility space is maintained throughout the process. This offers decision makers a larger test bed in which to evaluate potential policies. This multidimensionality and diversity of scenario outputs has been well received in the region, allowing them to be adapted and reused in a variety of policy engagements in Cambodia, Laos, and Vietnam.
- In Cambodia, scenario results were used to inform their Climate Change Priorities Action Plan (CCPAP) to better target and prioritize the spending of its 164 million U.S. dollar projected budget, a policy engagement that was done over 6 to 8 months as scenario analysis and use were embedded in the CCPAP
- In Laos, scenario results were presented in a regional workshop led by CCAFS and UNEP WCMC to evaluate regional policies for economic development, agricultural development, and climate change and consider potential environmental tradeoffs
- In Vietnam, scenario results were shared in a workshop led by CCAFS and FAO to review and revise climate-smart agriculture investments proposals by considering the potential effectiveness of different investments under various climatic and socioeconomic conditions
The regional scenarios were a collaborative effort that involved colleagues from many institutions including IFPRI, IIASA, FAO, UNEP WCMC, the CGIAR research program on Climate Change, Agriculture and Food Security (CCAFS), and the University of Oxford, among others. It would not have been possible without the funding and support from CCAFS, the CGIAR research program on Policies, Institutions, and Markets (PIM),Global Futures and Strategic Foresight, the FAO’s program on Economic and Policy Innovations for Climate-Smart Agriculture (EPIC), and UNEP WCMC through a MacArthur Foundation grant.
Reference
Mason-D’Croz D, et. al. (2016). Multi-factor, multi-state, multi-model scenarios: Exploring food and climate futures for Southeast Asia. Environmental Modelling & Software
Volume 83, September 2016, Pages 255–270. doi:10.1016/j.envsoft.2016.05.008
Note: This article gives the views of the author, and not the position of the Nexus blog, nor of the International Institute for Applied Systems Analysis.
You must be logged in to post a comment.