Nov 25, 2016 | Climate Change, Demography
Samir KC is a researcher in the IIASA World Population Program. He worked on the population projections that form the “human core” of the Shared Socioeconomic Pathways (SSPs), a set of scenarios designed for climate change research, but increasingly being applied more broadly to research in sustainability and environmental change.
What are the SSPs?
The Shared Socioeconomic Pathways are about the future, how the future could look like under different set of conditions. When we want to talk about the future or we need to think about the future, we always have to do some kind of a projection. Whatever the topic is, even in our personal life, we can use scenarios to map out how things might develop, creating different pathways, which can allow us to better understand how our choices could affect these pathways.
Socioeconomic means the major factors socially as well as economically that can affect future changes on our planet—demographic, socially, and economic. But within this broad umbrella, there are multiple disciplines who work on their own topics and have their own methods and data. If they want to work together they have to match with each other so that output of one work could be the input to another group. That’s why the word shared is there.
The SSPs were developed for the Intergovernmental Panel on Climate Change (IPCC). Why were they needed?
For one thing, we just needed to update the data from the earlier generation of emissions scenarios, and define new scenarios. But secondly, the focus changed a bit between the IPCC’s last report and the most recent one, released in 2014. In the new scenarios, the focus is more on challenges to adaptation and mitigation of climate change. These dimensions are harder to incorporate because they depend on a lot of socioeconomic factors.

Researchers use scenarios to map out a range of possible future developments in the socioeocomic factors that influence climate change. © Salvatore Vastano via Flickr
You worked specifically on the population projections for the SSPs, which were published in 2014. How did this process work?
The first thing that we did was to define narratives for each of the SSPs, essentially a story about how the world would look like in the future. This first part is very important. These narratives were based on the current knowledge of science and how the variables are related and interact.
Then for each of the pathways, we had to start defining the variables like population, urbanization, technological change, and economy. Since population is one of the first variables you need in order to calculate other socioeconomic variables, it was the first thing we looked at when turning the narratives into a quantitative projection. Population is needed as a multiplier to calculate demand in the future, for example to calculate how much energy will be required in the future, how much water, and many other things. At the same time when there are adverse effects of climate change, the population determines how many people are impacted as well as who and where. For example the air pollution group who would need population to see how will air pollution affect the population. So population is an important variable.
It was an iterative process—there were lots of calls, involving sometimes 10 or 15 people from many different fields. Whenever we had something to share or something to decide, it was done in this big group. It was a lot of talking and listening to others. That was a very educational for me, because I learned a lot about how people are using population data. It was a very good dialogue—people had sometimes very simple questions but sometimes very interesting questions about population, fertility, mortality, and those kinds of things.
How did your population projections differ from previous demographic data used for climate research?
In most climate research, until recently, population was used as a total number. Populations were assumed to be homogenous—everybody the same, the average will represent everyone. We argued that that is not the case, that you need to consider population heterogeneity, not only age and sex, but also education levels. There is a growing body of research showing that these details make a difference.
Still not everybody is using it, but for example, people working on GDP have used it, and hopefully more and more will use these factors in the future. We have shown in the past that knowing the education level of the population can help us make better projections. Having a more educated population has effects on many other socioeconomic measures. For example, more educated societies have higher level of productivity. Education level has also been used to calculate the speed of technological change. In societies where there are highly educated people the advancement in technological change comes faster than otherwise. And these factors are key to understanding humanity’s vulnerability to climate change, our ability to adapt, and our chances to solve the problem.

Schoolchildren in Indonesia: Population variables like education have big impacts on greenhouse gas emissions and vulnerability to climate change. © Asian Development Bank
A lot of your work focuses on what might happen in the future. How do you explain to people the difference between scenarios or projections and predictions? When we make projections about the future, we don’t use the word “prediction.” The chances that such a projection will be wrong are 100%. We can never say exactly what will happen in the future.
It’s important to understand how the narratives were defined, how we defined the scenarios. We cannot guarantee the future, the results, but we can guarantee the quality of what can be done, what we can say now, today about the future. And then there is the idea of uncertainty – we have said something about the future but we haven’t reported any kind of uncertainty there other than reporting ranges of scenarios. This is a big area for future work. It’s difficult to do, and it would be difficult to interpret, but it’s important to consider.
More information
References
KC S, Lutz W (2014). The human core of the shared socioeconomic pathways: Population scenarios by age, sex and level of education for all countries to 2100. Global Environmental Change http://pure.iiasa.ac.at/10759/
Riahi K, van Vuuren DP, Kriegler E, et al. (2016). The Shared Socioeconomic Pathways and their energy, land use, and greenhouse gas emissions implications: An overview. Global Environmental Change. http://pure.iiasa.ac.at/13280/
This article gives the views of the interviewee, and not the position of the Nexus blog, nor of the International Institute for Applied Systems Analysis.
Oct 18, 2016 | Demography
By Dimiter Philipov, IIASA World Population Program
Since the middle of the 19th century researchers have known that married men and women live longer than the unmarried: it is an inference as stable as a natural law. My colleague at IIASA, Sergey Scherbov and I supported its validity with a study in the 21st century, extending the pattern to encompass cohabiting. We also showed that people who have a partner are healthier than those without.
Across 16 European countries, partnered women aged 50 will outlive single women by 1.4 years on average before reaching age 80. For the men this difference is considerably larger: 4 years. Partnered people also have more years with healthy life (i.e., without disabilities) when compared to the singles: for women this gain is 5 years and for the men it is nearly 8 years. In general, partnership is more beneficial for the men.

© Pretoperola | Dreamstime
What makes living with a partner so important for a longer life and better health? An important advantage of living with a partner is that the partner can provide emotional, economic, social, and physical support in everyday life and in case of illness. This advantage is known as the protective effect of marriage. Over a period of 160 years causes of death have changed and the conditions of life and health have changed, yet the protective effect of marriage remains. In contemporary living arrangements cohabitation frequently replaces marriage but it has the same protective effect.
We expected single people to lack the protective effect of marriage, in other words, singles are expected to have poorer health. In addition, each one of the single sub-groups (i.e., never married, widowed, and divorced/separated) is subject to different reasons for poorer health than partnered people. For example, the never-married might have a disability that prevents them from finding a partner; widowed people are likely to lead the lifestyle of their late partner (diet, exercise, smoking, economic conditions, etc.) and are therefore more likely to suffer from the same disease that ended their partner’s life; divorces can be due to increased disability in either one of the partners.
We carried out international comparisons among the 16 European countries and found substantial diversity between countries in Western and in Eastern Europe. Populations in Eastern Europe have shorter lives, shorter healthy lives, and a longer time spent with disabilities compared to those in Western Europe. These differences are greater for single people than for partnered people; for example single men in Slovakia live only 7.4 years free of disabilities in the interval from 50 to 80 years, while in Sweden they enjoy nearly 20 years of healthy life.
The Nordic countries are leading with respect to length of healthy life and small differences between partnered and single people. The protective effect of marriage or cohabitation seems to be small in these countries. We believe this is due to the strong social policies that prevail in these countries.
What can we expect for the future? Statistical data indicate that the proportion of single people above age 50 and especially of single men increases with time. Hence the proportion of those who experience disabilities and ill-health will rise unless policies are put in place to help relieve these adverse effects.
Reference: Philipov D & Scherbov S (2016). Differences by union status in health and mortality at older ages: Results for 16 European countries. Demographic Research, 35: 535-556.
This article gives the views of the author, and not the position of the Nexus blog, nor of the International Institute for Applied Systems Analysis.
Oct 13, 2016 | Demography
By Anne Goujon, IIASA World Population Program
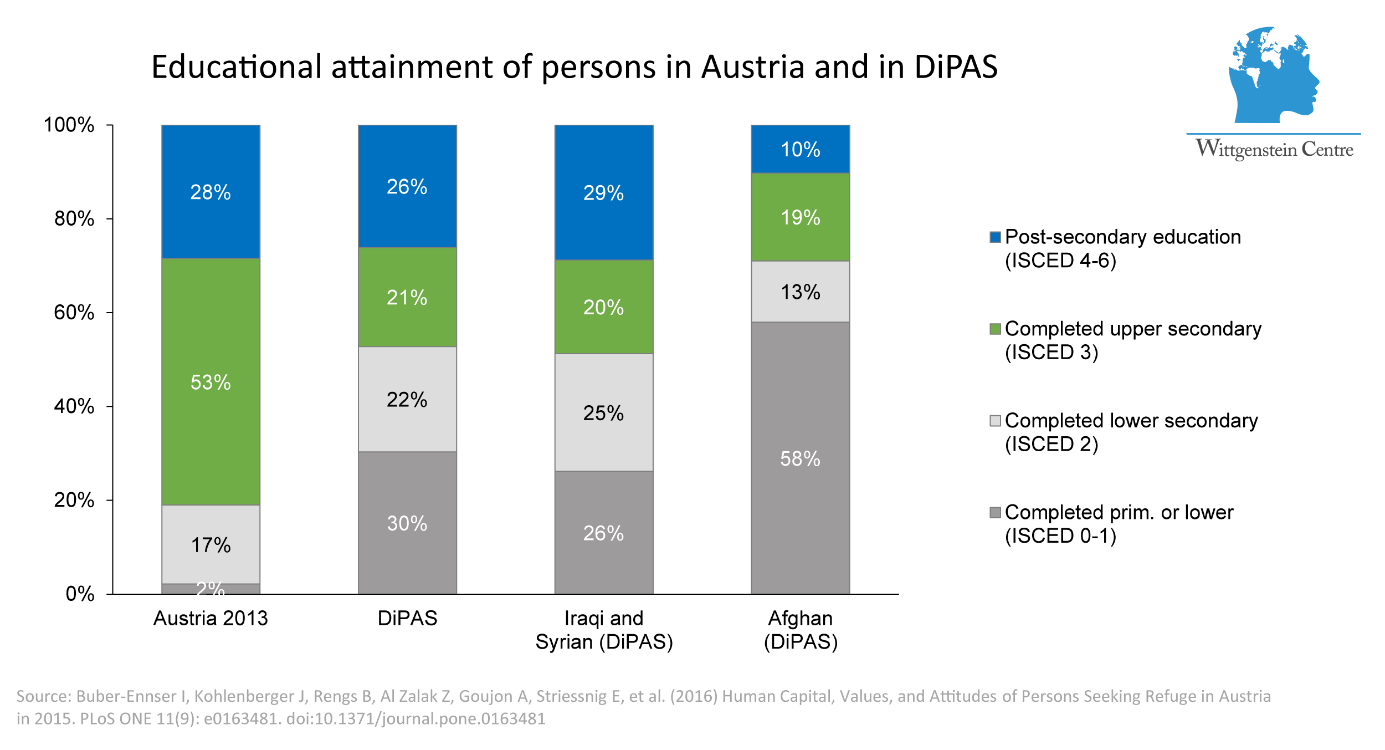
According to the Displaced Persons in Austria Survey (DIPAS) conducted by a team at the Vienna Institute of Demography and at IIASA, the large number of asylum seekers who came to Austria in the fall of 2015 appeared to possess levels of education that are higher than the average level in their country of origins. Moreover, the share of displaced persons from Syria and Iraq with a higher education is close to that of the Austrian population – around 30%.
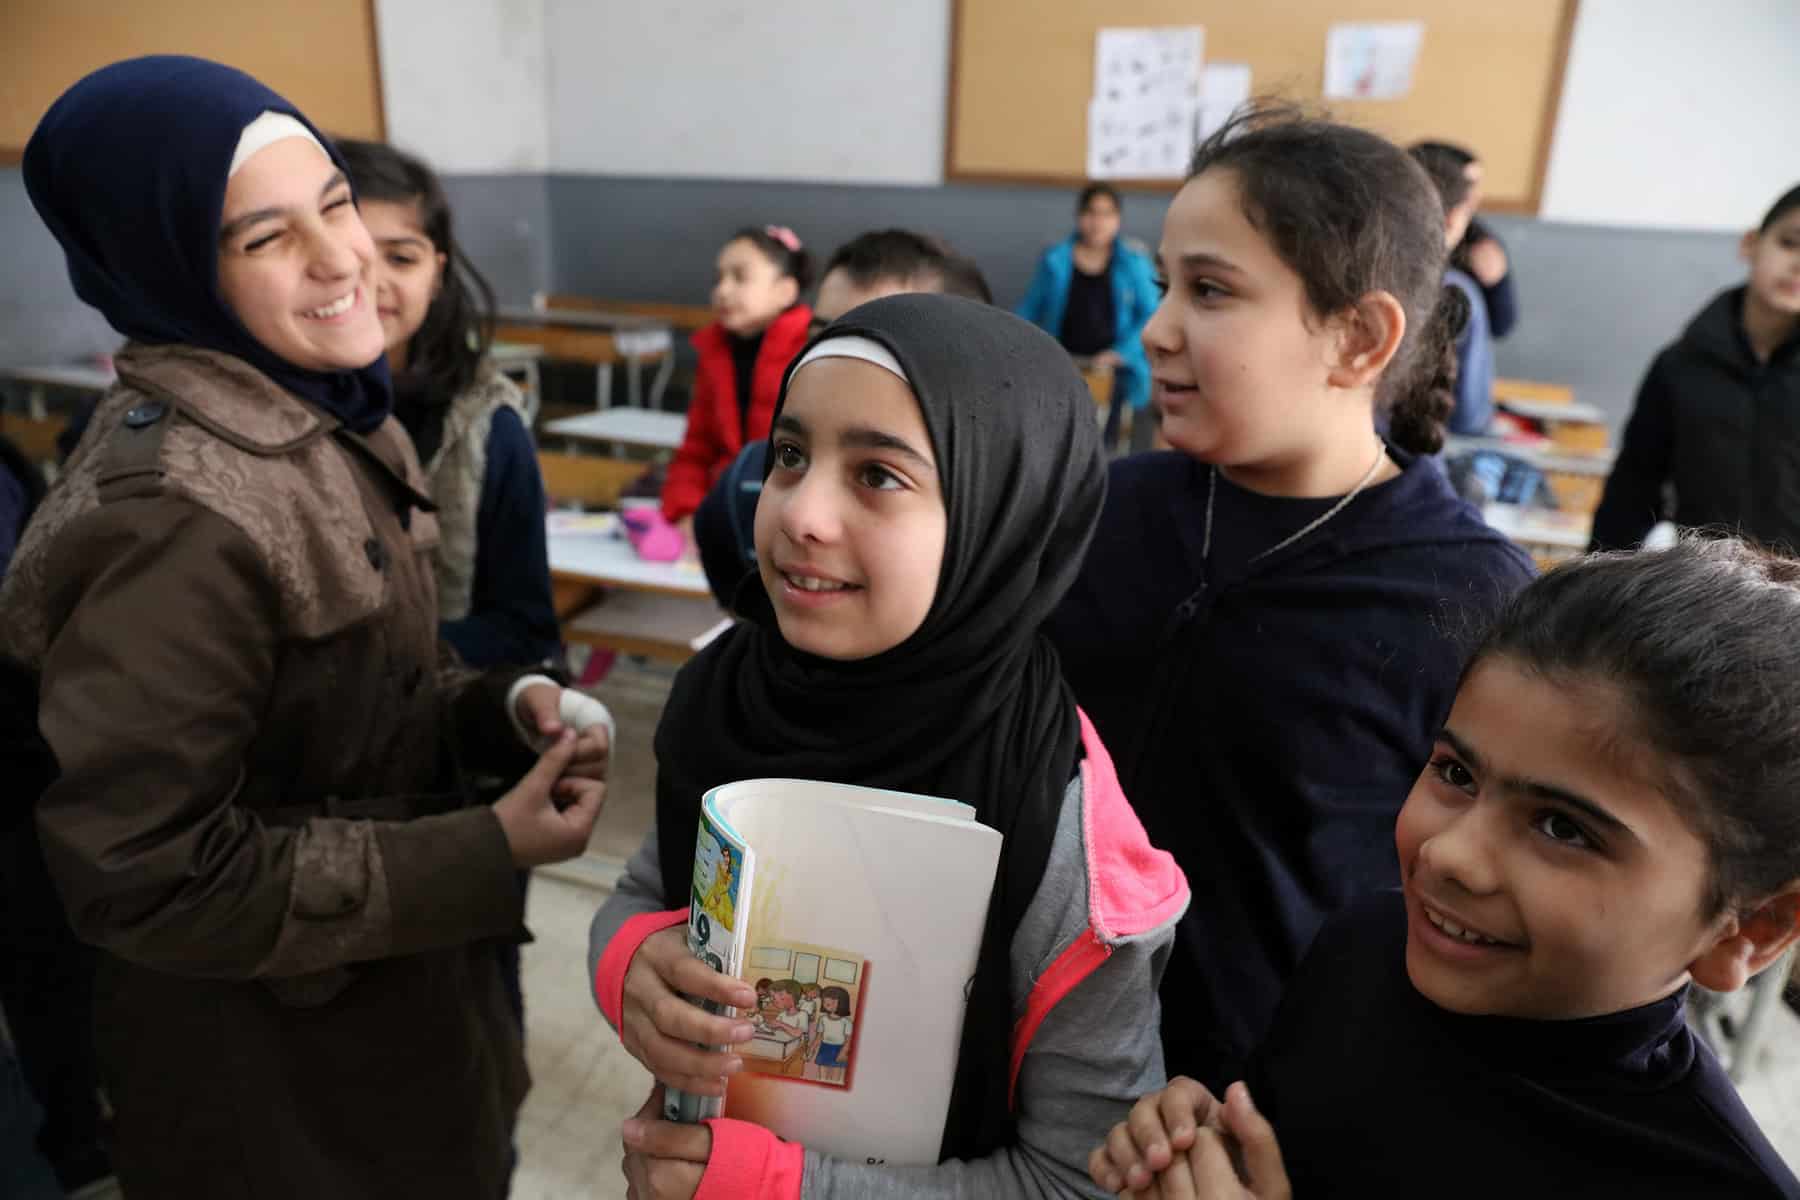
Students at school in Beirut, Lebanon. Two-thirds of the students at the school are Lebanese and one-third of the students are Syrian. Photo © Dominic Chavez | World Bank
This seemed surprising to many, judging from the number of critical and even aggressive comments that were posted online after the results of this study appeared in PLoS ONE in September and were covered by the press, mostly in Austria. Some of these comments even suggested that people were lying, and/or that the scientists were “do-gooders” covering up the truth.
However, there are several logical reasons for these findings, none of them having anything to do with deceit. The main reason why we know the study participants were not lying is that they had no incentive to lie. They were informed about the purpose of the survey and the fact that there was nothing at stake for them besides contributing to knowledge on the refugee population. Second, their levels of education matched very well with other information they gave, for instance their previous employment, so that if lying, they were uncannily consistent. Moreover, they were rarely alone when taking the questionnaire and it is difficult for a father or mother to lie for instance in front of their children. So we tend to believe the 514 displaced persons that answered the questionnaire. But these are not our only reasons:
Not everyone can afford the adventurous trip to Austria. We asked in the survey how much their journey to Austria–mostly through Turkey–cost, and 75% reported more than 2.000 US$ per person, and 30% more than $4.000. Such a sum is not easy to come by in countries where the average salary is low. The group of asylum seekers that fled to Austria was a selected group with a higher income, and consequently more likely to have had better access to education than those who could not afford to move further and were displaced within Syria or in the neighboring countries (Turkey, Lebanon, Jordan).
Furthermore, this is a young population. Most of them are below the age of 45 years, in fact, the mean age of the respondents was 31 years. Therefore they most likely benefited from the improvements in education that were prevalent in recent times before the war started.
What we cannot say is whether the level of education in their home countries is or was equivalent to the level of education in Austria. For example, we cannot say if an engineer in informatics from the Damascus University has the same knowledge and skills as an engineer trained at the Technical University in Vienna. However, studies implemented by the Public Employment Service in Austria show that refugees’ levels of competence and skills are largely in line with their levels of education and/or occupation. Furthermore, people who successfully pursued a higher education are more likely to be willing and interested to learn new things, such as learning a new language, developing additional skills, or retraining for other professions.
Therefore, the displaced persons that came to Austria at the end of 2015 have a high potential for contributing to the economy that should not be ignored.
Reference
Buber-Ennser, I., Kohlenberger, J., Rengs, B., Al Zalak, Z., Goujon, A., Striessnig, E., Potančoková, M., Gisser, R., Testa, M.R., Lutz, W. (2016) Human Capital, Values, and Attitudes of Persons Seeking Refuge in Austria in 2015. PLoS ONE 11(9): e0163481. doi:10.1371/journal.pone.0163481
This article gives the views of the author, and not the position of the Nexus blog, nor of the International Institute for Applied Systems Analysis.
Oct 10, 2016 | Alumni, Demography, Young Scientists
by Julia M. Puaschunder, alumna of the IIASA Young Scientist Summer Program 2016.
The world is on the move. Currently, more than 250 million people live outside their countries of birth. Of the moving masses, an estimated 6% are refugees fleeing across borders to more favorable environments. The ongoing European refugee crisis has increased the pressure to reap the benefits from migration while alleviating the burdens of societal movement.
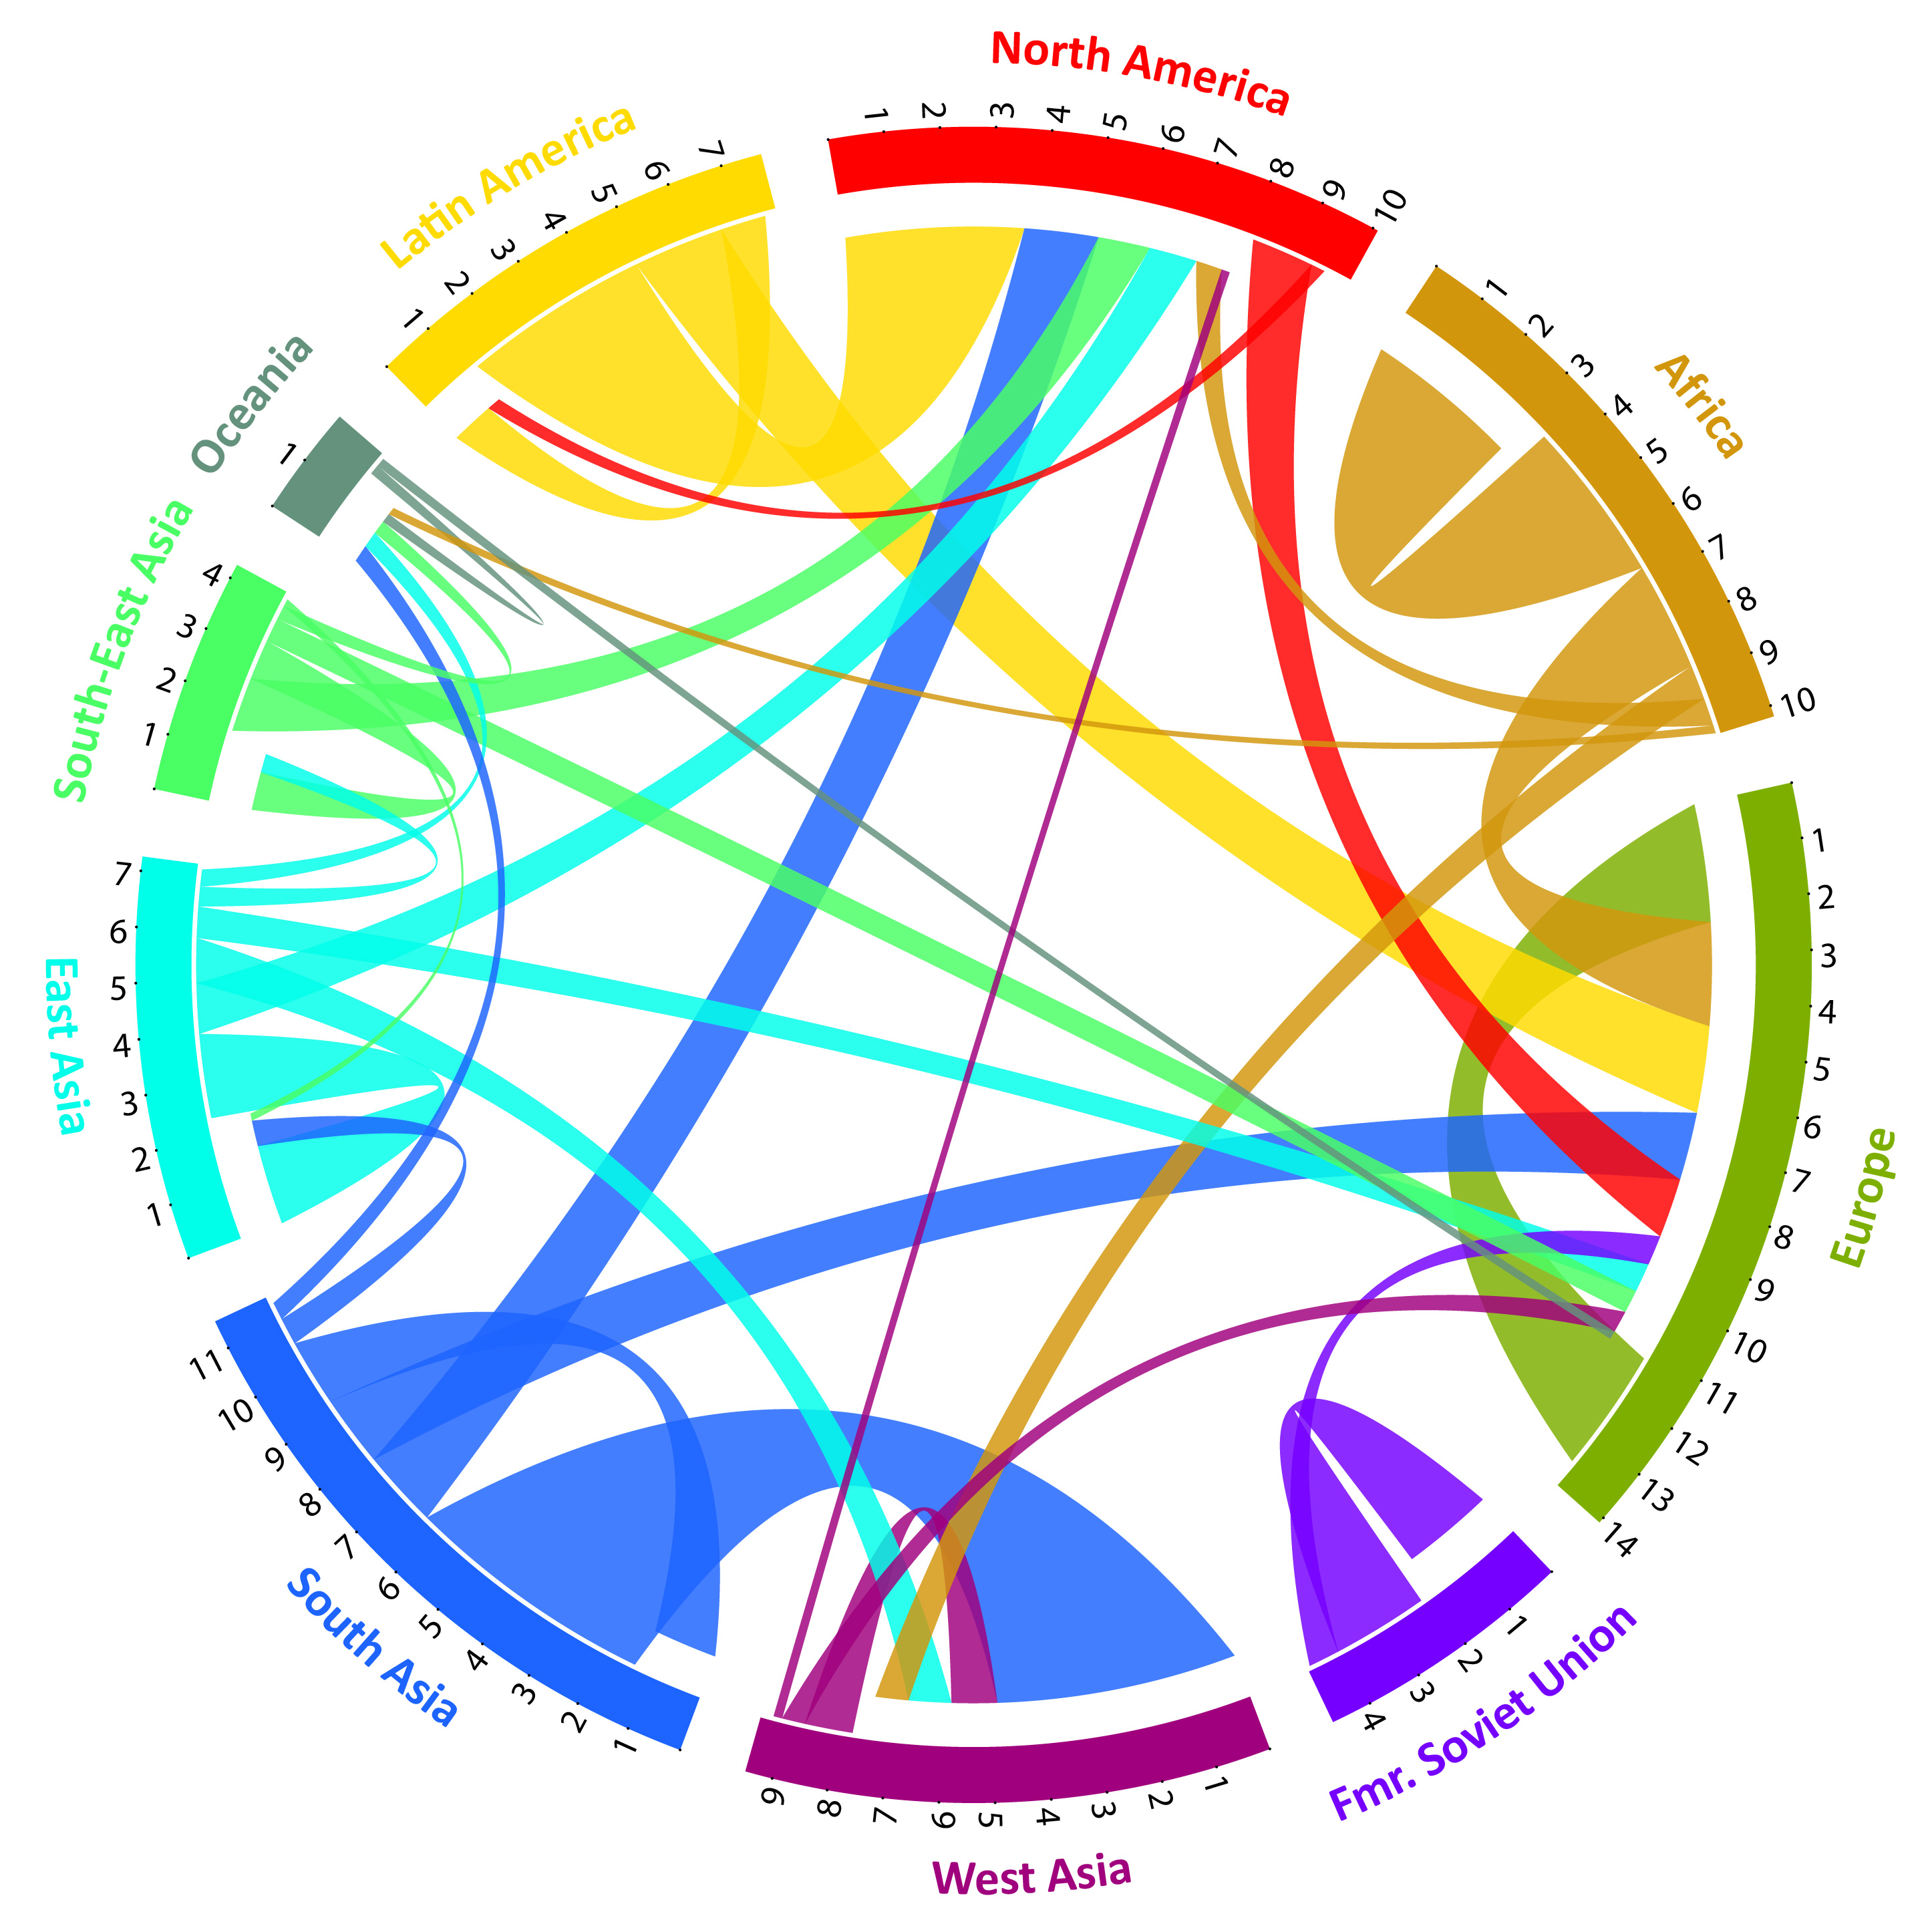
Estimates of directional flows between 123 countries between 2005-2010. Only flows containing at least 50,000 migrants are shown. “The Global Flow of People” (www.global-migration.info) is by Nikola Sander, Guy Abel & Ramon Bauer, and published in Science as “Quantifying global international migration flows” in 2014 (vol. 343: 1520-152).
Concerns were recently raised as to whether granting asylum to refugees—who often make up the most productive parts of their original populations—prevents (re)development in their fractionated home countries? An important consideration absent in these debates are the monetary gifts migrants send to their family members back home.
The World Bank estimates that migrants currently return around 450 billion US Dollars per year to the developing countries they came from, and this number is expected to rise. These monetary remittances have multiple positive impacts, including economic growth. As refugees are primarily younger to middle-aged, their remittances likely pay for their wives and children’s access to medical care and education, or support their parents when pension systems are missing.
Intergenerational monetary transfers are therefore the focus of my recent publication Gifts Without Borders. Contrary to conventional institutionalized sustainable development, remittances grounded in intergenerational care benefit from communication within families. Long-lasting family ties allow direct feedback. People truly care about their loved ones back home and families share their day-to-day experiences honestly. Intergenerational remittances beyond borders are thus a purer and potentially longer-enduring pathway to sustainable development, as these stable funding streams’ impact is more accountable than standard international aid.
Based on World Bank and OECD data covering almost all countries of the world, my forthcoming publication in the book ‘Intergenerational Responsibility in the 21st Century’ highlights that the intergenerational glue of a migrating population helps countries lacking socially responsible and future-oriented public sectors. Rather than blaming asylum-granting countries for removing the labor force from fragile territories, hosting refugees is portrayed as making use of human capital in stable economies, while refugees—at the same time—develop their former homelands by direct monetary contributions in a natural, transparent, and accountable way. In the age of migration, analyzing intergenerational networks and their financial flows is an important, but unexplored, facet of sustainable development. My findings open prospective research avenues on how we can align the economic outcomes of human capital mobility with sustainable development.
The IIASA Young Scientists Summer Program granted a vibrant setting to discuss my findings in a group of international, diverse, and multi-disciplinary future academic leaders during this summer, which was filled with beautiful moments in the historic Schloss Laxenburg in Austria. Recently IIASA also launched a Joint Research Centre of Expertise with the European Commission on Population and Migration, which aims to predict how migration will impact future economies and societies. In addition, the Advanced Systems Analysis (ASA) Program hosts the ‘Economic migration, capital flows, and welfare’ collaboration between ASA and the World Population Program to model dynamics of economic migration and investment. This research is also directly related to my New School Economic Review paper ‘Putty Capital and Clay Labor: Differing European Union Capital and Labor Freedom Speeds in Times of European Migration,’ which elucidates trade differences in capital and labor flows gravitating the benefits and burdens of globalization unequally and the potential problems arising for the European project from migration.

The Alpbach-Laxenburg Group Retreat 2016 on New Business Models for Sustainable Development. © Matthias Silveri | IIASA
Above all, attending the IIASA 2016 Alpbach-Laxenburg Group Retreat at the European Forum Alpbach helped to enhance my understanding of the relationship between migration and intergenerational responsibility. All these endeavors are targeted at contributing to sustainable development in a world on the move.
More information on the author of the post: www.juliampuaschunder.com
This article gives the views of the author, and not the position of the Nexus blog, nor of the International Institute for Applied Systems Analysis.
Sep 21, 2016 | Demography
By Raya Muttarak, IIASA World Population Program
Taking action on climate change is one top priority of the Sustainable Development Goals (SDGs), especially since its adverse impacts can undermine sustainable development. At the same time, reducing gender inequalities and empowering women and girls is fundamental in making progress across all the goals.
These two issues are also closely linked: in certain circumstances, women are more vulnerable to the effects of climate change than men, for example, due to weaker physical ability, lower socioeconomic status, and greater social, economic and political barriers in coping capacity.
This is why, in recent work, we have been exploring the differential impacts of climate change on subgroups of population such as by gender, age, education, and income. The rising number of households headed by women across the world and, in particular, in southern Africa calls for special attention to their economic welfare. In general female-headed households are more likely to be in poverty. Under the context of the changing climate, it is likely that weather extremes, rainfall variability, and natural disasters associated with climate change will exacerbate economic disadvantages of female-headed households.
Female-headed households are more economically vulnerable to climate-related shocks for three big reasons, which researchers call a “triple burden”. First, persistent gender disparities in the labor market and other productive activities, including limited access to formal credit markets and land contribute to greater economic disadvantage for female-headed households. Second, these households often have a higher total dependency ratio–that is, women take care of a higher proportion of dependent children and the elderly. Third, women who are heads of households with no other adult help have a “double day burden” where they have to fulfil both domestic duties and make money outside the home. That means that female heads face greater time and mobility constraints and may have to work fewer hours or choose lower-paying jobs.
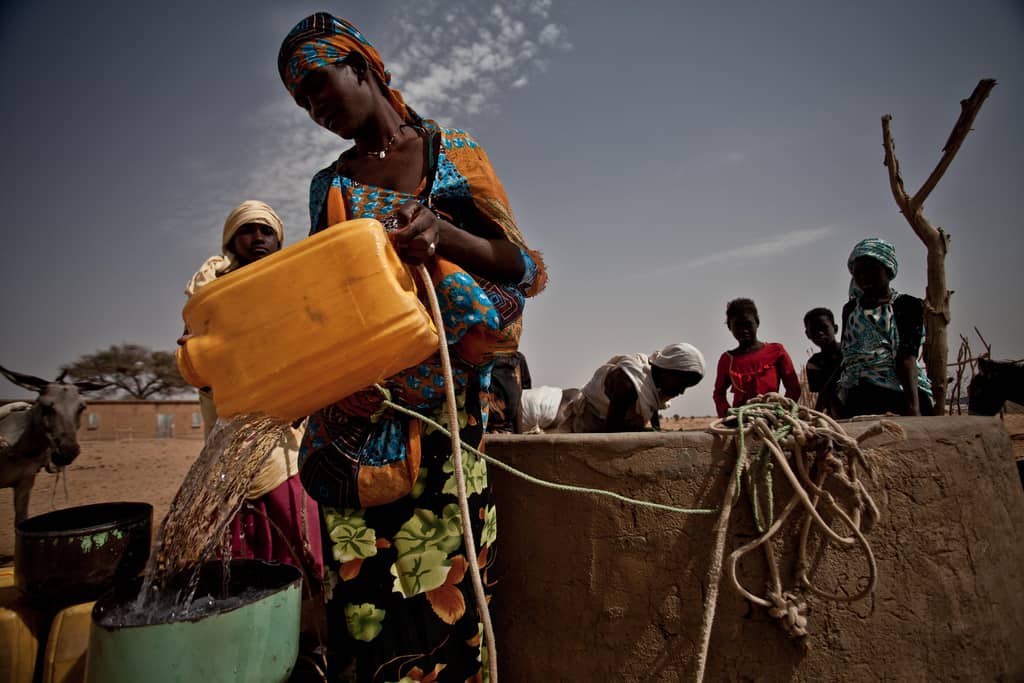
Female-headed households are more economically vulnerable to climate-related shocks for three big reasons, which researchers call a “triple burden”.
Photo: Pablo Tosco/Oxfam
Add climatic shocks to an already disadvantaged family, and the livelihood disruption can be a catastrophe. However, there have been very few studies of how female-headed households actually fare in the context of climate change. In our new study published in World Development, we used household survey data from South Africa and local rainfall data over the period 2006-2012 to examine how female-headed households fare economically when facing variation in rainfall. The study provides new empirical evidence on economic welfare of households headed by women following climatic shocks.
The new and unique part of our study is that we are able to control for observed and unobserved characteristics of households using a statistical technique called fixed effects estimation, which enables us to control for the household-specific effects on income. It also lets us account for different income trajectories in households with different demographic compositions. Furthermore, we were able to evaluate the impacts of income shock on economic vulnerability of female-headed households using rainfall variability as an exogenous source of risk. Income loss due to other variables such as death of a household member or losing a job are likely to be endogenously determined by household characteristics, that is, female heads have lower level of education and hence are more likely to fall into unemployment. But because rainfall variation is not connected to household factors, we were able to measure the causal effect of climate variability on incomes, comparing different household types.
Our study shows that female-headed households in South Africa are indeed more vulnerable to climate variability than households headed by two adults, and not just because of the greater economic disadvantages that they start with. Even after controlling for household socioeconomic characteristics, female heads still fare worse when facing economic shocks. This might be due to limited access to family support and protective social networks who can step in to help in time of crisis.
Our analysis also reveals that not all types of female-headed households are vulnerable to rainfall variability. This finding is especially important for designing a policy to reduce vulnerability of female-headed households. Given different routes into female headship, we show that never-married female heads, women with a non-resident spouse (for example, where the husband has moved to work in another region), and widows have greater economic vulnerability to climate variability. The group of female-headed households where the female head has never been married is the largest of these groups. Households with adults of both genders where the female works but the male does not work and households of separated or divorced women are no more vulnerable than male-headed households.
We also found that vulnerability to climate impacts is related to the effect of rainfall on agriculture. We find that female-headed households face greater economic vulnerability only in the districts where rainfall has a large effect on loss in agricultural yields. Regardless of household engagement in agriculture, crop losses in a district can affect food and livelihood security through surges in food prices and shortfalls in local demand.
Although our study focuses on South Africa, the results showing that female-headed households are more vulnerable to climate variability call for particular interventions to their vulnerability in the context of climate change. The number of female-headed households is rising, with an exceptionally high proportion in southern African countries (36.3% in Lesotho (2006), 43.9% in Namibia (2013), 47.9% in Swaziland (2007). As climate variation and extremes also increase, policies to reduce vulnerability to climate change need to explicitly consider the plight of this subgroup of population.
References
Flatø, M., Muttarak, R., & Pelser, A. (2016). Women, weather, and woes: The triangular dynamics of female-headed households, economic vulnerability, and climate variability in South Africa. World Development. doi:10.1016/j.worlddev.2016.08.015
Muttarak, R., Lutz, W., & Jiang, L. (2015). What can demographers contribute to the study of vulnerability? Vienna Yearbook of Population Research, 13, 1–13. doi:10.1553/populationyearbook2015s001
Rosenhouse, S. (1989). Identifying the poor : is “headship” a useful concept? (No. LSM58) (pp. 1–62). Washington, DC: The World Bank. http://documents.worldbank.org/curated/en/1989/07/442370/identifying-poor-headship-useful-concept. Accessed 24 February 2015
Note: This article gives the views of the author, and not the position of the Nexus blog, nor of the International Institute for Applied Systems Analysis.
Apr 27, 2016 | Demography
By Sergei Scherbov, IIASA World Population Program (This post was originally published on The Conversation)
The populations of most countries of the world are aging, prompting a deluge of news stories about slower economic growth, reduced labor force participation, looming pension crises, exploding health care costs and the reduced productivity and cognitive functioning of the elderly.
These stories are dire, in part because the most widely used measure of aging – the old-age dependency ratio, which measures the number of older dependents relative to working-age people – was developed a century ago and implies the consequences of aging will be much worse than they are likely to be. On top of that, this ratio is used in political and economic discussions of topics such as health care costs and the pension burden – things it was not designed to address.
Turning 65 in 2016 doesn’t mean the same thing as hitting 65 in 1916. So instead of relying on the old-age dependency ratio to figure out the impact of aging, we propose using a series of new measures that take changes in life expectancy, labor participation and health spending into account. When you take these new realities into account, the picture looks a lot brighter.

How facts from the census questionnaire were tabulated into statistics in 1950. © The U.S. National Archives/Flickr
Our tools to measure aging have aged
The most commonly used measure of population aging is the “old-age dependency ratio,” which is the ratio of the number of people 65 years or older to those 20 to 64.
But, since the old-age dependency ratio was introduced in the early 1900s, most countries have experienced a century of rising life expectancy, and further increases are anticipated.
For instance, in 1914, life expectancy at birth in Sweden was 58.2 years (average for both sexes). By 2014, it had risen to 82.2 years. In 1935, when the U.S Social Security Act was signed into law, 65-year-olds were expected to live 12.7 more years, on average. In 2013, 65 year-olds may expect to live 19.5 years more.
But these changes aren’t reflected in the conventional statistics on aging. Nor is the fact that many people don’t just stop working when they turn 65, and that people are staying healthier for longer.
To get a better sense of what population aging really means today, we decided to develop a new set of measures that take these new realities into account to replace the old-age dependency ratio. And instead of one ratio, we created several ratios to evaluate health care costs, labor force participation and pensions.
Who retires at 65 anymore?
One of these new realities is that the number of people working into their late 60’s and beyond is going up. In 1994, 26.8% of American men aged 65-69 participated in the labor force. That figure climbed to 36.1% in 2014 and is forecast to reach 40% by 2024. And the trend is similar for even older men, with 17% of those aged 75-79 expected to still be working in a decade, up from just 10% in 1994.
Clearly, these older people did not get the message that they were supposed to become old-age dependents when they turned 65.
This isn’t unique to the U.S. Rates like these in many countries have been rising. In the U.K., for instance, the labor force participation rate of 65- to 69-year-old men was 24.2% in 2014, and in Israel it was 50.2%, up from 14.8% and 27.4%, respectively, in 2000. In part this is because older people now often have better cognitive functioning than their counterparts who were born a decade earlier.
So, instead of assuming that people work only from ages 20 to 64 and become old-age dependents when they hit 65, we have computed “economic dependency ratios” that take into account observations and forecasts of labor force participation rates. This tells us how many adults not in the labor force there are for every adult in the labor force, giving us a more accurate picture than using 65 as a cutoff point. We used forecasts produced by the International Labor Organization to figure this out.
The old-age dependency ratio in the U.S. is forecast to increase by 61% from 2013 to 2030. But using our economic dependency ratio, the ratio of adults in the labor force to adults not in the labor force increases by just 3% over that period.
Clearly, doom and gloom stories about U.S. workers having to support so many more non-workers in the future may need to be reconsidered.
Is the health care burden going to be so high?
Another reality is that while health care costs will go up with an older population, they won’t rise as much as traditional forecasts estimate.
Instead of assuming that health care costs rise dramatically on people’s 65th birthdays, as the old-age dependency ratio implicitly does, we have produced an indicator that takes into account the fact that most of the health care costs of the elderly are incurred in their last few years of life. Increasing life expectancy means those final few years happen at ever later ages.
In Japan, for example, when the burden of the health care costs of people aged 65 and up on those 20-64 years old is assessed using only the conventional old-age dependency ratio, that burden is forecast to increase 32% from 2013 to 2030. When we compute health care costs based on whether people are in the last few years of their lives, the burden increases only 14%.
Pension ages are going up
The last reality we considered concerns pensions.
In most OECD countries, the age at which someone can begin collecting a full public pension is rising. In a number of countries, such as Sweden, Norway and Italy, pension payouts are now explicitly linked to life expectancy.
In Germany, the full pension age will rise from 65 to 67 in 2029. In the U.S., it used to be 65, is now 66 and will soon rise to 67.
Instead of assuming that everyone receives a full public pension at age 65, which is what the old-age dependency ratio implicitly does, we have computed a more realistic ratio, called the pension cost dependency ratio, that incorporates a general relationship between increases in life expectancy and the pension age. The pension cost dependency ratio shows how fast the burden of paying public pensions is likely to grow.
For instance, in Germany, the old-age dependency ratio is forecast to rise by 49% from 2013 to 2030, but 65-year-old Germans will not be eligible for a full pension in 2030. Our pension cost dependency ratio increases by 26% over the same period. Instead of indicating that younger Germans will have to pay 49% more to support pensioners in 2030 compared to what they paid in 2013, taking planned increases in the full pension age into account, we see that the increase is 26%.

Pranom Chartyothin, a 72-year-old bus conductor, sells and collects bus tickets in downtown Bangkok, Thailand. Photo Credit: Jorge Silva/Reuters, CC BY
Sixty-five just isn’t that old anymore
In addition to this suite of measures focused on particular aspects of population aging, it is also useful to have a general measure of population aging. We call our general measure of population aging the prospective old-age dependency ratio.
People do not suddenly become old-age dependents on their 65th birthdays. From a population perspective, it makes more sense to classify people as being old when they are getting near the end of their lives. Failing to adjust who is categorized as old based on the changing characteristics of people and their longevity can make aging seem faster than it will be.
In our prospective old-age dependency ratio, we define people as old when they are in age groups where the remaining life expectancy is 15 years or less. As life expectancy increases, this threshold of old age increases.
In the U.K., for instance, the conventional old-age dependency ratio is forecast to increase by 33% by 2030. But when we allow the old-age threshold to change with increasing life expectancy, the resulting ratio increases by just 13 percent.
Populations are aging in many countries, but the conventional old-age dependency ratio makes the impact seem worse than it will be. Fortunately, better measures that do not exaggerate the effects of aging are now just a click away.
Note: This article gives the views of the author, and not the position of the Nexus blog, nor of the International Institute for Applied Systems Analysis.
You must be logged in to post a comment.