By Santosh Karanam, .NET Full Stack Developer in the IIASA Ecosystems Services and Management Program
Santosh Karanam describes his efforts to visualize people’s reactions to the easing of COVID-19 restrictions in real time as they are expressed on Twitter.

© Ezthaiphoto | Dreamstime.com
Who would have imagined at the beginning of 2020, when the United Nations Department of Economic and Social Affairs was still projecting global economic growth at 2.5%, that within a few months the same department would have to release a new briefing stating that the global economy is now projected to shrink by 0.9% in 2020 due to a pandemic. This is mainly due to sudden restrictions and disruptions in global supply chains and international trade. COVID-19 is already having a lasting impact on the global economy; nearly 100 countries have closed their national borders during the past month, and the movement of people and tourism flows have come to a screeching halt.
In some countries, the COVID-19 pandemic has peaked in terms of the number of new infections, however, many countries are yet to reach the peak. Countries that seem to have crossed the peak are looking for ways to lift restrictions gradually, while keeping an eye on infection rates to avoid a second wave of infections. These actions by governments are being watched closely by people around the globe and trigger various kinds of emotional reactions.
Visualizing Twitter reactions in real time
I was curious about the possibility of visualizing these reactions, or sentiments, on a real-time basis as we crawl through these unprecedented times of the COVID-19 pandemic. It led me to create a real-time dashboard to visualize sentiments about the lifting of pandemic restrictions expressed or evident on the social media platform Twitter.
Twitter has application program interfaces (APIs) that enable developers to pull data from Twitter in a machine-readable format. This data is the same as the data shown when you open your Twitter account in either a browser or a mobile application and search for specific words. I decided to utilize this data using search key words like “lifting lockdown” and ”lifting restriction” and assign sentiment scores to tweets relating to these keywords using sentiment140.
Sentiment140 is a program created by computer science graduates from Stanford University that allows you to discover the sentiment of a brand, product, or topic on Twitter. It automatically classifies the sentiment of Twitter messages by using classifiers built using machine learning algorithms, and provides transparency for the classification results of individual tweets. Twitter uses complex algorithms to get the results for key words. These tweets are pulled continuously in real time and sent to sentiment140 APIs where they are assigned sentiment scores: 0 for negative, 2 for neutral and 4 for positive.
Below is an example of this scoring:
|
Tweet |
Scores | Sentiment |
| Why are people so eager to end lockdown and lift restrictions… for a second wave and then moan again… the mind boggles!! | 0 | Negative |
| Iran begins lifting restrictions after brief coronavirus lockdown | 2 | Neutral |
| Germany has now begun to lift restrictions to visit one another and open businesses soon because we actually listened and stayed at home. Germany has now been marked the 2nd Safest country during the pandemic | 4 | Positive |
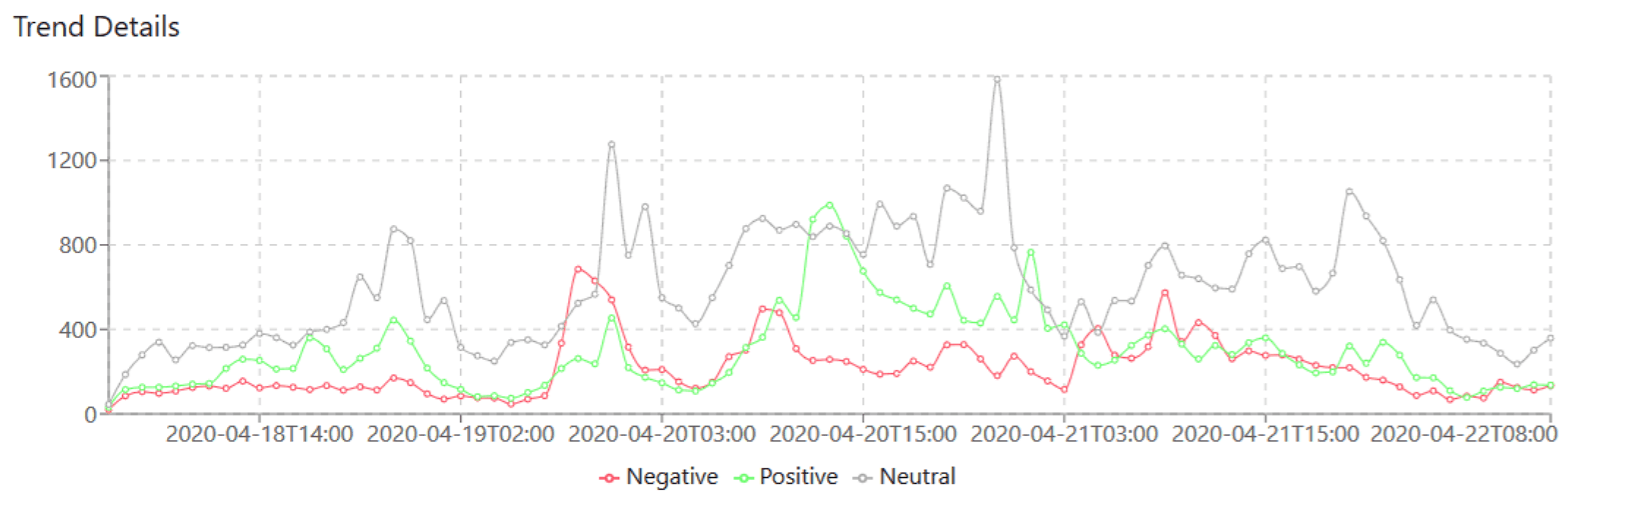
From April 12th 2020 to April 21st 2020, a total of 208,220 tweets were scored and analyzed, this total number of tweets is growing daily as new tweets come in. The tweets are analyzed (sentiment scored) in real time and aggregated hourly. The above examples are taken from the analyzed tweets. For simplicity and to have a wholistic view of all relevant tweets, replies to tweets and re-tweets are all scored as people may react days after the initial tweet. For this experiment, only English language tweets are considered.
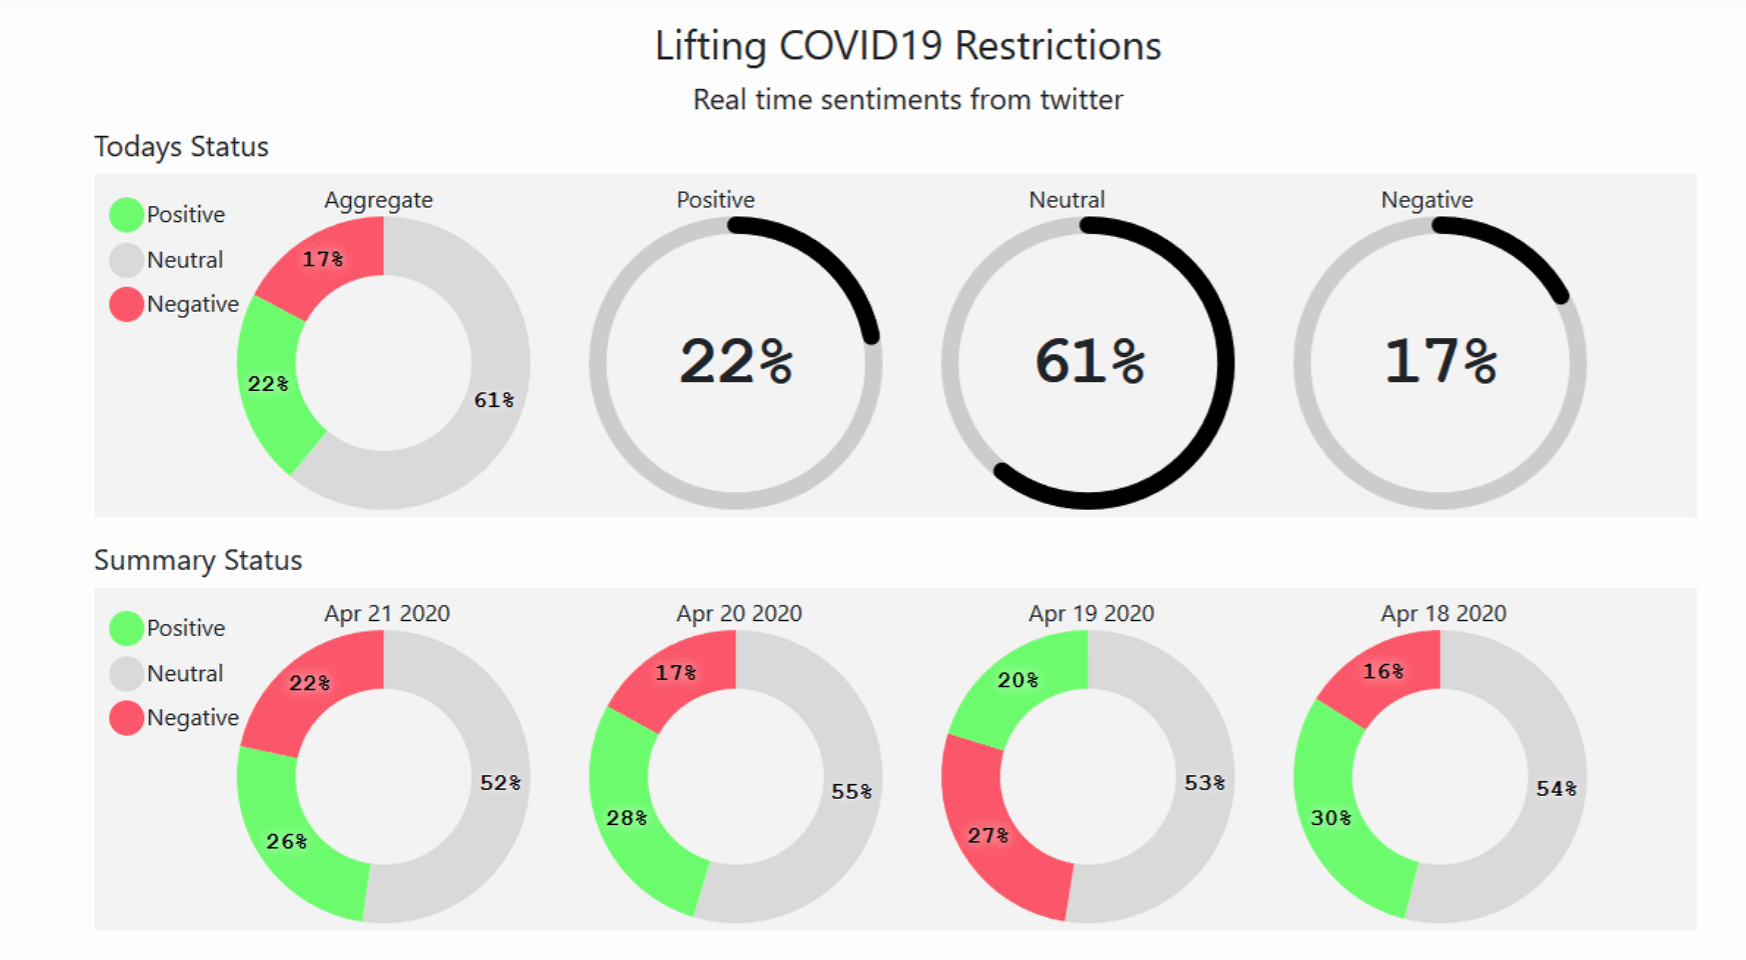
The scores assigned are aggregated every hour, stored in cloud storage, and are shown in the website dashboard. The dashboard shows the status of the current day’s scores and is updated every hour, it also shows the previous four days’ sentiment score results.
Visit the website and see the dashboard.
Trends so far:
I can see a trend where most of the tweets fall under neutral scores as we are in the early days of restrictions being lifted. Many people are concerned about whether the measures will work. As the days progress I expect the neutral scores to reduce and convert into either positive or negative scores. This all depends on how infection rates either rise or fall in the days to come. Ideally, if everything turns out as planned, the positive sentiments will grow, and negative and neutral sentiments will shrink.
The scored tweets are not country specific but are captured globally, the reason being that less than 1-2% of Tweets are geo-tagged and for a real time experiment, I thought it would be too little data per hour. Since very few countries have crossed the peak of the curve, the current results show that the neutral and negative scores form the major share as we progress and hopefully, if infection rates do not increase drastically with the ease of lockdown restrictions, we might see positive sentiment scores taking the major share.
Additional info:
This is a sample experiment that I am running in the Microsoft Azure cloud using Azure Event Hubs and Azure Stream Analytics for real-time processing of Twitter data. I am storing the aggregated score results in Azure Blob Stores – you can read more about the setup here. The aggregated results are shown using a simple react java script application, which is again hosted in Microsoft Azure cloud. Do contact me for further details.
References
- https://www.un.org/sustainabledevelopment/blog/2020/04/covid-19-likely-to-shrink-global-gdp-by-almost-one-per-cent-in-2020/
- https://news.un.org/en/story/2020/04/1061782
- http://help.sentiment140.com/home
- https://developer.twitter.com/en
- https://docs.microsoft.com/en-us/azure/stream-analytics/stream-analytics-twitter-sentiment-analysis-trends
Note: This article gives the views of the author, and not the position of the Nexus blog, nor of the International Institute for Applied Systems Analysis
You must be logged in to post a comment.