May 29, 2017 | Citizen Science, Risk and resilience
By Wei Liu, IIASA Risk and Resilience Program
What do Rajapur, Nepal; Chosica, Peru; and Tabasco, Mexico all have in common? Flooding: these areas are all threatened by floods, and they also face similar knowledge gaps, especially in terms of local level spatial information on risk, and the resources and the capacities of communities to manage risk.
To address these gaps, I and my colleagues at IIASA, in collaboration with Kathmandu Living Labs (KLL) and Practical Action (PA) Nepal are building on our experiences in Nepal’s Lower Karnali River basin to support flood risk mapping in flood-prone areas in Peru and Mexico.
Recent developments in data collection and communication via personal devices and social media have greatly enhanced citizens’ abilities to contribute spatial data, called Crowdsourced Geographic Information (CGI) in the mapping community. OpenStreetMap is the most widely used platform for sharing this free geographic data globally, and the fast growing Humanitarian OpenStreetMap Team has developed CGI in some of the world’s most disaster-prone and data-scarce regions. For example, after the 2015 Nepal Earthquake, thousands of global volunteers mapped infrastructure across Nepal, greatly supporting earthquake rescue, recovery, and reconstruction efforts.
Today there is excellent potential to engage citizen mappers in all stages of the disaster risk management cycle, including risk prevention and reduction, preparedness and reconstruction. In this project, we have successfully launched a series of such mapping activities for the Lower Karnali River basin in Nepal starting in early 2016. In an effort to share the experience and lessons of this work with other Zurich Global Flood Resilience Alliance field sites, in March 2017 we initiated two new mapathons in Kathmandu, with support from Soluciones Prácticas (PA Peru) and the Mexican Red Cross, to remotely map basic infrastructure such as buildings and roads, as well as visible water surface, around flood-prone communities in Chosica, Peru and Tobasco, Mexico.
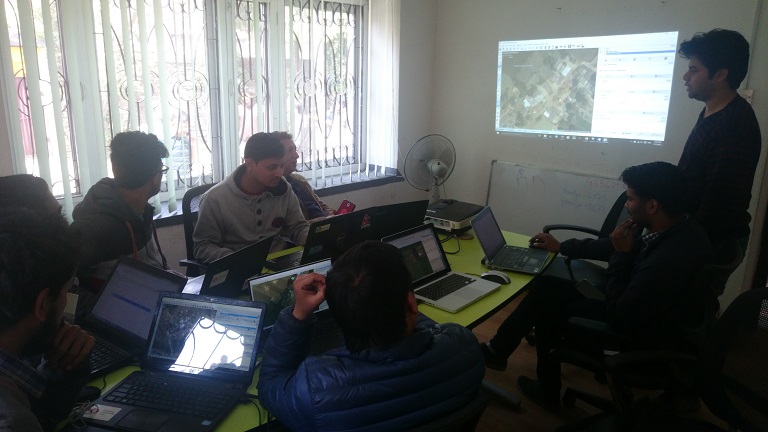
March 17th, 2017, staff and volunteers conducting remote mapping at Kathmandu Living Labs @ Wei Liu | IIASA
Prior to our efforts very few buildings in these areas were identified on online map portals, including Google Maps, Bing Maps, and OSM. Through our mapathons, dozens of Nepalese volunteers mapped over 15,000 buildings and 100 km of roads. The top scorer, Bishal Bhandari, mapped over 1,700 buildings and 6 km of roads for Chosica alone.
Having the basic infrastructure mapped before a flood event can be extremely valuable for increasing flood preparedness of communities and for local authorities and NGOs. During the period of the mapathons, the Lima region in Peru, including Chosica, was hit by a severe flood induced by coastal El Niño conditions. Having almost all buildings in Chosica mapped on the OSM platform now makes visible the high flood risk faced by people living in this densely populated area with both formal and informal settlements. These data may support conducting a quick damage assessment, as suggested by Miguel Arestegui, a collaborator from PA Peru during his visit to IIASA in April, 2017.
Recognizing the value of crowdsourced spatial risk information, we are working closely with partners, including OpenStreetMap Peru, to mobilize the creativity, technical know-how, and practical experience from the Nepal study to Latin America countries. Collecting such information using CGI comes with low cost but high potential for modeling and estimating the amount of people and economic assets potentially being affected under different future flood situations, for improving development and land-use plans to support disaster risk reduction, and for increasing preparedness and helping with allocating humanitarian support in a timely manner after disaster events.
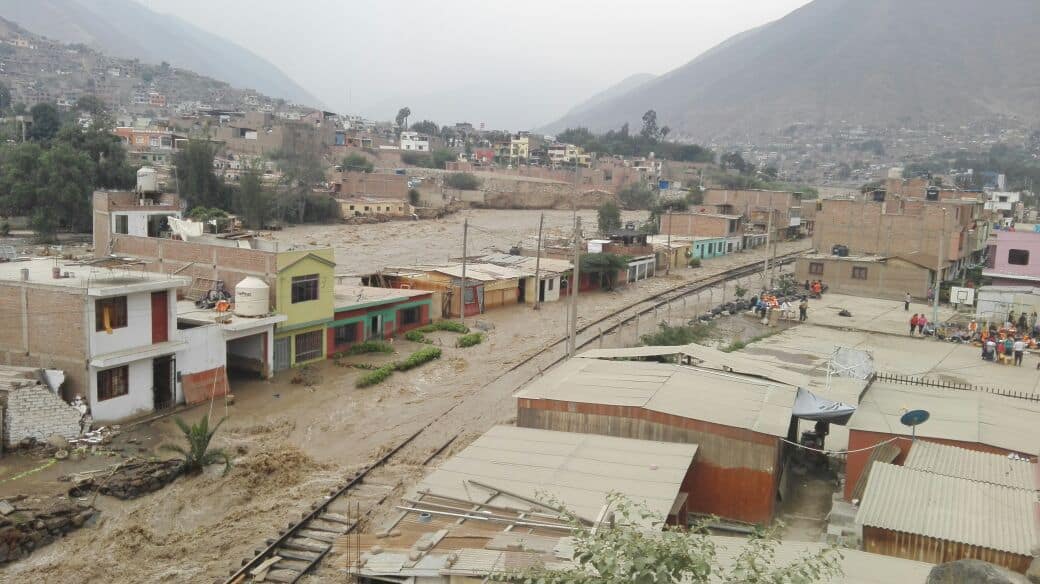
Flood-inundated houses and local railway in Chosica, Peru, 18/03/2017 @ Miluska Ordoñez | Soluciones Prácticas
The United Nation’s Sendai Framework for Disaster Risk Reduction states that knowledge in “all dimensions of vulnerability, capacity, exposure of persons and assets, hazard characteristics and the environment” needs to be leveraged to inform policies and practices across all stages of the disaster risk management cycle. CGI has a great potential to involve citizens from around the world to help fill this critical knowledge gap. These pilot mapathons conducted between Nepal and Latin America are promising examples of supporting community flood resilience through the mobilization of CGI via international partnerships within the Global South.
This article gives the views of the author, and not the position of the Nexus blog, nor of the International Institute for Applied Systems Analysis.
Jan 12, 2017 | Citizen Science, Risk and resilience
By Ian McCallum, IIASA Ecosystems Services and Management Program
Communities need information to prepare for and respond to floods – to inform risk reduction strategies and strengthen resilience, improve land use planning, and generally prepare for when disaster strikes. But across much of the developing world, data are sparse at best for understanding the dynamics of flood risk. When and if disaster strikes, massive efforts are required in the response phase to develop or update information about basic infrastructure, for example, roads, bridges and buildings. In terms of strengthening community resilience it is important to know about the existence and location of such features as community shelters, medical clinics, drinking water, and more.
The risk Geo-Wiki platform
The Risk Geo-Wiki is online platform established in 2014, which acts not only as a repository of available flood related spatial information, but also provides for two-way information exchange. You can use the platform to view available information about flood risk at any location on the globe, along with geo-tagged photos uploaded by yourself or other users via a mobile application Geo-Wiki Pictures. The portal is intended to be of practical use to community leaders and NGOs, governments, academia, industry and citizens who are interested in better understanding the information available to strengthen flood resilience.
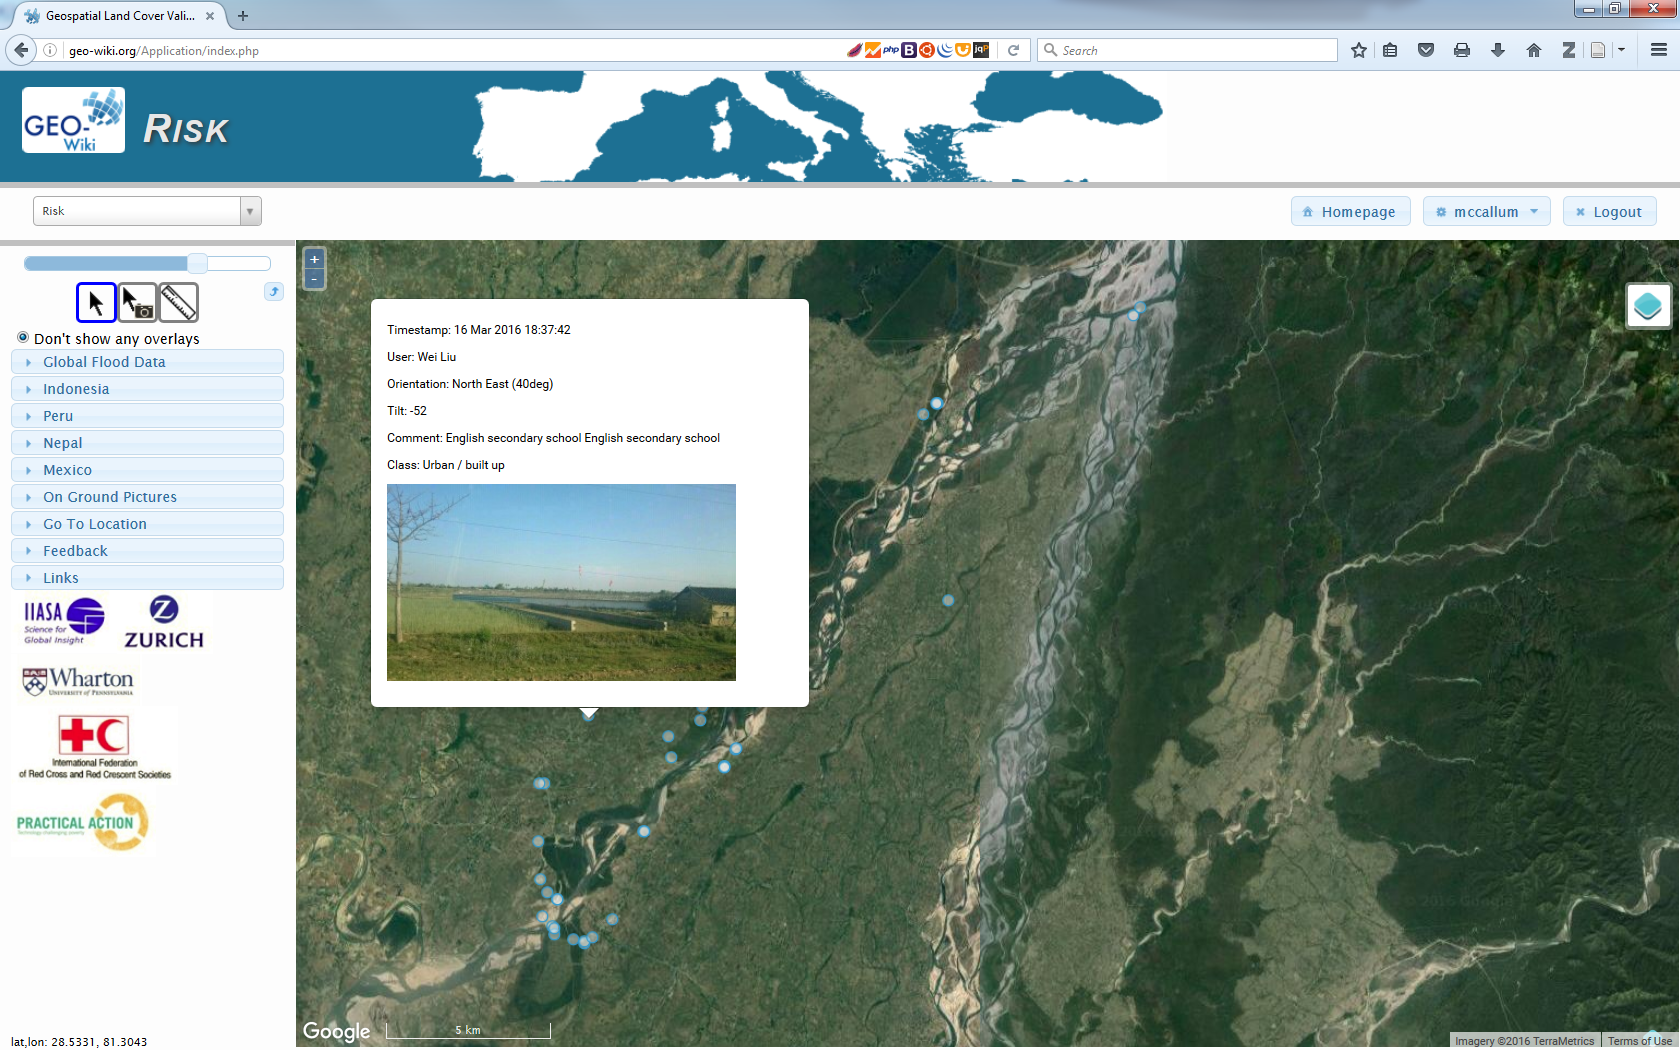
The Risk Geo-Wiki showing geo-tagged photographs overlaid upon satellite imagery across the Karnali basin, Nepal. © IIASA
With only a web browser, and a simple registration, anyone can access flood-related spatial information worldwide. Available data range from flood hazard, exposure and risk information, to biophysical and socioeconomic data. All of this information can be overlaid upon satellite imagery or OpenStreetMap, along with on-ground pictures taken with the related mobile application Geo-Wiki Pictures. You can use these data to understand the quality of available global products or to visualize the numerous local datasets provided for specific flood affected communities. People interested in flood resilience will benefit from visiting the platform and are welcome to provide additional information to fill many of the existing gaps in information.
Flood resilience and data gaps
One of the aims of the Risk Geo-Wiki is to identify and address data gaps on flood resilience and community-based disaster risk reduction. For example, there is a big disconnect between information suitable for global flood risk modelling and that necessary for community planning. Global modelers need local information with which to validate their forecasts while community planners want both detailed local information and an understanding of their communities in the wider region. The Flood Resilience Alliance is working with many interested groups to help fill this gap and at the same time help strengthen community resilience against floods and to develop and disseminate knowledge and expertise on flood resilience.
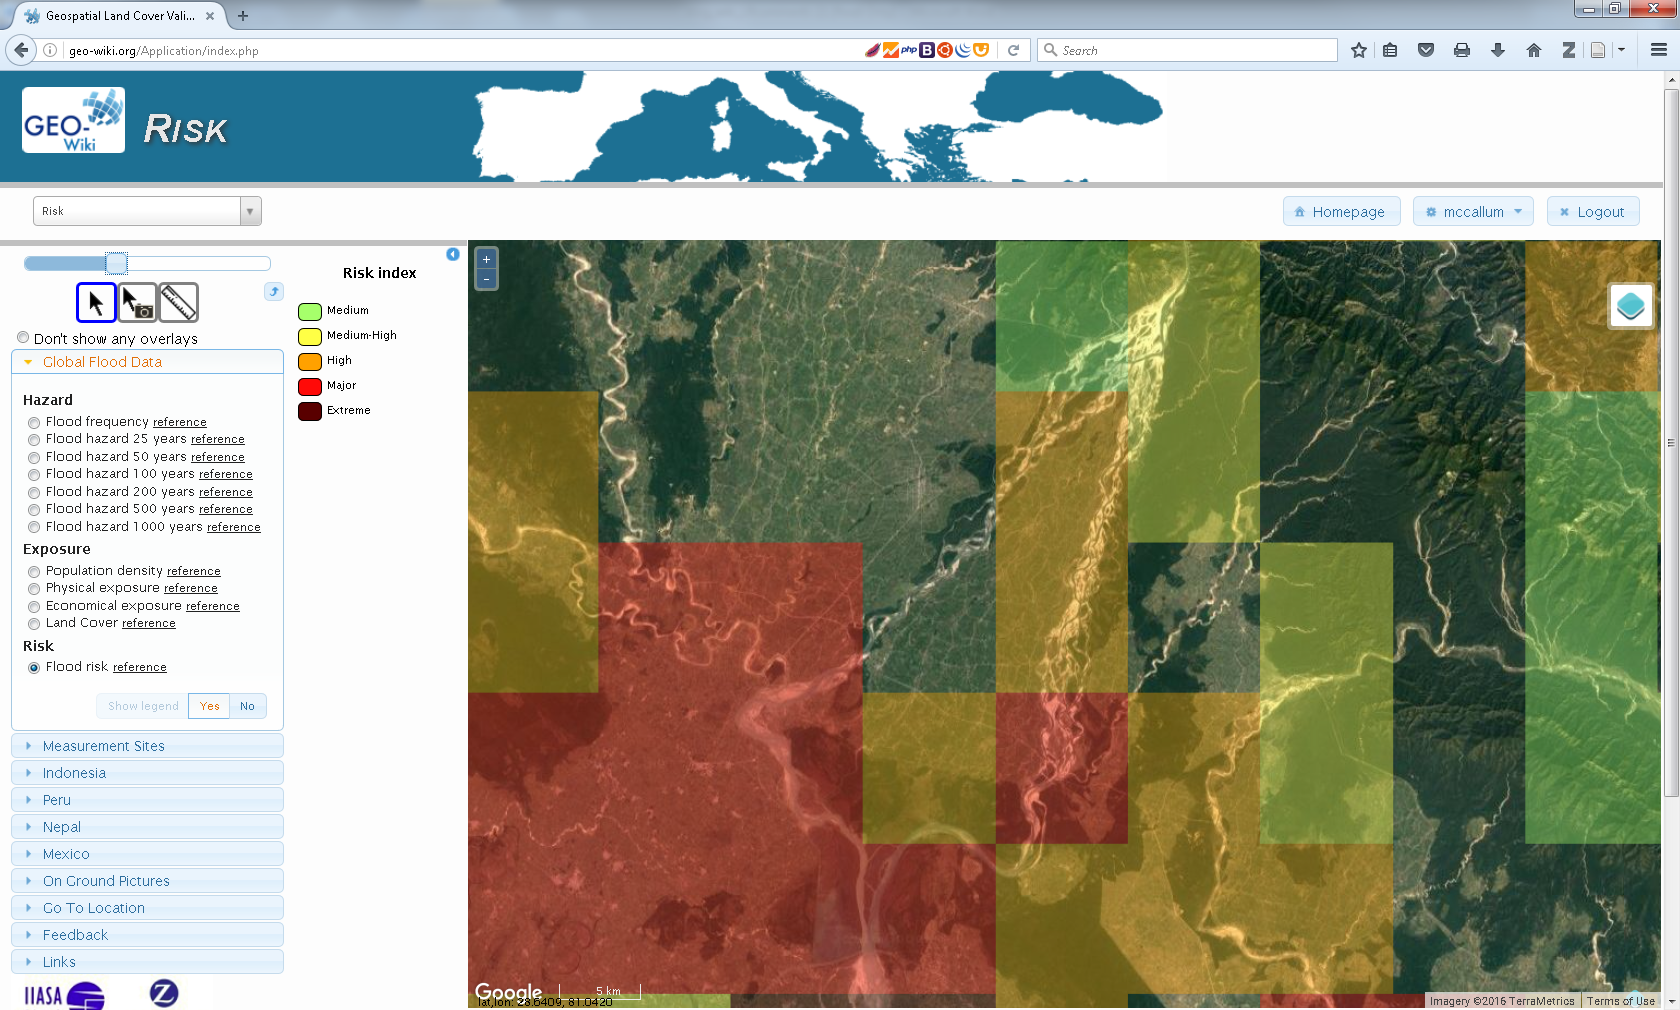
The Risk Geo-Wiki showing modelled global flood risk data overlaid at community level. While this data is suitable at the national and regional level, it is too coarse for informing community level decisions. © IIASA
Practical applications for local communities
Already, communities in Nepal, Peru, and Mexico have uploaded data to the site and are working with us on developing it further. For local communities who have uploaded spatial information to the site, it allows them to visualize their information overlaid upon satellite imagery or OpenStreetMap. Furthermore, if they have used Geo-Wiki Pictures to document efforts in their communities, these geo-tagged photos will also be available.
Community and NGO members mapping into OSM with mobile devices in the Karnali basin, Nepal. © Wei Liu, IIASA
In addition to local communities who have uploaded information, the Risk Geo-Wiki will provide important data to others interested in flood risk, including researchers, the insurance industry, NGOs, and donors. The portal provides a source of information that is both easily visualized and overlaid on satellite imagery with local images taken on the ground if available. Such a platform allows anyone interested to better understand flood events over their regions and communities of interest. It is, however, highly dependent upon the information that is made available to the platform, so we invite you to contribute. In particular if you have geographic information related to flood exposure, hazard, risk and vulnerability in the form of images or spatial data we would appreciate you getting in contact with us.
About the portal:
The Risk Geo-Wiki portal was established by the International Institute for Applied Systems Analysis (IIASA) in the context of the Flood Resilience Alliance. It was developed by the Earth Observation Systems Group within the Ecosystems Services and Management Program at IIASA.
Further information
- Risk Geo-Wiki
- Collection of geo-tagged photos with Geo-Wiki Pictures
- Mapping flood resilience in rural Nepal
- Flood Resilience Portal
- McCallum, I., Liu, W., See, L., Mechler, R., Keating, A., Hochrainer-Stigler, S., Mochizuki, J., Fritz, S., Dugar, S., Arestegui, M., Szoenyi, M., Laso Bayas, J.C., Burek, P., French, A. and Moorthy, I. (2016) Technologies to Support Community Flood Disaster Risk Reduction. International Journal of Disaster Risk Science, 7 (2). pp. 198-204.http://pure.iiasa.ac.at/13299/
This article gives the views of the author, and not the position of the Nexus blog, nor of the International Institute for Applied Systems Analysis.
Nov 10, 2016 | Risk and resilience
By Wei Liu, IIASA Risk and Resilience and Ecosystems Services and Management programs
Disasters caused by extreme weather events are on the rise. Floods in particular are increasing in frequency and severity, with reoccurring events trapping people in a vicious cycle of poverty. Information is key for communities to prepare for and respond to floods – to inform risk reduction strategies, improve land use planning, and prepare for when disaster strikes.
But, across much of the developing world, data is sparse at best for understanding the dynamics of flood risk. When and if disaster strikes, massive efforts are required in the response phase to develop or update information. After that, communities have an even greater need for data to help with recovery and reconstruction and further enhance communities’ resilience to future floods. This is particularly important for the Global South, such as the Karnali Basin in Nepal, where little information is available regarding community’s exposure and vulnerability to floods.
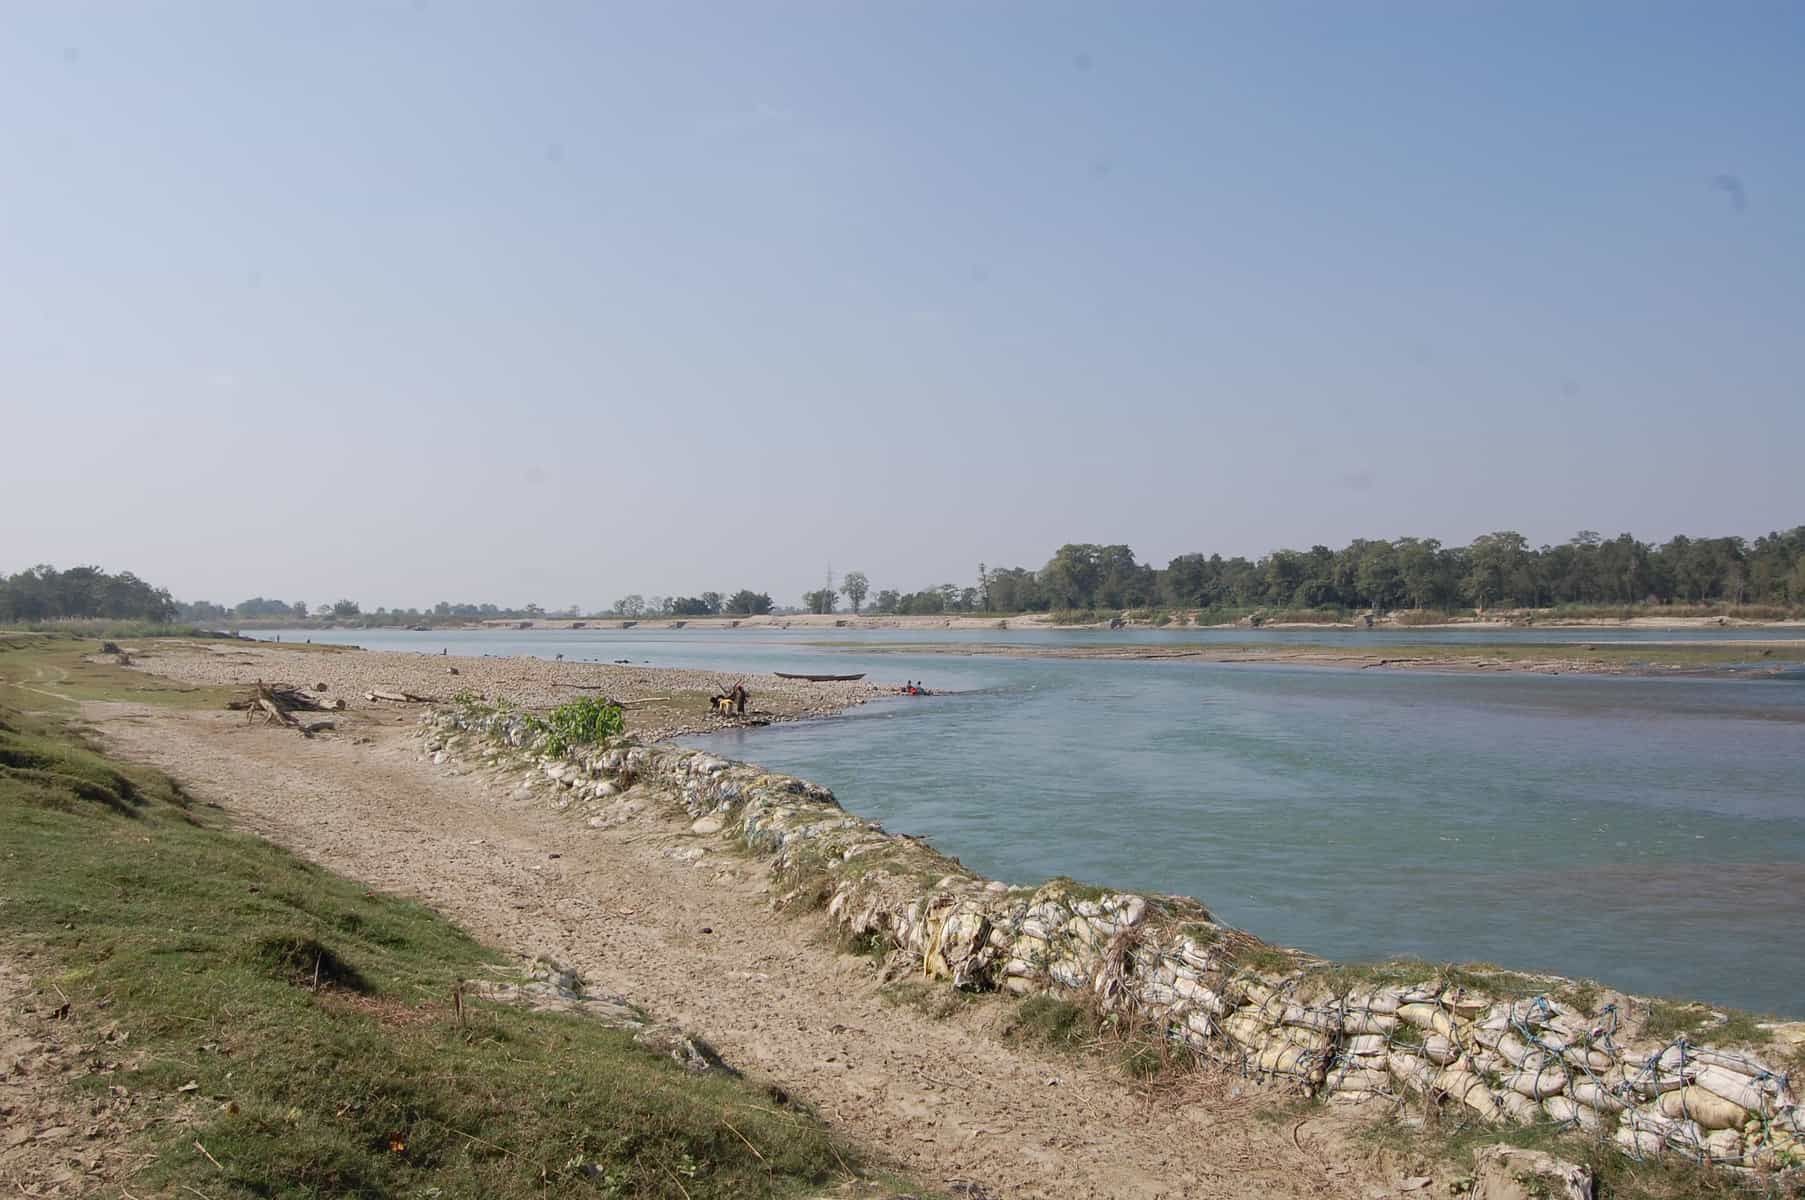
Karnali Basin in Nepal © Wei Liu | IIASA
That’s why we are working with Practical Action in the Zurich Flood Resilience Alliance to try to remedy this situation. Participatory Vulnerability and Capacity Assessment is a widely used tool to collect community level disaster risk and resilience information and to inform disaster risk reduction strategies. One of our first projects was to digitize a set of existing maps on disaster risk and community resources where the locations of, for example, rivers, houses, infrastructure and emergency shelters are usually hand-drawn by selected community members. Such maps provide critical information used by local stakeholders in designing and prioritizing among possible flood risk management options.
From hand-drawn to internet mapping
While hand-drawn maps are ideal for working in remote rural communities, they risk being damaged, lost, or simply unused. They are also more difficult to share with other stakeholders such as emergency services or merge with additional mapped information such as flood hazard. With the recent increase in internet mapping, platforms such as OpenStreetMap have made it possible for us to transfer existing maps or capture new information on a common platform in such a way that anyone with an internet connection can add, edit, and share maps. As this information is digital, it makes it easier to perform additional tasks, such as identifying households in areas of high risk or measuring the distance to the nearest emergency shelter, to support effective risk-reduction and resilience-building.
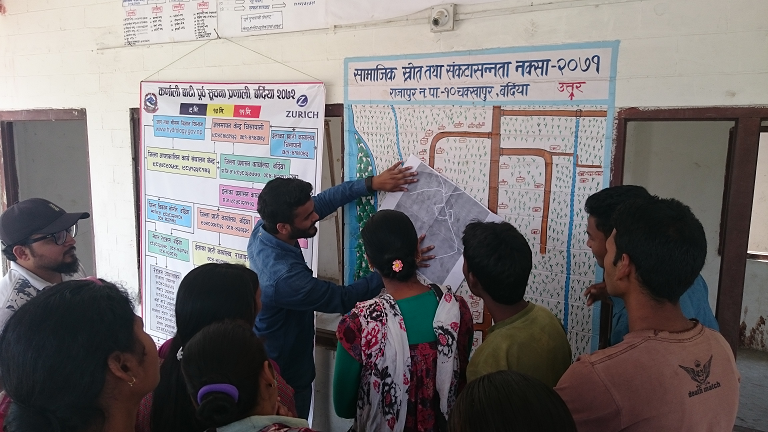
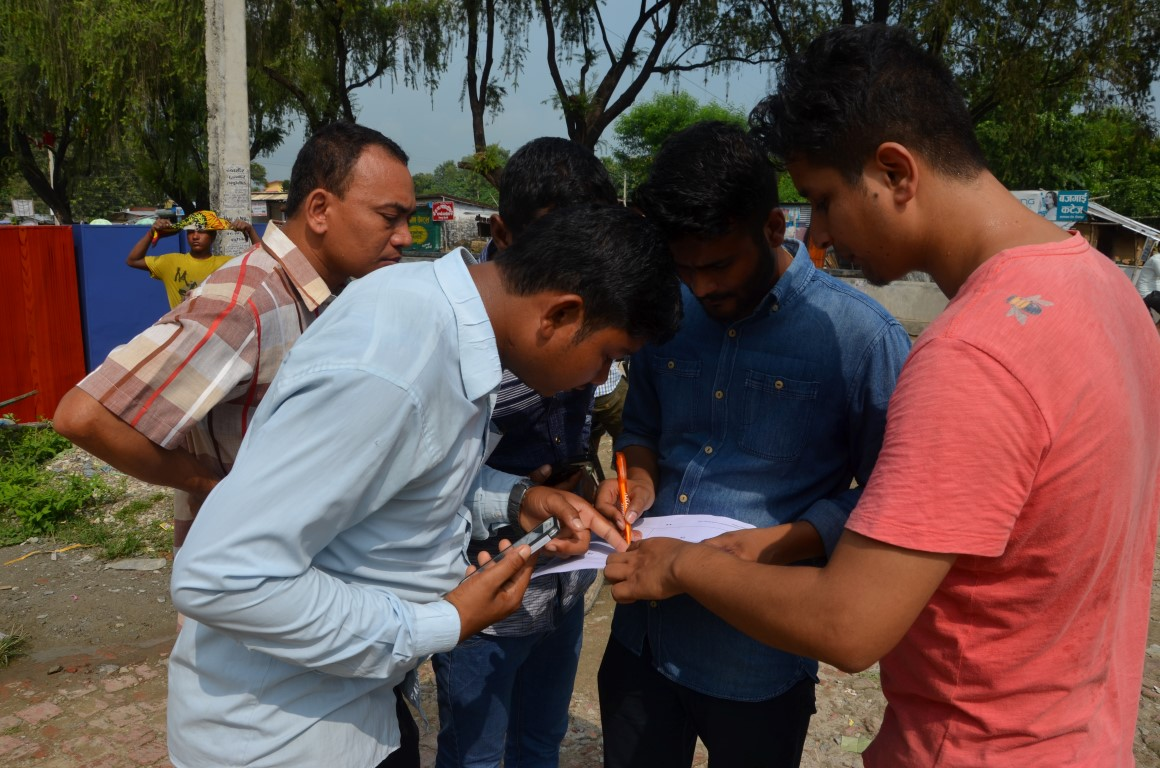
Practical Action Nepal, the Center for Social Development and Research, and community members discuss the transfer of community maps to online maps © Wei Liu | IIASA
From theory to practice
In March 2016, the Project team travelled to two Nepal communities in the Rajapur and Tikapur districts, to pilot the idea of working with a local NGO (the Center for Social Development and Research) and community members, to transfer their maps into a digital environment. The latter can easily be further edited, improved and shared within a broad range of stakeholders and potential users. Local residents in both communities were excited seeing their households and other features for the first time overlaid on a map with satellite imagery. The Center for Social Development and Research was also very enthusiastic about integrating their future community mapping activities with digital mapping, without losing the spirit of participation.
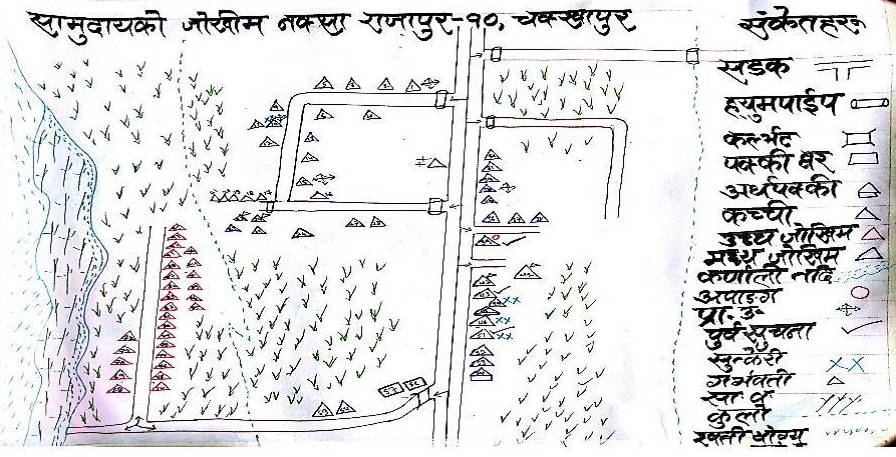
Hand drawn maps produced from community mapping exercises in Chakkhapur, Nepal © Practical Action
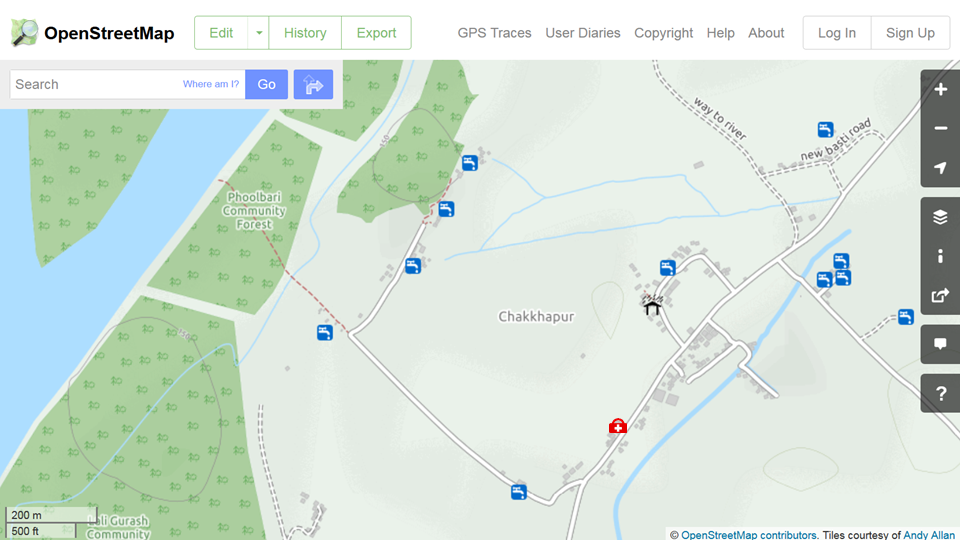
The resulting online maps in OpenStreetMap of Chakkhapur, Nepal, showing the location of drinking water, an emergency shelter and medical clinic. ©OpenStreetMap
Increasing resilience through improved information management
The first stage pilot study in the Karnali river basin confirmed the great potential of new digital technologies in providing accurate and locally relevant maps to improve flood risk assessment to support resilience building at the community level. The next step is to further engage local stakeholders. A wider partnership has been established between Practical Action, the Center for Social Development and Research, the International Institute for Applied Systems Analysis and Kathmandu Living Labs to further build local stakeholders’ capacity in mapping with digital technologies, including a training workshop for NGO staff members in September, 2016. The plan is to have more communities’ flood risk information mapped for designing more effective action plans and strategies for coping with future flood events across the Karnali river basin. A greater potential can be realized when this effort is further scaled up across the region and the results are placed into shared open online databases such as OpenStreetMap.
Further information
- Flood Resilience Portal
- Geo-Wiki Risk
- McCallum, I., Liu, W., See, L., Mechler, R., Keating, A., Hochrainer-Stigler, S., Mochizuki, J., Fritz, S., Dugar, S., Arestegui, M., Szoenyi, M., Laso Bayas, J.C., Burek, P., French, A. and Moorthy, I. (2016) Technologies to Support Community Flood Disaster Risk Reduction. International Journal of Disaster Risk Science, 7 (2). pp. 198-204. http://pure.iiasa.ac.at/13299/
Note: This article gives the views of the author, and not the position of the Nexus blog, nor of the International Institute for Applied Systems Analysis.
Jul 20, 2016 | Communication
By Luke Kirwan, open access manager, IIASA library.
Who reads your paper after it’s published? Altmetrics (Alternative Metrics) are a recent innovation designed to supplement traditional metrics, such as impact factors, which provide an overview of a journal’s standing within academia. However, these traditional measures are unable to take into account the dramatic changes in publishing and dissemination that the internet has brought.
Altmetrics complement traditional methods by accounting for the broader reach and impact of research online. They achieve this by tracking the digital identifier of research output, through DOIs, PubMed ids, arXiv ids, across a broad range of social media, mainstream media, blogs, policy documents, and reference management tools. This provides an immediate, broader, and more detailed overview of the impact of your publication. Each mention is given a weighted score, so for example a mention in a scientific publication is weighted far higher than a tweet. There are several well-documented studies of the benefits of article level metrics over impact factors.
When we designed the new IIASA Publication Repository (PURE), we incorporated altmetrics, because in today’s world, traditional metrics like impact factors no longer tell the whole story. The concept behind altmetrics is to broaden how impact is measured, beyond simply counting citations. I think of altmetrics and impact factors as two complementary tools with the same goal, but different ways of getting there.
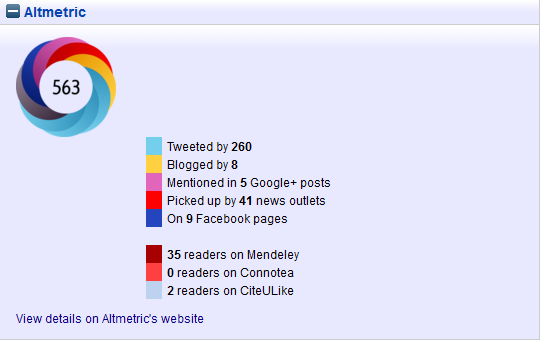
You can see the citation and usage data for an article in the Altmetric “donut” at the bottom of a record. By clicking on the link to Altmetric.com you can then access more detailed information about that publication’s reach. One of the core concepts behind altmetrics is that people should be able to access every mention that has gone into the weighted score. So by viewing the details for a record on Altmetric.com you can also find out who was tweeting about your paper, what newspaper articles it was mentioned in, who was blogging about it, and any other coverage. This means that you can immediately see the type of attention being generated by a piece of research, where this attention is coming from, what influence it has, and the geographic spread. Altmetrics relies on real-time data so results can be quantified rapidly. The goal is to quickly provide an overview of the diversity of areas where your research is being talked about. It is important to note that altmetrics is only assessing mentions of a research paper—it makes no judgement on quality. So this feedback needs to be read in the context of the quality of the paper and the research. This is partially the reason why Altmetric are so open about what information they use to generate their results.
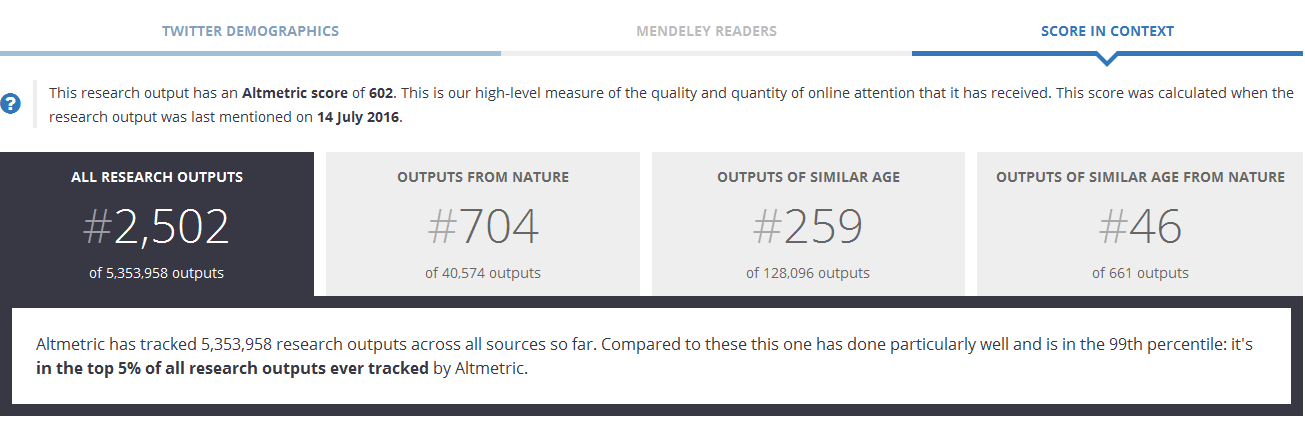
So what is a good altmetric score? This is not a particularly straight forward question as an altmetric score measures attention, which can be positive or negative. To help you understand your altmetric score select the “Score in Context” option. This will breakdown how the score compares with similar articles, all tracked research, and the output from that journal.
There are a number of ways you can help boost the attention your research is receiving. The first is to ensure that your research is made available in a repository as soon as possible. The sooner your research is accessible, the sooner it can be used and referenced. The better the metadata for a record the more visible is will be online. Older entries are also accounted for, though of course publications over ten years old do not benefit as much from social media. We are currently working through older entries in PURE to update their metadata. Tweeting and sharing your research will also help, especially if you use the social media analytics to identify who has been using your work in the past and develop connections with them.
A second way to improve your score is to develop your presence on informal social networks, like Twitter, blogs, and more structured academic networks like Google Scholar and Academia.edu. By linking them together you will boost your online presence and help ensure that your research reaches as many people as possible. Altmetrics relies on digital connections between your output, yourself, and your peer network so strengthening these linkages will help improve your visibility.
Altmetrics introduction video https://www.youtube.com/watch?v=6R6WdoQxvUE
OpenAIRE guidelines for researchers https://www.openaire.eu/intro-researchers
Note: This article gives the views of the author, and not the position of the Nexus blog, nor of the International Institute for Applied Systems Analysis.
Jun 2, 2016 | Climate Change
By Katherine Leitzell, IIASA science writer and press officer (and cyclist)
In May over 50 IIASA staff members took part in the Austrian Bike to Work month (Osterreich Radelt zur Arbeit), logging 11,681 kilometers riding to and from the institute in Laxenburg. The institute took fifth place in Austria in terms of kilometers ridden, and first place in Lower Austria.
According to the Austrian initiative’s calculations, this effort translated into saving over 1900 kg of CO2 emissions, or on average 36 kg per person—which is approximately 4% of an average Austrian’s monthly CO2 emissions. However, this calculation assumed that each of the IIASA cyclists would have been otherwise driving alone in a car. Since many people ride the bus or take public transport if they’re not biking, the actual emission savings from our cycling efforts in May were in fact much less. In fact, since buses and trains run anyway, cycling to work may make no impact whatsoever on emissions of air pollution and greenhouse gas emissions. Does that mean it’s not worth it to make the effort?
The author’s route to the office. © Katherine Leitzell | IIASA
IIASA researcher Jens Borken has analyzed the impacts that our daily travel has on the individual climate footprint. Personal mobility—all kinds of travel—make up about one third of the average European’s annual greenhouse gas emissions: the rest come from consumption choices and household heating and energy use. Of the carbon footprint from mobility, he says, commuting generally only makes up 10-15% of that. The largest part of the mobility budget is related to shorter and longer distance leisure travel, and in particular from air travel.
“From a quantitative perspective, the climate benefit of riding your bike is small, but it can be one step on a path to a low-carbon lifestyle.” says Borken. “As researchers who work on climate change, riding a bike to work (and possibly further) brings one piece of our lives in line with the message that avoiding fossil fuel consumption is imperative. I think that that is valuable. But it need not stop there. Travel choices are important, especially for longer distances, but so are consumption choices and energy usage and efficiency.”
Charlie Wilson, a researcher at the Tyndall Centre and IIASA, recently won a grant from the European Research Council to explore the role that social influence plays in spreading climate innovations. He says, “As social animals we are strongly influenced by what others do; as psychological beings we strive for consistency. Changing a behavior – like cycling to work – may have a small impact in isolation. But this impact is magnified through positive spillover effects. Others may imitate or be inspired by our commitment to cycling. And this change in behavior may also strengthen the pro-environmental aspects of our own self-identity, reducing dissonance between our work and domestic lives, and supporting further changes in behavior.”
Of course there are benefits of cycling beyond the environmental or climate impact, which is one reason that once they start, many people keep it up. Cycling regularly can save money compared to commuting by car or public transport, and like any regular form of exercise, it can bring health benefits and stress relief. It also brings autonomy and flexibility compared to public transport.
Borken points to research showing that the health benefits of cycling outweigh the exposure to air pollutants that a cyclist might experience on busy city streets—and that automobile drivers are exposed to even higher levels of air pollution within their cars. Cyclists who ride to IIASA, located about 15km outside Vienna, probably have even lower exposure to air pollution riding along tree-lined bike paths.
“Riding to work in the morning wakes me up and prepares me for the day ahead. Even if windy and challenging, the return in the evening calms the mind while riding with colleagues at a pace that allows us to chat at the end of a busy workday. It’s truly one of the best ways to get exercise and stay healthy – good for the heart, good for the environment and, most importantly, good for the soul,” says Michaela Rossini, manager of the IIASA library and a co-organizer of Bike to Work Month at the institute.

For some staff members, one side benefit of cycling to IIASA is the beautiful sunrise along the Danube River ©Michaela Rossini | IIASA
Note: This article gives the views of the author, and not the position of the Nexus blog, nor of the International Institute for Applied Systems Analysis.
You must be logged in to post a comment.