Jul 3, 2017 | Data and Methods, Food
By Victor Maus, IIASA Ecosystems Services and Management Program
Nowadays, satellite images are an abundant supply of data which we can use to get information about our planet and its changes. Satellite images can, for example, help us detect an approaching storm, measure the expansion of a city, identify deforested areas, or estimate how crop areas change over time. Usually, we are interested in extracting information from large areas, for example, deforestation in the Amazon Rainforest (5.5 million km², around 15 times the area of Germany). It would be challenging for us to monitor and map such vast areas without combining satellite images with automated and semi-automated computer programs.

Aerial view of the Amazon Rainforest, near Manaus, Brazil. Monitoring deforestation in the Amazon is difficult because the area is massive and remote. ©Neil Palmer | CIAT
To address this problem, I developed — along with my colleagues Gilberto Camara from the Brazilian National Institute for Space Research and Marius Appel and Edzer Pebesma from the University of Münster, Germany — a new open source software to extract information about land-cover changes from satellite images. The tool maps different crop types (e.g., soybean, maize, and wheat), forests, and grassland, and can be used to support land-use monitoring and planning.
Our software, called dtwSat, is open-source and can be freely installed and used for academic and commercial purposes. It builds upon on other graphical and statistical open-source extensions of the statistical program R. Adding to that, our article in press in Journal of Statistical Software is completely reproducible and provides a step-by-step example of how to use the tool to produce land-cover maps. Given that we have public access to an extensive amount satellite images, we also get much benefit from tools that are openly available, reproducible, and comparable. These, in particular, can contribute to rapid scientific development.
The software dtwSat is based on a method widely used for speech recognition called Dynamic Time Warping (DTW). Instead of spoken words, we adapted DTW to identify ‘phenological cycles’ of the vegetation. These encompass the plants’ life cycle events, such as how deciduous trees lose their leaves in the fall. The software compares a set of phenological cycles of the vegetation measured from satellite images (just like a dictionary of spoken words) with all pixels in successive satellite images, taken at different times. After comparing the satellite time series with all phenological cycles in the dictionary, dtwSat builds a sequence of the land-cover maps according to similarity to the phenological cycles.
The series of maps produced by dtwSat allows for land-cover change monitoring and can help answer questions such as how much of the Amazon rainforest has been replaced with soy or grass for cattle grazing during the last decade? It could also help study the effects of policies and international agreements, such Brazil’s Soy Moratorium, where soybean traders agreed not to buy soy from areas deforested after 2006 in the Brazilian Amazon. If soy farming cannot expand over areas deforested after 2006, it might expand to areas formerly used for cattle grazing deforested before 2006, and force the cattle grazing farmers to open new areas that have been cleared more recently. Therefore, besides monitoring changes, the land-cover information can help better understand direct and indirect drivers of deforestation and support new land-use policy.
Further info: dtwSat is distributed under the GPL (≥2) license. The software is available from the IIASA repository PURE pure.iiasa.ac.at/14514/. Precompiled binary available from CRAN at cran.r-project.org/web/packages/dtwSat/index.html
dtwSat development version available from GitHub at github.com/vwmaus/dtwSat
Reference:
Maus V, Camara G, Appel M, & Pebesma E (2017). dtwSat: Time-Weighted Dynamic Time Warping for Satellite Image Time Series Analysis in R. Journal of Statistical Software (In Press).
Maus, V, Camara, G, Cartaxo, R, Sanchez, A, Ramos, FM, & de Queiroz, GR (2016). A Time-Weighted Dynamic Time Warping Method for Land-Use and Land-Cover Mapping. IEEE Journal of Selected Topics in Applied Earth Observations and Remote Sensing 9 (8): 3729–39.
This article gives the views of the author, and not the position of the Nexus blog, nor of the International Institute for Applied Systems Analysis.
Jun 12, 2017 | Citizen Science
By Linda See, IIASA Ecosystems Services and Management Program
Satellites have changed the way that we see the world. For more than 40 years, we have had regular images of the Earth’s surface, which have allowed us to monitor deforestation, visualize dramatic changes in urbanization, and comprehensively map the Earth’s surface. Without satellites, our understanding of the impacts that humans are having on the terrestrial ecosystem would be much diminished.
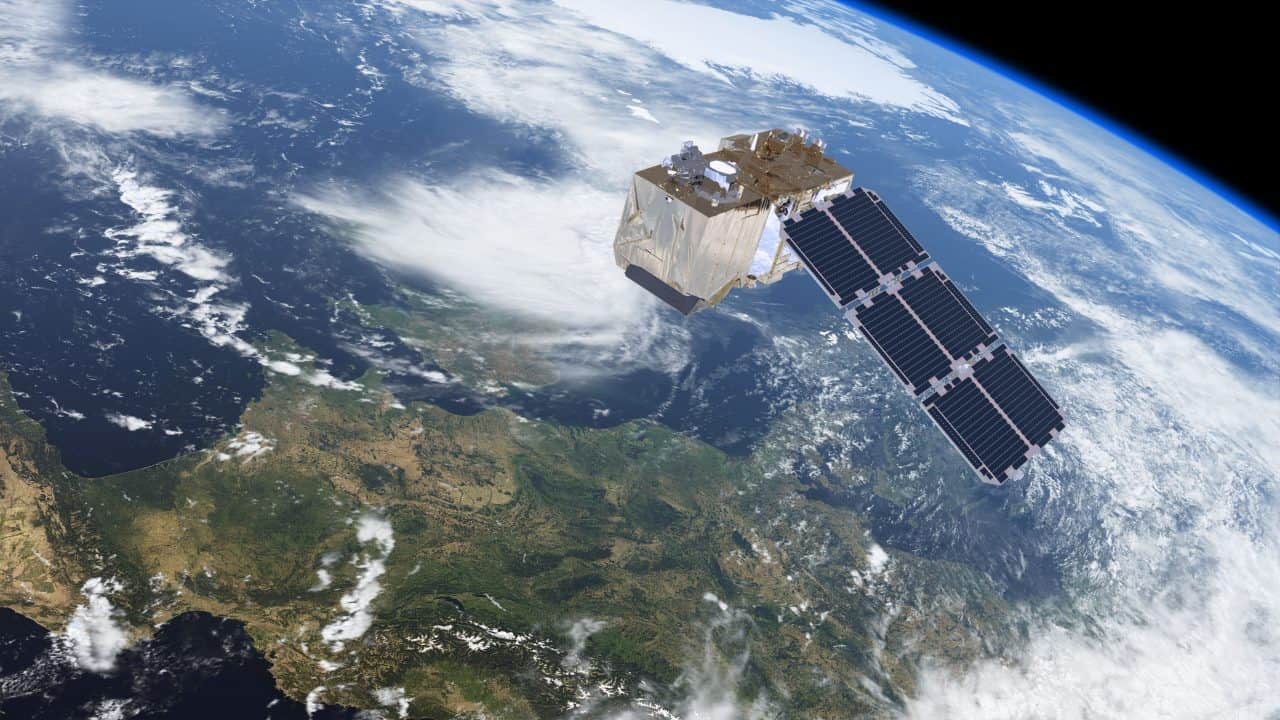
The Sentinel-2 satellite provides high-resolution land-cover data. © ESA/ATG medialab
Over the past decade, many more satellites have been launched, with improvements in how much detail we can see and the frequency at which locations are revisited. This means that we can monitor changes in the landscape more effectively, particularly in areas where optical imagery is used and cloud cover is frequent. Yet perhaps even more important than these technological innovations, one of the most pivotal changes in satellite remote sensing was when NASA opened up free access to Landsat imagery in 2008. As a result, there has been a rapid uptake in the use of the data, and researchers and organizations have produced many new global products based on these data, such as Matt Hansen’s forest cover maps, JRC’s water and global human settlement layers, and global land cover maps (FROM-GLC and GlobeLand30) produced by different groups in China.
Complementing Landsat, the European Space Agency’s (ESA) Sentinel-2 satellites provide even higher spatial and temporal resolution, and once fully operational, coverage of the Earth will be provided every five days. Like NASA, ESA has also made the data freely available. However, the volume of data is much higher, on the order of 1.6 terabytes per day. These data volumes, as well as the need to pre-process the imagery, can pose real problems to new users. Pre-processing can also lead to incredible duplication of effort if done independently by many different organizations around the world. For example, I attended a recent World Cover conference hosted by ESA, and there were many impressive presentations of new applications and products that use these openly available data streams. But most had one thing in common: they all downloaded and processed the imagery before it was used. For large map producers, control over the pre-processing of the imagery might be desirable, but this is a daunting task for novice users wanting to really exploit the data.
In order to remove these barriers, we need new ways of providing access to the data that don’t involve downloading and pre-processing every new data point. In some respects this could be similar to the way in which Google and Bing provide access to very high-resolution satellite imagery in a seamless way. But it’s not just about visualization, or Google and Bing would be sufficient for most user needs. Instead it’s about being able to use the underlying spectral information to create derived products on the fly. The Google Earth Engine might provide some of these capabilities, but the learning curve is pretty steep and some programming knowledge is required.
Instead, what we need is an even simpler system like that produced by Sinergise in Slovenia. In collaboration with Amazon Web Services, the Sentinel Hub provides access to all Sentinel-2 data in one place, with many different ways to view the imagery, including derived products such as vegetation status or on-the-fly creation of user-defined indices. Such a system opens up new possibilities for environmental monitoring without the need to have either remote sensing expertise, programming ability, or in-house processing power. An exemplary web application using Sentinel Hub services, the Sentinel Playground, allows users to browse the full global multi-spectral Sentinel-2 archive in matter of seconds.
This is why we have chosen Sentinel Hub to provide data for our LandSense Citizen Observatory, an initiative to harness remote sensing data for land cover monitoring by citizens. We will access a range of services from vegetation monitoring through to land cover change detection and place the power of remote sensing within the grasp of the crowd.
Without these types of innovations, exploitation of the huge volumes of satellite data from Sentinel-2, and other newly emerging sources of satellite data, will remain within the domain of a small group of experts, creating a barrier that restricts many potential applications of the data. Instead we must encourage developments like Sentinel Hub to ensure that satellite remote sensing becomes truly usable by the masses in ways that benefits everyone.
This article gives the views of the author, and not the position of the Nexus blog, nor of the International Institute for Applied Systems Analysis.
Oct 13, 2014 | Citizen Science, Environment
By Linda See and Ian McCallum, IIASA Ecosystems Services and Management Program, Earth Observation Team
Land cover is of fundamental importance for environmental research. It serves as critical baseline information for many large-scale models, for example in developing future scenarios of land use and climate change. However, current land cover products are not accurate enough for many applications and to improve them we need better and more accessible validation data. We recently argued this point in a Nature correspondence, and here we take the opportunity to expand on our brief letter.
In the last decade, multiple global land cover data products have been developed. But when these products are compared, there are significant amounts of spatial disagreement across land cover types. Where one map shows cropland, another might show forest domains. These discrepancies persist even when you take differences in the legend definitions into account. The reasons for this disagreement include the use of different satellite sensors, different classification methodologies, and the lack of sufficient data from the ground, which are needed to train, calibrate, and validate land cover maps.

An artist’s illustration of the NASA Landsat Data Continuity Mission spacecraft, one of the many satellites that collects data about Earth’s surface. Credit: NASA/GSFC/Landsat
A recent Comment in Nature (Nature, 513, 30-31; 2014) argued that freely available satellite imagery will improve science and environmental-monitoring products. Although we fully agree that greater open access and sharing of satellite imagery is urgently needed, we believe that this plea neglects a crucial component of land cover generation: the data required to calibrate and validate these products.
At present, remotely sensed global land cover is not accurate enough for monitoring biodiversity loss and ecosystem dynamics or for many of the other applications for which baseline land cover and change over time are critical inputs. When Sentinel-2–a new Earth observation satellite to be launched in 2015 by the European Space Agency–comes online, it will be possible to produce land cover maps at a resolution of 10 meters. Although this has incredible potential for society as a whole, these products will only be useful if they represent the land cover more accurately than the current products available. To improve accuracy, more calibration and validation data are required. Although more investment is clearly needed in ground-based measurements, there are other, complementary solutions to this problem.

Map showing cropland disagreement between two different land cover maps, GlobCover and GLC2000: all colors represent disagreement. Credit: Geo-Wiki.org, Google Earth
Not only should governments and research institutes be urged to share imagery, they should also share their calibration and validation data. Some efforts have been made by the Global Observation for Forest Cover and Land Dynamics (GOFC-GOLD) in this direction, but there is an incredible amount of data that remains locked within institutes and agencies. The atmospheric community shares their data much more readily than the Earth Observation (EO) community, even though we would only benefit by doing so.
Crowdsourcing of calibration and validation data also has real potential for vastly increasing the amount of data available to improve classification algorithms and the accuracy of land cover products. The IIASA Geo-Wiki project is one example of a growing community of crowdsourcing applications that aim to improve the mapping of the Earth’s surface.

New apps developed by IIASA’s Earth Observation Team aim to involve people around the world in on-the-ground data validation efforts.
Geo-Wiki is a platform which provides citizens with the means to engage in environmental monitoring of the earth by providing feedback on existing spatial information overlaid on satellite imagery or by contributing entirely new data. Data can be input via the traditional desktop platform or mobile devices, with campaigns and games used to incentivize input. Resulting data are available without restriction.
Another major research projects we are using to address many of these issues identified above is the ERC Project Crowdland .
More information
Note: This article gives the views of the authors, and not the position of the Nexus blog, nor of the International Institute for Applied Systems Analysis.
Apr 30, 2014 | Alumni, Food & Water
Eric F. Wood is a hydrologist at Princeton University, well-known for his work in hydrology, climate, and meteorology. He worked as a research scholar in IIASA’s Water program from 1974 to 1976. On 30 April, 2014, he received the European Geophysical Union’s Alfred Wegener Medal in Vienna, Austria.

Eric F. Wood (Credit: Princeton University)
IIASA: How did you get interested in hydrology? What drew you to the field?
EW: I came to IIASA after I finished my doctorate at MIT. I worked in the areas of system analysis and statistics related to water resources. During my first sabbatical leave at the Institute of Hydrology in the UK (now the Center for Hydrology and Ecology), I started to collaborate with Keith Beven on hydrological modeling, which started my transition towards the physical side of the water cycle from the policy and systems analysis side.
A few years later, Robert Gurney, then at NASA and now at the University of Reading (UK), asked if I would be on the Science Advisory Committee for NASA’s Earth Observing System (EOS), which was just starting to be planned. This started my research activities in terrestrial remote sensing. Over the next 25 years these elements have played heavily in my research activities.
What have been the biggest changes in hydrology and earth science over your career – either in terms of new understandings, or in how the science is done?
I can name three huge changes, all inter-connected: One is the increase in computational resources. High performance computing—petabyte computing using 500,000+ cores—is now available that allows us to simulate the terrestrial water and energy budgets using physics resolving land surface models at 100m to 1km resolutions over continental scales, and soon at global scales. The second big change is the availability of remotely sensed observations. There are satellite missions that have lasted far beyond their planned lifetimes, such as the NASA EOS Terra mission, where we now have over 15 years of consistent observations. These observations have been reprocessed as algorithms have improved so we can now use the information to understand environmental change at regional to global scales. The third major shift has been computer storage. Large amounts are available at low prices. We have about 500 Terabytes of RAID storage, and can acquire 150TB for about $10,000 or less. This allows us to store model simulations, remote sensing data, and do analyses that were once impossible. Together, these three changes have transformed my field, and the field of climate change related to terrestrial hydrology. Going forward, we have the data, the projections and analytical tools to look at water security in the 21st Century under environmental change.
What insights has remote sensing brought to hydrology?
Remote sensing offers a global consistency that is unavailable with in-situ observations, and offers observations over regions without ground data. This permits us to analyze hydrologic events such as droughts within a global context, and relate these hydrologic events to other drivers like ENSO (tropical Pacific sea surface temperature anomalies) that affect weather and seasonal climate patterns.

Wood’s work has focused in part on drought and climate change. Badwater, California, a huge salt flat drainage system for the Death Valley desert. Credit: Carolina Reyes (distributed via imaggeo.egu.eu)
What do you see as the key questions currently facing water resources?
The biggest question I see over the next decades is how water security will be affected by environmental change. By environmental change I mean climate change, global urbanization, increasing demand for food, land use and land cover change, pollution, etc. Water security is coupled to food and energy security, and water security is and it is intrinsically linked to the climate system and how that may be changing.
How did IIASA influence your research interests or career?
I made many friendships during my stay at IIASA and I was exposed to world-class research and researchers. This helped me in thinking about important research questions and the types of problems and research that will have impact.
What do you think is the role for IIASA in the worldwide research community?
There are many answers to this question. IIASA plays an important role in providing critical scientific information and analyses related to global issues that go beyond countries – transboundary analyses, and therefore that can provide the scientific basis for global policies. There is an urgent need for more global policies on environmental change and adaptation, food and water security, and environmental refugees, to name just a couple examples in my area.
IIASA has also developed scientific methods and data that can be applied by various groups. For example, IIASA’s world renowned integrated assessment models have been used in climate change modeling for the IPCC and Coupled Model intercomparison Project (CMIP).
Note: This article gives the views of the author, and not the position of the Nexus blog, nor of the International Institute for Applied Systems Analysis.
48.20640816.383561
Aug 21, 2013 | Citizen Science
By Linda See, Research Scholar, IIASA Ecosystems Services and Management Program
Humans have a long history of map-making that can be traced back to cave paintings older than 20,000 years, and detailed maps made by the ancient Romans, Greeks, and Chinese. These maps tell the story of exploration and changing borders of states, countries, and populations.

This screenshot shows our Geo-Wiki tool for collecting data from the crowd.
Until recently, military and government mapping agencies have been entirely in control of mapping, but this is changing. The rise of neogeography and user-generated geo-referenced content online has led to a new generation of community-based maps such as OpenStreetMap. Enabled by interactive web technology (Web 2.0) and the GPS in mobile phones, people are now mapping different aspects of the Earth’s surface through crowdsourcing. This new model has proved its worth in cases like the post-disaster recovery, e.g. the devastating earthquake in Haiti.
The trouble with maps
Even in this age of satellites and space technology, it is far from easy to generate good automated representations of the Earth’s surface. While satellite imagery has allowed us to create global maps of land cover—the various materials such as grass, trees, water, and cities that cover the Earth’s surface—at various resolutions from 10 km to 30 m, there are two main problems with all the different products that are now currently available. The first is that these products have accuracies that are only between 65 to 75%. Secondly, when they are compared with one another, there are large spatial disagreements between them. If you are a user of these products, which one should you choose? How can you trust any one of these products when they have uncertainties as large as 25 to 35%? And more importantly, without good baseline information about the Earth’s land cover, such as the amount of forest or cropland, how can we possibly predict what will happen in the future?
The Geo-Wiki Project
Our Geo-Wiki project aims to solve this problem through crowdsourcing. With open access to satellite imagery through Google Earth and Bing Maps, citizens and interested experts can help us better characterize land cover, to correct existing land cover maps or build new ones. Geo-Wiki is a simple set of tools to sample the Earth’s surface, which allows a network of Geo-Wiki volunteers to tell us what type of land cover is visible from Google Earth or Bing Maps.

This map of cropland in Ethiopia was created from crowd-sourced data.
One example of our crowd-sourcing campaigns was focused on mapping cropland in Ethiopia. Over a three week period, we collected more than 80,000 samples across the country, roughly 5% of the area of Ethiopia. Using simple interpolation, we have demonstrated that a cropland map of Ethiopia, a key type of land cover, can be created very easily, with just a small crowd of volunteers. We validated the map using an official validation data set from the GOFC/GOLD reference portal as well as other crowdsourced data collected through Geo-Wiki. The results of this study showed that the map is considerably more accurate than global land cover maps for Ethiopia when considering only cropland. You can find more details about this research at:
See, L. McCallum, I., Fritz, S., Perger, C., Kraxner, F., Obersteiner, M., Deka Baruah, U., Mili, N. and Ram Kalita, N. 2013. Mapping Cropland in Ethiopia using Crowdsourcing. International Journal of Geosciences, 4(6A1), 6-13 http://dx.doi.org/10.4236/ijg.2013.46A1002.
Get involved
The Ethiopian example is just the tip of the mapping iceberg. As more citizens get involved in mapping land cover online—for example with our Geo-Wiki Pictures app, we could revolutionize land cover mapping in the future.
If you are interested in helping us improve land cover, register at http://www.geo-wiki.org or find us on Facebook to join our crowdsourcing network and learn more about upcoming crowdsourcing campaigns.
Note: This article gives the views of the author, and not the position of the Nexus blog, nor of the International Institute for Applied Systems Analysis.
48.06887716.355499


You must be logged in to post a comment.