Jun 12, 2017 | Citizen Science
By Linda See, IIASA Ecosystems Services and Management Program
Satellites have changed the way that we see the world. For more than 40 years, we have had regular images of the Earth’s surface, which have allowed us to monitor deforestation, visualize dramatic changes in urbanization, and comprehensively map the Earth’s surface. Without satellites, our understanding of the impacts that humans are having on the terrestrial ecosystem would be much diminished.
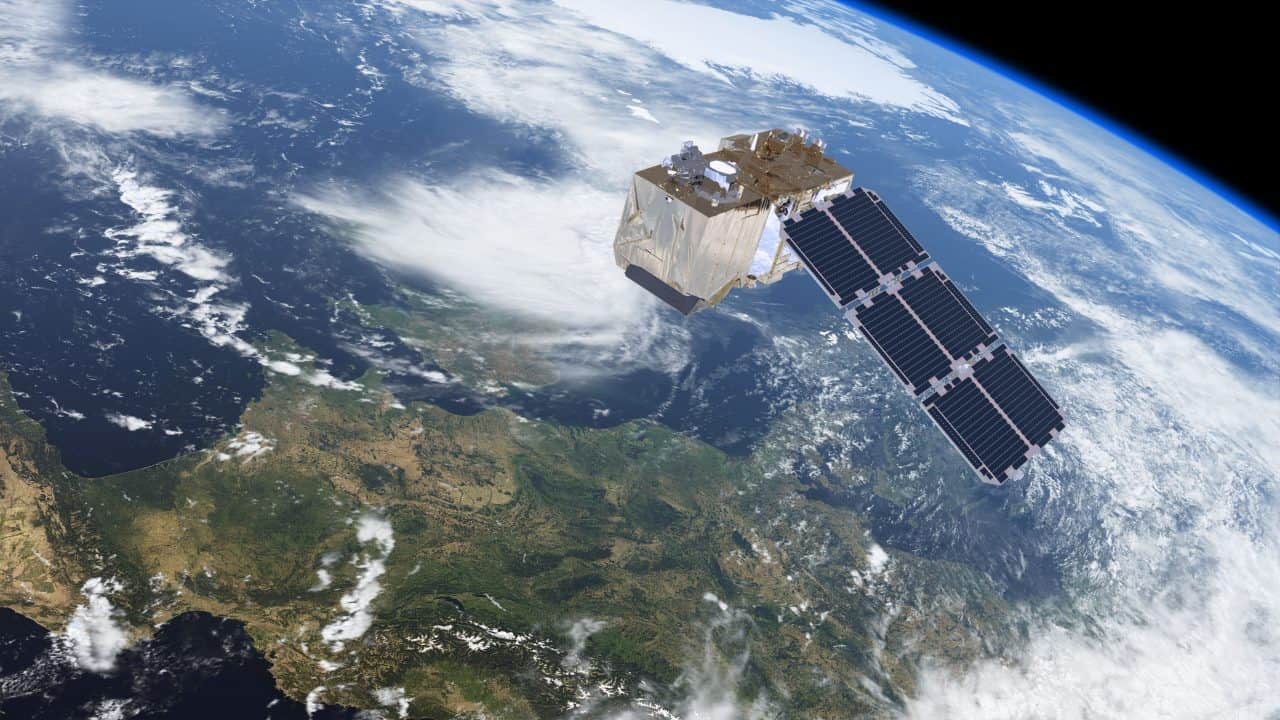
The Sentinel-2 satellite provides high-resolution land-cover data. © ESA/ATG medialab
Over the past decade, many more satellites have been launched, with improvements in how much detail we can see and the frequency at which locations are revisited. This means that we can monitor changes in the landscape more effectively, particularly in areas where optical imagery is used and cloud cover is frequent. Yet perhaps even more important than these technological innovations, one of the most pivotal changes in satellite remote sensing was when NASA opened up free access to Landsat imagery in 2008. As a result, there has been a rapid uptake in the use of the data, and researchers and organizations have produced many new global products based on these data, such as Matt Hansen’s forest cover maps, JRC’s water and global human settlement layers, and global land cover maps (FROM-GLC and GlobeLand30) produced by different groups in China.
Complementing Landsat, the European Space Agency’s (ESA) Sentinel-2 satellites provide even higher spatial and temporal resolution, and once fully operational, coverage of the Earth will be provided every five days. Like NASA, ESA has also made the data freely available. However, the volume of data is much higher, on the order of 1.6 terabytes per day. These data volumes, as well as the need to pre-process the imagery, can pose real problems to new users. Pre-processing can also lead to incredible duplication of effort if done independently by many different organizations around the world. For example, I attended a recent World Cover conference hosted by ESA, and there were many impressive presentations of new applications and products that use these openly available data streams. But most had one thing in common: they all downloaded and processed the imagery before it was used. For large map producers, control over the pre-processing of the imagery might be desirable, but this is a daunting task for novice users wanting to really exploit the data.
In order to remove these barriers, we need new ways of providing access to the data that don’t involve downloading and pre-processing every new data point. In some respects this could be similar to the way in which Google and Bing provide access to very high-resolution satellite imagery in a seamless way. But it’s not just about visualization, or Google and Bing would be sufficient for most user needs. Instead it’s about being able to use the underlying spectral information to create derived products on the fly. The Google Earth Engine might provide some of these capabilities, but the learning curve is pretty steep and some programming knowledge is required.
Instead, what we need is an even simpler system like that produced by Sinergise in Slovenia. In collaboration with Amazon Web Services, the Sentinel Hub provides access to all Sentinel-2 data in one place, with many different ways to view the imagery, including derived products such as vegetation status or on-the-fly creation of user-defined indices. Such a system opens up new possibilities for environmental monitoring without the need to have either remote sensing expertise, programming ability, or in-house processing power. An exemplary web application using Sentinel Hub services, the Sentinel Playground, allows users to browse the full global multi-spectral Sentinel-2 archive in matter of seconds.
This is why we have chosen Sentinel Hub to provide data for our LandSense Citizen Observatory, an initiative to harness remote sensing data for land cover monitoring by citizens. We will access a range of services from vegetation monitoring through to land cover change detection and place the power of remote sensing within the grasp of the crowd.
Without these types of innovations, exploitation of the huge volumes of satellite data from Sentinel-2, and other newly emerging sources of satellite data, will remain within the domain of a small group of experts, creating a barrier that restricts many potential applications of the data. Instead we must encourage developments like Sentinel Hub to ensure that satellite remote sensing becomes truly usable by the masses in ways that benefits everyone.
This article gives the views of the author, and not the position of the Nexus blog, nor of the International Institute for Applied Systems Analysis.
Feb 21, 2017 | Citizen Science
By Linda See, IIASA Ecosystems Services and Management Program
One of the biggest questions when it comes to citizen science is the quality of the data. Scientists worry that citizens are not as rigorous in their data collection as professionals might be, which calls into question the reliability of the data. At a meeting this month in Brussels on using citizen science to track invasive species, we grappled with the question: what it will take to trust this data source, particularly if it’s going to be used to alert authorities regarding the presence of an invasive species in a timely manner.
This discussion got me thinking about what other types of data are supplied by citizens that authorities simply trust, for example, when a citizen calls the emergency services to report an incident, such as a fire. Such reports are investigated by the authorities and the veracity of the alert is not questioned. Instead authorities are obliged to investigate such reports.
Yet the statistics show that false alarms do occur. For example, in 2015, there were more than 2.5 million false fire alarms in the United States, of which just under a third were due to system malfunctions. The remaining calls were unintentional, malicious, or other types of false alarms, such as a bomb scare. Statistics for calls to the emergency services more generally show similar trends in different European countries, where the percentage of false reports range from 40% in Latvia up to 75% in Lithuania and Norway. So why is it that we inherently trust this data source, despite the false alarm rate, and not data from citizen scientists? Is it because life is threatened or because fires are easier to spot than invasive species, or simply because emergency services are mandated with the requirement to investigate?
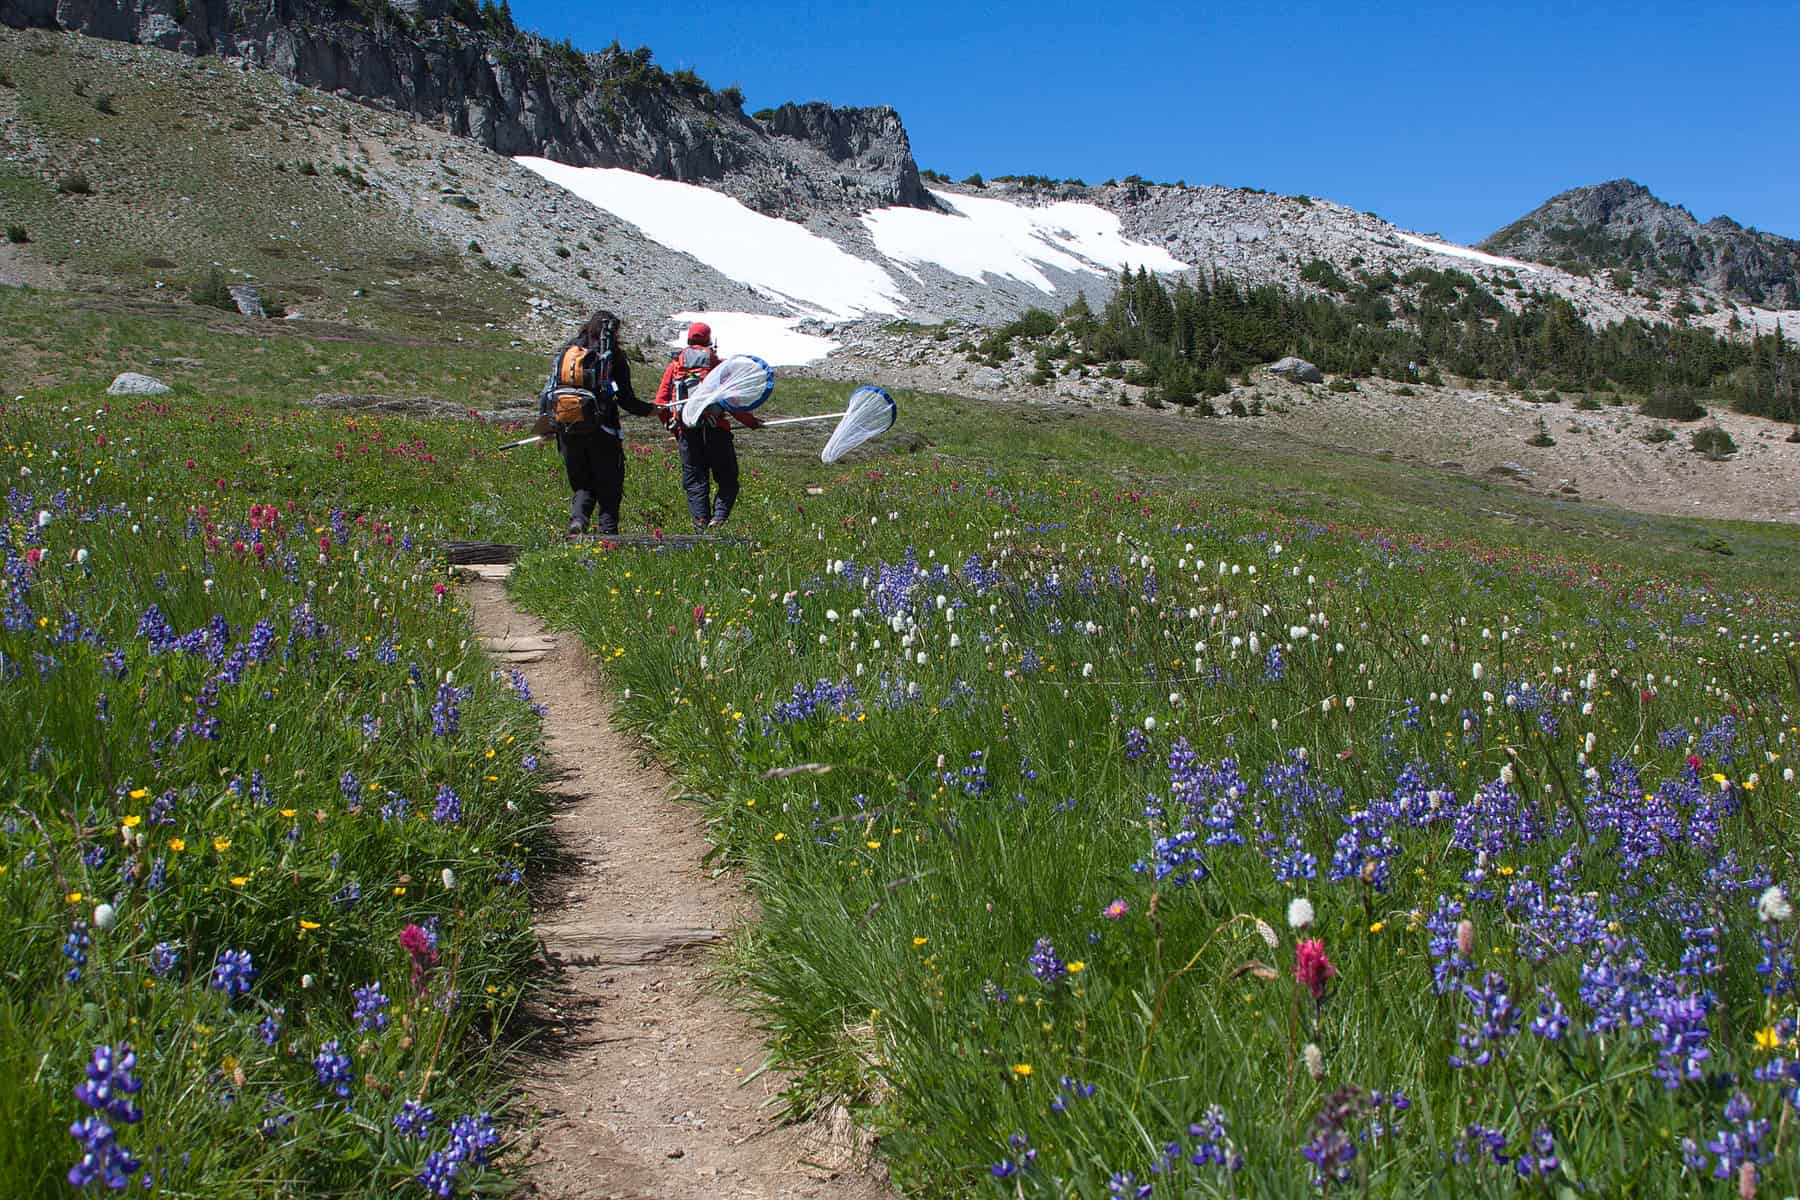
Volunteers monitor butterflies in Mount Rainier National Park, as part of the Cascade Butterfly Project, a citizen science effort organized by the US National Park Service © Kevin Bacher | US National Park Service
A recent encouraging development for citizen science was the signing of an executive order by President Obama on 6 January 2017, which gave federal agencies the jurisdiction to use citizen science and crowdsourced data in their operations. Do we need something similar in the EU or at the level of member states? And what will it really take for authorities to trust scientific data from citizens?
To move from the current situation of general distrust in citizen science data to one in which the data are viewed as a potentially useful source of information, we need further action. First we need to showcase examples of where data collected by citizens are already being used for monitoring. At the meeting in Brussels, Kyle Copas of the Global Biodiversity Information Facility (GBIF) noted that up to 40% of the data records in GBIF are supplied by citizens, which surprised many of the meeting participants. Data from GBIF are used for national and international monitoring of biodiversity. Secondly, we need to quantify the value of information coming from citizen scientists. For example, how much money could have been saved if reports on invasive species from citizens were acted upon? Third, we need to forge partnerships with government agencies to institutionally embed citizen science data streams into everyday operations. For example, the LandSense citizen observatory, a new project, aims to do exactly this. We are working with the National Mapping Agency in France to use citizen science data to update their maps but there are many other similar examples with other local and national agencies that will be tested over the next 3.5 years.
Finally, we need to develop quality assurance systems that can be easily plugged into the infrastructure of existing organizations. The EU-funded COBWEB project began building such a citizen science-based quality assurance system, which we are continuing to develop in LandSense as a service. Providing out-of-the-box tools may be one solution to help organizations to begin working with citizen science data more seriously at an institutional level.
IIASA researchers test the Fotoquest app, a citizen science game developed at IIASA. ©Katherine Leitzell | IIASA
These measures will clearly take time to implement so I don’t expect that the discussion on the quality of the data will be removed from any agenda for some time to come. However, I look forward to the day when the main issue revolves around how we can possibly handle the masses of big data coming from citizens, a situation that many of us would like to be in.
More Information about the meeting: https://ec.europa.eu/jrc/en/event/workshop/citizen-science-open-data-model-invasive-alien-species-europe
This article gives the views of the author, and not the position of the Nexus blog, nor of the International Institute for Applied Systems Analysis.
Oct 1, 2015 | Citizen Science
By Linda See, IIASA Ecosystems Services and Management Program
We had another very hot summer this year in Europe and many other parts of the world. Many European cities, including London, Madrid, Frankfurt, Paris and Geneva, broke new temperature records.
Cities are particularly vulnerable to increasing temperatures because of a phenomenon known as the urban heat island effect. First measured more than a half a century ago by Tim Oke, the increased temperatures measured in urban areas are a result of urban land use, or higher amounts of impervious surfaces such as concrete and concentrated urban structures. The urban heat island effect impacts human health and well-being. It’s not just a matter of comfort: during the heat wave in 2003, more than 70,000 people in Europe are estimated to have perished, mostly urban dwellers.

Summer 2015 in Ljubljana, Slovenia. ©K. Leitzell | IIASA
While climate models have many uncertainties, they do all agree that the urban heat island effect will increase in frequency and duration in the future. A recent article by Hannah Hoag in Nature paints a bleak picture of just how unprepared cities are for dealing with increasing temperatures. The paper cites positive and negative examples of mitigation from various cities but it falls short of suggesting a more widely applicable solution.
What we need is a standardized way of approaching the problem. Underlying this lack of standards is the paucity of data on the form and function of cities. By form I mean the geometry of the city–a 3D model of the buildings and road network, and information on the building materials—as well as a map of the basic land cover including impervious surfaces like roads and sidewalks, and areas of vegetation such as gardens, parks, and fields. Function refers to the building use, road types, use of irrigation and air conditioning and other factors that affect local atmospheric conditions. As climate models become more highly resolved, they will need vast amounts of such information to feed into them.
These issues are what led me and my colleagues (Prof Gerald Mills of UCD, Dr Jason Ching of UNC and many others) to conceive the World Urban Database and Access Portal Tools (WUDAPT) initiative (www.wudapt.org). WUDAPT is a community-driven data collection effort that draws upon the considerable network of urban climate modelers around the world. We start by dividing a city into atmospherically distinct areas, or Local Climate Zones (LCZs) developed by Stewart and Oke, which provides a standard methodology for characterizing cities that can improve the parameters needed for data-hungry urban climate models.
Using freely available satellite imagery of the Earth’s surface, the success of the approach relies on local urban experts to provide representative examples of different LCZs across their city. We are currently working towards creating an LCZ classification for all C40 cities (a network of cities committed to addressing climate change) but are encouraging volunteers to work on any cities that are of interest to them. We refer to this as Level 0 data collection because it provides a basic classification for each city. Further detailed data collection efforts (referred to as Levels 1 and 2) will use a citizen science approach to gather information on building materials and function, landscape morphology and vegetation types.

The Local Climate Zone (LCZ) map for Kiev.
WUDAPT will equip climate modelers and urban planners with the data needed to examine a range of mitigation and adaptation scenarios: For example what effect will green roofs, changes in land use or changes in the urban energy infrastructure have on the urban heat island and future climate?
The ultimate goal of WUDAPT is to develop a very detailed open access urban database for all major cities in the world, which will be valuable for many other applications from energy modelling to greenhouse gas assessment. If we want to improve the science of urban climatology and help cities develop their own urban heat adaptation plans, then WUDAPT represents one concrete step towards reaching this goal. Contact us if you want to get involved.
About the WUDAPT Project
The WUDAPT concept has been developed during two workshops, one held in Dublin Ireland in July 2014 and the second in conjunction with the International Conference on Urban Climate in Toulouse; a third workshop is set to take place in Hong Kong in December 2015. More information can be found on the WUDAPT website at: http://www.wudapt.org.
References
Bechtel, B., Alexander, P., Böhner, J., Ching, J., Conrad, O., Feddema, J., Mills, G., See, L. and Stewart, I. 2015. Mapping local climate zones for a worldwide database of form and function of cities. International Journal of Geographic Information, 4(1), 199-219.
Hoag, H. 2015. How cities can beat the heat. Nature, 524, 402-404.
See, L., Mills, G. and Ching. J. 2015. Community initiative counters urban heat. Nature, 526,43 (01 October 2015) doi:10.1038/526043b
Stewart, I.D. and Oke, T.R. 2012. Local Climate Zones for urban temperature studies. Bulletin of the American Meteorological Society, 93(12), 1879-1900.
Wake, B. 2012. Defining local zones. Nature Climate Change, 2, 487.
Note: This article gives the views of the author, and not the position of the Nexus blog, nor of the International Institute for Applied Systems Analysis.
Oct 13, 2014 | Citizen Science, Environment
By Linda See and Ian McCallum, IIASA Ecosystems Services and Management Program, Earth Observation Team
Land cover is of fundamental importance for environmental research. It serves as critical baseline information for many large-scale models, for example in developing future scenarios of land use and climate change. However, current land cover products are not accurate enough for many applications and to improve them we need better and more accessible validation data. We recently argued this point in a Nature correspondence, and here we take the opportunity to expand on our brief letter.
In the last decade, multiple global land cover data products have been developed. But when these products are compared, there are significant amounts of spatial disagreement across land cover types. Where one map shows cropland, another might show forest domains. These discrepancies persist even when you take differences in the legend definitions into account. The reasons for this disagreement include the use of different satellite sensors, different classification methodologies, and the lack of sufficient data from the ground, which are needed to train, calibrate, and validate land cover maps.

An artist’s illustration of the NASA Landsat Data Continuity Mission spacecraft, one of the many satellites that collects data about Earth’s surface. Credit: NASA/GSFC/Landsat
A recent Comment in Nature (Nature, 513, 30-31; 2014) argued that freely available satellite imagery will improve science and environmental-monitoring products. Although we fully agree that greater open access and sharing of satellite imagery is urgently needed, we believe that this plea neglects a crucial component of land cover generation: the data required to calibrate and validate these products.
At present, remotely sensed global land cover is not accurate enough for monitoring biodiversity loss and ecosystem dynamics or for many of the other applications for which baseline land cover and change over time are critical inputs. When Sentinel-2–a new Earth observation satellite to be launched in 2015 by the European Space Agency–comes online, it will be possible to produce land cover maps at a resolution of 10 meters. Although this has incredible potential for society as a whole, these products will only be useful if they represent the land cover more accurately than the current products available. To improve accuracy, more calibration and validation data are required. Although more investment is clearly needed in ground-based measurements, there are other, complementary solutions to this problem.

Map showing cropland disagreement between two different land cover maps, GlobCover and GLC2000: all colors represent disagreement. Credit: Geo-Wiki.org, Google Earth
Not only should governments and research institutes be urged to share imagery, they should also share their calibration and validation data. Some efforts have been made by the Global Observation for Forest Cover and Land Dynamics (GOFC-GOLD) in this direction, but there is an incredible amount of data that remains locked within institutes and agencies. The atmospheric community shares their data much more readily than the Earth Observation (EO) community, even though we would only benefit by doing so.
Crowdsourcing of calibration and validation data also has real potential for vastly increasing the amount of data available to improve classification algorithms and the accuracy of land cover products. The IIASA Geo-Wiki project is one example of a growing community of crowdsourcing applications that aim to improve the mapping of the Earth’s surface.

New apps developed by IIASA’s Earth Observation Team aim to involve people around the world in on-the-ground data validation efforts.
Geo-Wiki is a platform which provides citizens with the means to engage in environmental monitoring of the earth by providing feedback on existing spatial information overlaid on satellite imagery or by contributing entirely new data. Data can be input via the traditional desktop platform or mobile devices, with campaigns and games used to incentivize input. Resulting data are available without restriction.
Another major research projects we are using to address many of these issues identified above is the ERC Project Crowdland .
More information
Note: This article gives the views of the authors, and not the position of the Nexus blog, nor of the International Institute for Applied Systems Analysis.
Nov 20, 2013 | Citizen Science, Environment, Food & Water
By Linda See, Research Scholar, IIASA Ecosystems Services and Management Program

Researchers estimate we spend 3 billion hours a week on game playing. CC Image courtesy TheErin on Flickr
On a recent rush hour train ride in London I looked around to see just about everybody absorbed in their mobile phone or tablet. This in itself is not that unusual. But when I snooped over a few shoulders, what really surprised me was that most of those people were playing games. I hope this bodes well for our new game, Cropland Capture, introduced last week.
Cropland Capture is a game version of our citizen science project Geo-Wiki, which has a growing network of interested experts and volunteers who regularly help us in validating land cover through our competitions. By turning the idea into a game, we hope to reach a much wider audience.
Playing Cropland Capture is simple: look at a satellite image and tell us if you see any evidence of cropland. This will help us build a better map of where cropland is globally, something that is surprisingly uncertain at the moment. This sort of data is crucial for global food security, identifying where the big gaps in crop yields are, and monitoring crops affected by droughts, amongst many other applications.
Gamification and citizen science
The idea of Cropland Capture is not entirely unique. There are an astonishingly large number of games available for high tech gaming consoles, PCs and increasingly, mobile devices. While the majority of these games are pure entertainment, some are part of an emerging genre known as ”serious games” or ”games with a purpose.” These are games that either have an educational element or through the process of playing them, you can help scientists in doing their research. One of the most successful examples is the game FoldIt, where teams of players work together to decode protein structures. This is not an easy task for a computer to do, but some people are exceptionally talented at seeing these patterns. The result has even led to new scientific discoveries that have been published in high level journals such as Nature.
Jane McGonigal, in her book Reality is Broken (Why Games Make us Better and How They Can Change the World), estimates that we spend 3 billion hours a week alone on game playing, and that the average young person spends more time gaming by the end of their school career than they have actually spent in school. Although these figures may seem alarming, McGonigal argues that there are many positive benefits associated with gaming, including the development of problem-solving skills, the ability to cope better with problems such as depression or chronic pain, and even the possibility that we might live ten years longer if we played games. If people spent just a fraction of this time on “serious games” like FoldIt and Cropland Capture, imagine how much could be achieved.
Since the game started last Friday, 185 players have validated 119,777 square kilometers of land (more than twice the land area of Denmark).

Cropland Capture is easy to play – simply swipe the picture left or right to say whether there is cropland or not.
Get in the game
You can play Cropland Capture on a tablet (iPad or Android) or mobile phone (iPhone or Android). Download the game from the Apple’s App Store or the Google Play Store. For those who prefer an online version, you can also play the game at: http://www.geo-wiki.org/games/croplandcapture/. For more information about the game, check out our videos at: http://www.geo-wiki.org/games/instructions-videos/. During the next six months, we will be providing regular updates on Twitter (@CropCapture) and Facebook.
The game is being played for six months, where the top scorer each week will be crowned the weekly winner. The 25 weekly winners will then be entered into a draw at the end of the competition to win three big prizes: an Amazon Kindle, a smartphone, and a tablet. The game was launched only last week so there is plenty of time to get involved and help scientific research.
00


You must be logged in to post a comment.