Sep 23, 2019 | Ecosystems, Environment, Sustainable Development
By Frank Sperling, Senior Project Manager (FABLE) in the IIASA Ecosystems Services and Management Program
Food and land use systems play a critical role in managing climate risks and bringing the world onto a sustainable development trajectory.
The UN Secretary General’s Climate Action Summit in New York on 23 September seeks to catalyze further momentum for climate change mitigation and adaptation. The transformation of the food and land use system will play a critical role in managing climate risks and bringing the world onto a sustainable development trajectory.
Today’s food and land use systems are confronted with a great variety of challenges. This includes delivering on universal food security and better diets by 2030. Over the last decades, great strides have been made towards achieving universal food security, but this progress recently grinded to a halt. The number of people suffering from chronic hunger has been rising again from below 800 million in 2015 to over 820 million people today [1]. Food security is however not only about a sufficient supply of calories per person. It is also about improving diets, addressing the worldwide increase in the prevalence of obesity, and how we use and value environmental goods and services.
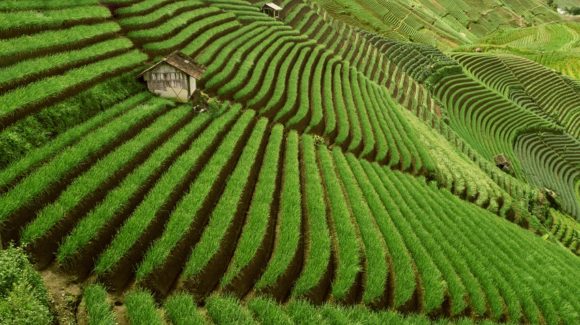
© Paulus Rusyanto | Dreamstime.com
Agriculture, forestry and other land use currently account for around 24% of greenhouse gas emissions caused by human activities [2]. Land use changes are also a major driver behind the worldwide loss of biodiversity [3]. Clearly, in light of population growth and the increasingly visible fingerprints of a human-induced global climate crisis and other environmental changes, business as usual is not an option.
Systems thinking is key in shifting towards more sustainable practices. A new report released by the Food and Land-Use System (FOLU) Coalition showcases that there is much to be gained. There are massive hidden costs in our current food and land use systems. The report outlines ten critical transitions, which can substantially reduce these hidden costs, thereby generating an economic prize, while improving human and planetary health.
The International Institute for Applied Systems Analysis (IIASA) contributed to the analytics underpinning the report [4], applying the Global Biosphere Management Model (GLOBIOM) [5]. A “better futures” scenario, which seeks to collectively address development and environmental objectives, was compared to a “current trends” scenario, which is basically a continuation of a business-as-usual scenario. The assessment illustrates that an integrated approach that acknowledges the interactions in the food and land use space, can help identify synergies and manage trade-offs across sectors. For example, shifting towards healthy diets not only improves human health, but also reduces pressure on land, thereby helping to improve the solution space for addressing climate change and halting biodiversity loss.
While understanding that the global picture is important, practical solutions require engagement with national and subnational governments. The challenge is to identify development pathways that address the development needs and aspirations of countries within global sustainability contexts. As part of FOLU, the Food, Agriculture, Biodiversity, Land and Energy (FABLE) Consortium was initiated to do exactly this. The FABLE Secretariat, jointly hosted by the Sustainable Development Solutions Network (SDSN) and IIASA, is working with knowledge institutions from developed and developing countries, to explore the interactions between national and global level objectives and their implications for pathways towards sustainable food and land use systems. Preliminary results from inter-active scenario and development planning exercises, so-called Scenathons, were recently presented in the FABLE 2019 report.
These initiatives highlight that acknowledging and embracing complexity can help reconcile development and environmental interests. This also entails rethinking how we relate to and manage nature’s services and their role in providing the foundation for the welfare of current and future generations. This is underscored by the prominent role nature-based solutions are given at the UN Secretary General’s Climate Action Summit. We need to move from silo-based, sector specific, single objective approaches to a focus on multiple objective solutions. In the land use space, this means embedding agriculture in the broader land use context, which accounts for and values environmental services, and linking to the food system where dietary choices shape human health and the demand for land.
Doing so will help bridge the international policy objectives of the UN Framework Convention on Climate Change (UNFCCC), the UN Convention on Combating Desertification (UNCCD), the Convention on Biological Diversity (CBD), and the Sustainable Development Goals (SDGs) enshrined in ‘The 2030 Agenda for Sustainable Development’. This represents an opportunity to create a new value proposition for agriculture and other land use activities where environmental stewardship is rewarded.
References
[1] Food and Agriculture Organization (FAO) et al. (2019). The State of Food Security and Nutrition in the World 2019. Safeguarding against economic slowdowns and downturns. Rome, FAO.
[2] Intergovernmental Panel on Climate Change (IPCC) (2019). Climate Change and Land. IPCC Special Report on climate change, desertification, land degradation, sustainable land management, food security, and greenhouse gas fluxes in terrestrial ecosystems. Intergovernmental Panel on Climate Change (IPCC).
[3] Intergovernmental Science-Policy Platform on Biodiversity and Ecosystem Services (IPBES) (2018). The IPBES assessment report on land degradation and restoration. Montanarella, L., Scholes, R., and Brainich, A. (eds.). Secretariat of the Intergovernmental Science-Policy Platform on Biodiversity and Ecosystem Services, Bonn, Germany. 744 pages.
[4] Deppermann, A. et al. 2019. Towards sustainable food and land-use systems: Insights from integrated scenarios of the Global Biosphere Management Model (GLOBIOM). Supplemental Paper to The 2019 Global Consultation Report of the Food and Land Use Coalition Growing Better: Ten Critical Transitions to Transform Food and Land Use. Laxenburg, IIASA.
[5] Havlik P, Valin H, Herrero M, Obersteiner M, Schmid E, Rufino MC, Mosnier A, Thornton PK, et al. (2014). Climate change mitigation through livestock system transitions. Proceedings of the National Academy of Sciences 111 (10): 3709-3714. DOI: 1073/pnas.1308044111 [pure.iiasa.ac.at/10970].
Note: This article gives the views of the author, and not the position of the Nexus blog, nor of the International Institute for Applied Systems Analysis.
Jul 3, 2017 | Data and Methods, Food
By Victor Maus, IIASA Ecosystems Services and Management Program
Nowadays, satellite images are an abundant supply of data which we can use to get information about our planet and its changes. Satellite images can, for example, help us detect an approaching storm, measure the expansion of a city, identify deforested areas, or estimate how crop areas change over time. Usually, we are interested in extracting information from large areas, for example, deforestation in the Amazon Rainforest (5.5 million km², around 15 times the area of Germany). It would be challenging for us to monitor and map such vast areas without combining satellite images with automated and semi-automated computer programs.

Aerial view of the Amazon Rainforest, near Manaus, Brazil. Monitoring deforestation in the Amazon is difficult because the area is massive and remote. ©Neil Palmer | CIAT
To address this problem, I developed — along with my colleagues Gilberto Camara from the Brazilian National Institute for Space Research and Marius Appel and Edzer Pebesma from the University of Münster, Germany — a new open source software to extract information about land-cover changes from satellite images. The tool maps different crop types (e.g., soybean, maize, and wheat), forests, and grassland, and can be used to support land-use monitoring and planning.
Our software, called dtwSat, is open-source and can be freely installed and used for academic and commercial purposes. It builds upon on other graphical and statistical open-source extensions of the statistical program R. Adding to that, our article in press in Journal of Statistical Software is completely reproducible and provides a step-by-step example of how to use the tool to produce land-cover maps. Given that we have public access to an extensive amount satellite images, we also get much benefit from tools that are openly available, reproducible, and comparable. These, in particular, can contribute to rapid scientific development.
The software dtwSat is based on a method widely used for speech recognition called Dynamic Time Warping (DTW). Instead of spoken words, we adapted DTW to identify ‘phenological cycles’ of the vegetation. These encompass the plants’ life cycle events, such as how deciduous trees lose their leaves in the fall. The software compares a set of phenological cycles of the vegetation measured from satellite images (just like a dictionary of spoken words) with all pixels in successive satellite images, taken at different times. After comparing the satellite time series with all phenological cycles in the dictionary, dtwSat builds a sequence of the land-cover maps according to similarity to the phenological cycles.
The series of maps produced by dtwSat allows for land-cover change monitoring and can help answer questions such as how much of the Amazon rainforest has been replaced with soy or grass for cattle grazing during the last decade? It could also help study the effects of policies and international agreements, such Brazil’s Soy Moratorium, where soybean traders agreed not to buy soy from areas deforested after 2006 in the Brazilian Amazon. If soy farming cannot expand over areas deforested after 2006, it might expand to areas formerly used for cattle grazing deforested before 2006, and force the cattle grazing farmers to open new areas that have been cleared more recently. Therefore, besides monitoring changes, the land-cover information can help better understand direct and indirect drivers of deforestation and support new land-use policy.
Further info: dtwSat is distributed under the GPL (≥2) license. The software is available from the IIASA repository PURE pure.iiasa.ac.at/14514/. Precompiled binary available from CRAN at cran.r-project.org/web/packages/dtwSat/index.html
dtwSat development version available from GitHub at github.com/vwmaus/dtwSat
Reference:
Maus V, Camara G, Appel M, & Pebesma E (2017). dtwSat: Time-Weighted Dynamic Time Warping for Satellite Image Time Series Analysis in R. Journal of Statistical Software (In Press).
Maus, V, Camara, G, Cartaxo, R, Sanchez, A, Ramos, FM, & de Queiroz, GR (2016). A Time-Weighted Dynamic Time Warping Method for Land-Use and Land-Cover Mapping. IEEE Journal of Selected Topics in Applied Earth Observations and Remote Sensing 9 (8): 3729–39.
This article gives the views of the author, and not the position of the Nexus blog, nor of the International Institute for Applied Systems Analysis.
Aug 21, 2013 | Citizen Science
By Linda See, Research Scholar, IIASA Ecosystems Services and Management Program
Humans have a long history of map-making that can be traced back to cave paintings older than 20,000 years, and detailed maps made by the ancient Romans, Greeks, and Chinese. These maps tell the story of exploration and changing borders of states, countries, and populations.

This screenshot shows our Geo-Wiki tool for collecting data from the crowd.
Until recently, military and government mapping agencies have been entirely in control of mapping, but this is changing. The rise of neogeography and user-generated geo-referenced content online has led to a new generation of community-based maps such as OpenStreetMap. Enabled by interactive web technology (Web 2.0) and the GPS in mobile phones, people are now mapping different aspects of the Earth’s surface through crowdsourcing. This new model has proved its worth in cases like the post-disaster recovery, e.g. the devastating earthquake in Haiti.
The trouble with maps
Even in this age of satellites and space technology, it is far from easy to generate good automated representations of the Earth’s surface. While satellite imagery has allowed us to create global maps of land cover—the various materials such as grass, trees, water, and cities that cover the Earth’s surface—at various resolutions from 10 km to 30 m, there are two main problems with all the different products that are now currently available. The first is that these products have accuracies that are only between 65 to 75%. Secondly, when they are compared with one another, there are large spatial disagreements between them. If you are a user of these products, which one should you choose? How can you trust any one of these products when they have uncertainties as large as 25 to 35%? And more importantly, without good baseline information about the Earth’s land cover, such as the amount of forest or cropland, how can we possibly predict what will happen in the future?
The Geo-Wiki Project
Our Geo-Wiki project aims to solve this problem through crowdsourcing. With open access to satellite imagery through Google Earth and Bing Maps, citizens and interested experts can help us better characterize land cover, to correct existing land cover maps or build new ones. Geo-Wiki is a simple set of tools to sample the Earth’s surface, which allows a network of Geo-Wiki volunteers to tell us what type of land cover is visible from Google Earth or Bing Maps.

This map of cropland in Ethiopia was created from crowd-sourced data.
One example of our crowd-sourcing campaigns was focused on mapping cropland in Ethiopia. Over a three week period, we collected more than 80,000 samples across the country, roughly 5% of the area of Ethiopia. Using simple interpolation, we have demonstrated that a cropland map of Ethiopia, a key type of land cover, can be created very easily, with just a small crowd of volunteers. We validated the map using an official validation data set from the GOFC/GOLD reference portal as well as other crowdsourced data collected through Geo-Wiki. The results of this study showed that the map is considerably more accurate than global land cover maps for Ethiopia when considering only cropland. You can find more details about this research at:
See, L. McCallum, I., Fritz, S., Perger, C., Kraxner, F., Obersteiner, M., Deka Baruah, U., Mili, N. and Ram Kalita, N. 2013. Mapping Cropland in Ethiopia using Crowdsourcing. International Journal of Geosciences, 4(6A1), 6-13 http://dx.doi.org/10.4236/ijg.2013.46A1002.
Get involved
The Ethiopian example is just the tip of the mapping iceberg. As more citizens get involved in mapping land cover online—for example with our Geo-Wiki Pictures app, we could revolutionize land cover mapping in the future.
If you are interested in helping us improve land cover, register at http://www.geo-wiki.org or find us on Facebook to join our crowdsourcing network and learn more about upcoming crowdsourcing campaigns.
Note: This article gives the views of the author, and not the position of the Nexus blog, nor of the International Institute for Applied Systems Analysis.
48.06887716.355499


You must be logged in to post a comment.