Feb 21, 2017 | Citizen Science
By Linda See, IIASA Ecosystems Services and Management Program
One of the biggest questions when it comes to citizen science is the quality of the data. Scientists worry that citizens are not as rigorous in their data collection as professionals might be, which calls into question the reliability of the data. At a meeting this month in Brussels on using citizen science to track invasive species, we grappled with the question: what it will take to trust this data source, particularly if it’s going to be used to alert authorities regarding the presence of an invasive species in a timely manner.
This discussion got me thinking about what other types of data are supplied by citizens that authorities simply trust, for example, when a citizen calls the emergency services to report an incident, such as a fire. Such reports are investigated by the authorities and the veracity of the alert is not questioned. Instead authorities are obliged to investigate such reports.
Yet the statistics show that false alarms do occur. For example, in 2015, there were more than 2.5 million false fire alarms in the United States, of which just under a third were due to system malfunctions. The remaining calls were unintentional, malicious, or other types of false alarms, such as a bomb scare. Statistics for calls to the emergency services more generally show similar trends in different European countries, where the percentage of false reports range from 40% in Latvia up to 75% in Lithuania and Norway. So why is it that we inherently trust this data source, despite the false alarm rate, and not data from citizen scientists? Is it because life is threatened or because fires are easier to spot than invasive species, or simply because emergency services are mandated with the requirement to investigate?
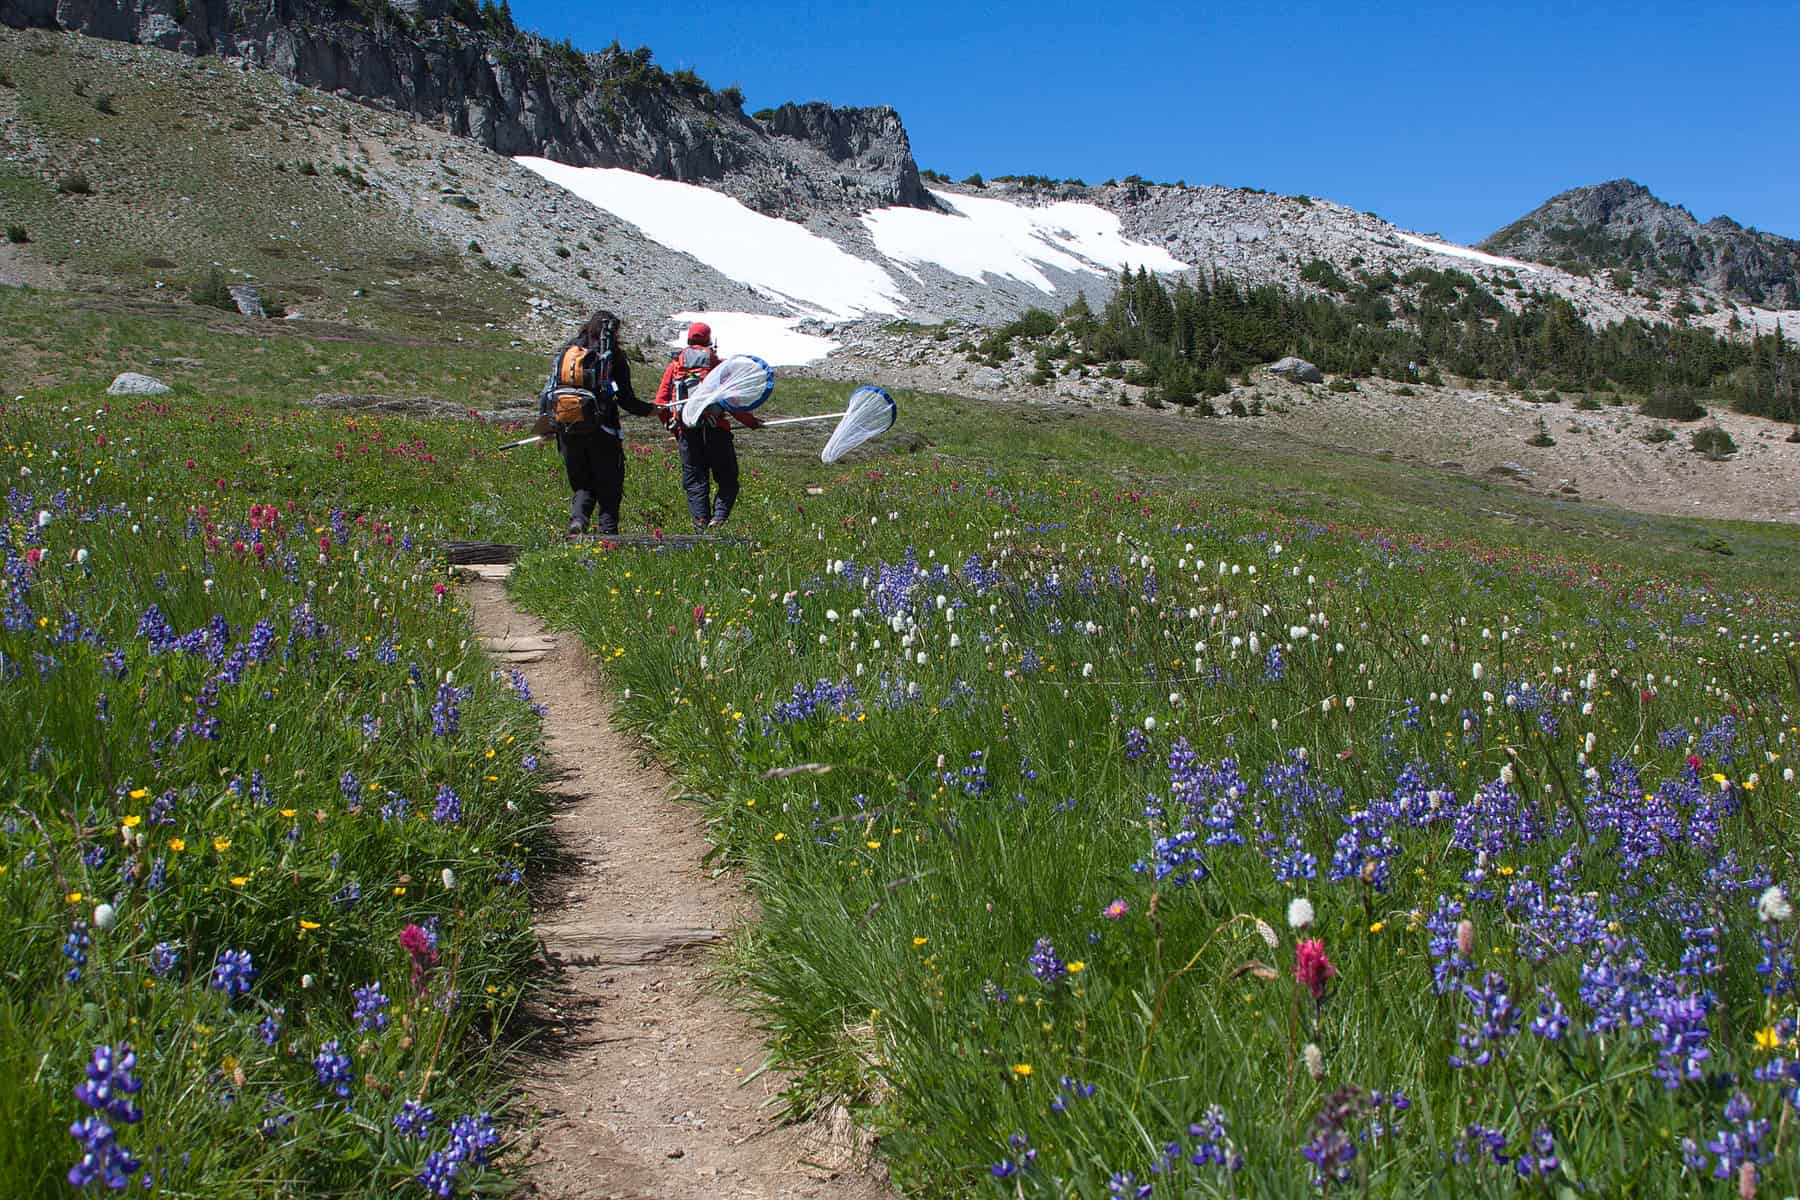
Volunteers monitor butterflies in Mount Rainier National Park, as part of the Cascade Butterfly Project, a citizen science effort organized by the US National Park Service © Kevin Bacher | US National Park Service
A recent encouraging development for citizen science was the signing of an executive order by President Obama on 6 January 2017, which gave federal agencies the jurisdiction to use citizen science and crowdsourced data in their operations. Do we need something similar in the EU or at the level of member states? And what will it really take for authorities to trust scientific data from citizens?
To move from the current situation of general distrust in citizen science data to one in which the data are viewed as a potentially useful source of information, we need further action. First we need to showcase examples of where data collected by citizens are already being used for monitoring. At the meeting in Brussels, Kyle Copas of the Global Biodiversity Information Facility (GBIF) noted that up to 40% of the data records in GBIF are supplied by citizens, which surprised many of the meeting participants. Data from GBIF are used for national and international monitoring of biodiversity. Secondly, we need to quantify the value of information coming from citizen scientists. For example, how much money could have been saved if reports on invasive species from citizens were acted upon? Third, we need to forge partnerships with government agencies to institutionally embed citizen science data streams into everyday operations. For example, the LandSense citizen observatory, a new project, aims to do exactly this. We are working with the National Mapping Agency in France to use citizen science data to update their maps but there are many other similar examples with other local and national agencies that will be tested over the next 3.5 years.
Finally, we need to develop quality assurance systems that can be easily plugged into the infrastructure of existing organizations. The EU-funded COBWEB project began building such a citizen science-based quality assurance system, which we are continuing to develop in LandSense as a service. Providing out-of-the-box tools may be one solution to help organizations to begin working with citizen science data more seriously at an institutional level.
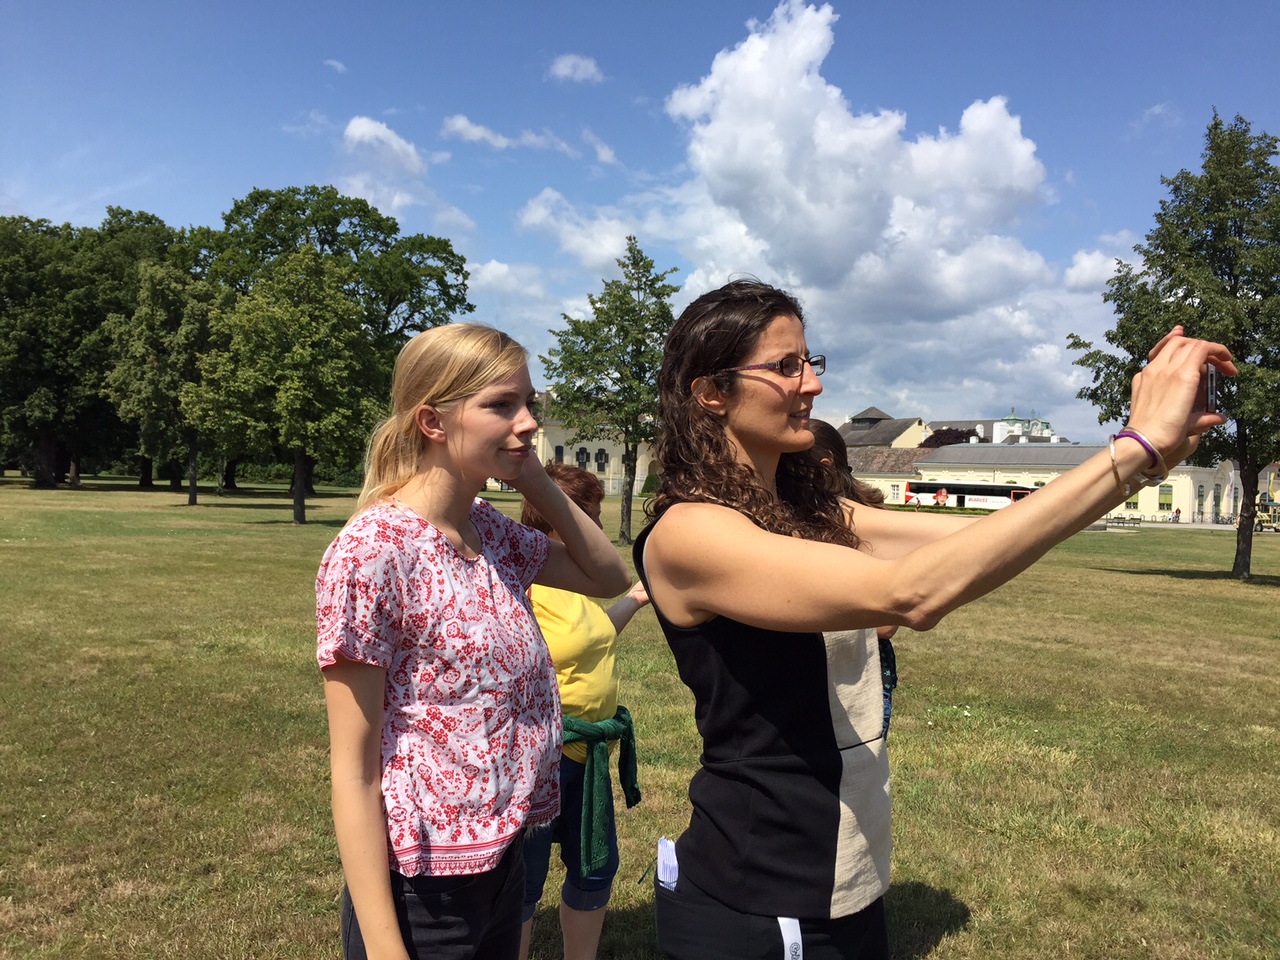
IIASA researchers test the Fotoquest app, a citizen science game developed at IIASA. ©Katherine Leitzell | IIASA
These measures will clearly take time to implement so I don’t expect that the discussion on the quality of the data will be removed from any agenda for some time to come. However, I look forward to the day when the main issue revolves around how we can possibly handle the masses of big data coming from citizens, a situation that many of us would like to be in.
More Information about the meeting: https://ec.europa.eu/jrc/en/event/workshop/citizen-science-open-data-model-invasive-alien-species-europe
This article gives the views of the author, and not the position of the Nexus blog, nor of the International Institute for Applied Systems Analysis.
May 17, 2016 | Citizen Science
By Dilek Fraisl, IIASA Ecosystems Services and Management Program
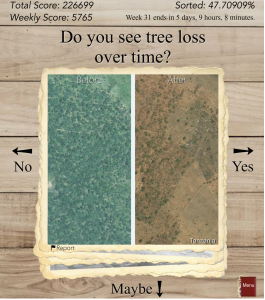
In October 2015, we launched our latest game, Picture Pile. The idea is simple: look at a pair of satellite images from different years and tell us if you can see any evidence of deforestation. Thanks to the participation of many volunteers, 2.69 million pictures have already been sorted in our pile of 5 million pairs. But we still have a long way to go, and we need your help to get us there!
Screenshot from the game: click for more information (Image credit Tobias Sturn)
Deforestation is one of the most serious environmental problems in the world today. Forests cover a third of the land area on Earth, producing vital oxygen, habitats for a diversity of wildlife, and important ecosystem services. According to the World Wildlife Fund (WWF), some 46,000 to 58,000 square miles of forest are lost each year, which is equivalent to 48 football fields every minute. But this is a rough estimate since deforestation is very difficult to track. Reasons why are that satellite imagery can be of insufficient spatial resolution to map deforestation accurately, deforestation mostly occurs in small chunks that may not be visible from medium-resolution imagery, and very high-resolution data sets are expensive and can require big data processing capabilities, so can only be used for limited areas.
To help contribute to better mapping of deforestation, researchers in IIASA’s Earth Observation Systems (EOS) group, led by Steffen Fritz, have been working on novel projects to engage citizens in scientific data collection that can complement satellite-based traditional deforestation monitoring. One of the latest applications is Picture Pile, a game that makes use of very high-resolution satellite images spanning the last decade. Designed by Tobias Sturn, the aim is to provide data that can help researchers build a better map of deforestation. Players are provided with a pair of images that span two time periods and are then asked to answer a simple question: “Do you see tree loss over time?” After examining the image, the player drags the images to the right for “yes,” left for “no,” or down to indicate “maybe” when the deforestation is not clearly visible.
Every image is sorted multiple times by numerous independent players, in order to build confidence in the results, and also to gain an understanding of how good the players are at recognizing visible patterns of deforestation. Once enough data are collected at a single location, the images are taken out of the game and new ones are added, thereby increasing the spatial coverage of our mapped area over time. Right now we are focusing on Tanzania and Indonesia, two regions where we know there are problems with existing maps of deforestation.
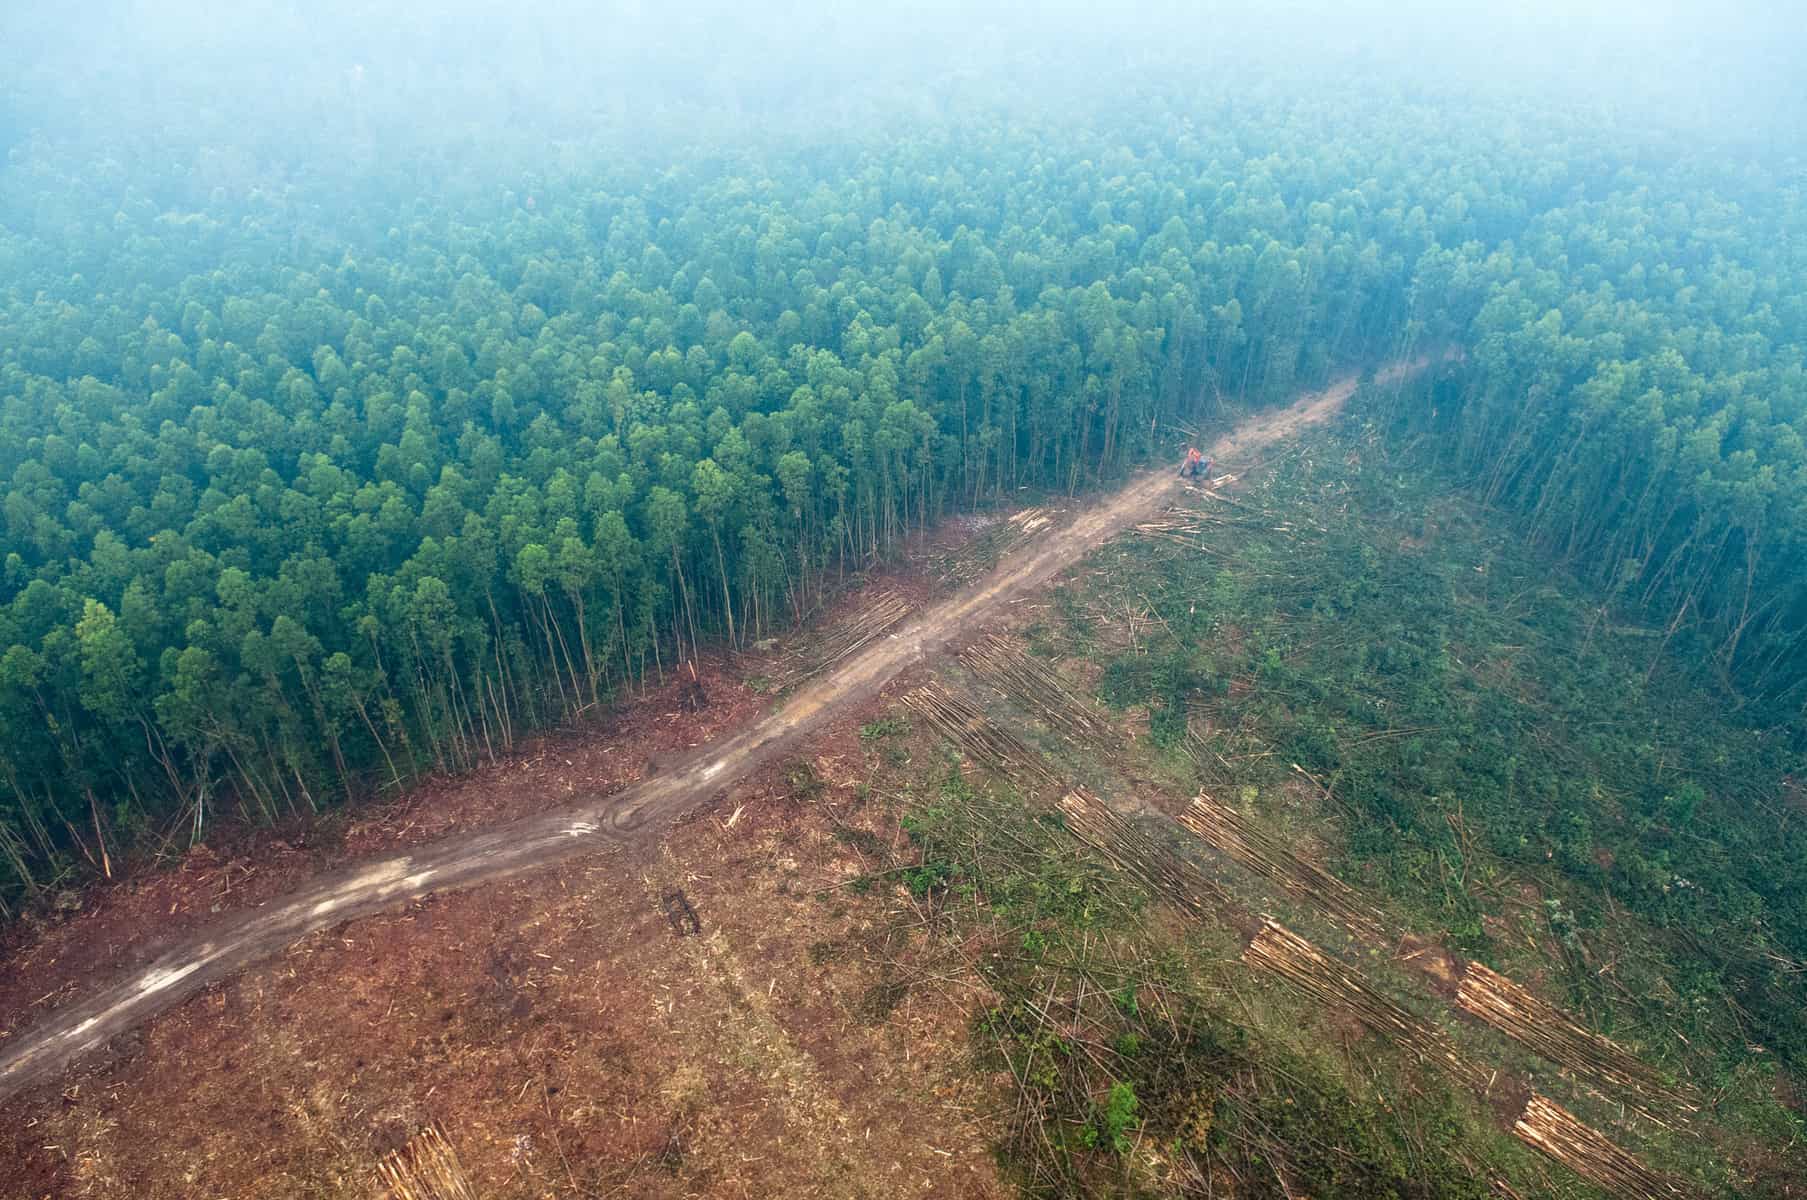
Picture Pile is focusing first on Indonesia (pictured) and Tanzania – two regions where there are problems with existing maps of deforestation. Photo (cc) Aulia Erlangga for Center for International Forestry Research (CIFOR).
Once the pile is fully sorted, the 5 million photos in the data set will be used to develop better maps of forest cover and forest loss using hybrid techniques developed by the group as well as inputs to classification algorithms. We will also use the data to validate the accuracy of existing global land cover maps. Finally, we will mine the data set to look for patterns regarding quality (for example, how many samples do we need to provide to the “crowd” before we can be confident enough to use their data in further research). In short, by integrating citizens in scientific research, Picture Pile will also help us improve the science of land cover monitoring through crowdsourcing mechanisms.
So please join in and help us get to the finish line. You can play Picture Pile in your browser or you can download the free iOS/Android app from the Apple and Google Play stores and play on your smartphone or tablet. Your contributions will help scientists like those at IIASA to tackle global problems such as deforestation and environmental degradation. At the same time you may win some great prizes: a brand new smartphone, a tablet, or a mini tablet.
More information:
Reference
Schepaschenko D, See L, Lesiv M, McCallum I, Fritz S, Salk C, Perger C, Schepaschenko M, Shvidenko A, Kovalevskyi S, Albrecht F, Kraxner F, Bun A, Maksyutov S, Sokolov A, Dürauer M, Obersteiner M. (2015) Global hybrid forest mask: synergy of remote sensing, crowd sourcing and statistics. Remote Sensing of the Environment, 162, 208-220. doi:10.1016/j.rse.2015.02.011
Note: This article gives the views of the author, and not the position of the Nexus blog, nor of the International Institute for Applied Systems Analysis.
Sep 2, 2015 | Systems Analysis
By Matthias Wildemeersch, IIASA Advanced Systems Analysis and Ecosystems Services and Management Programs
FotoQuest Austria is a citizen science campaign initiated by the IIASA Ecosystems Services & Management Program that aims to involve the general public in mapping land use in Austria. Understanding the evolution of urban sprawl is important to estimate the risk of flooding, while the preservation of wetlands has important implications for climate change.
But how can we engage people in environmental monitoring, in particular when they are growing increasingly resistant to traditional forms of advertising? Viral marketing makes use of social networks to spread messages, and takes advantage of the trust that we have in the recommendation coming from a friend rather than from a stranger or a company.
Network science and the formal description of spreading phenomena can shed light on the propagation of messages through communities and can be applied to inform and design viral marketing campaigns.

Viral spreading © kittitee550 | Dollar Photo Club
Network science is a multi-disciplinary field of research that draws on graph theory, statistical mechanics, inference, and other theories to study the behavior of agents in various networks. The spreading phenomena in viral marketing show similarities with well-studied spreading processes over biological, social, physical, and financial networks. For instance, we can think about epidemics,which are well understood and allow for the design of optimal strategies to contain viruses. Another example is opinion dynamics, which received renewed research attention over the last years in the context of social media. In contrast to diseases or computer viruses, which we aim to contain and stop, the goal of viral marketing is to spread widely, reaching the largest possible fraction of a community.
What makes viral marketing unique?
But some aspects of viral marketing are very different from what we see in other spreading phenomena. First of all, there are many platforms that can be used to spread information at the same time, and the interaction between these platforms is not always transparent. Human psychology is a crucial factor in social networks, as repeated interaction and saturation can decrease the willingness to further spread viral content. Marketing campaigns have a limited budget, and therefore it is meaningful to understand how we can use incentives and how efficient they are. This also means that it is essential to find the group of most influential people that can be used as seeds for the viral campaign.
Network science has addressed to a great extent all these individual questions, mostly under the assumption of full knowledge of the connections between the agents and their influence. Currently, so-called multiplexes are an active research field that studies the behavior of multi-layer networks. This research unveils the relationships between the dynamics of viral marketing, the connection pattern, and strength between the network layers. Although viral spreading may be unachievable in a single layer, for example a social network like Facebook, the critical threshold may be exceeded by joining different platforms. Within a given platform, people alike can be clustered using community detection algorithms. Once the communities are identified, influence maximization algorithms have been established to select these persons that maximize the spread of viral content. Although this discrete optimization problem is computationally difficult—or NP-hard—mathematicians have proposed algorithms that can efficiently predict who to target to give a campaign the best chance of going viral. On top of that, optimal pricing strategies have been developed to reward recommenders.

The FotoQuest Austria app aims to engage citizen scientists in their campaign – network theory may help them go “viral.” © IIASA
Although the literature is extensive, the nature of the results is often theoretical and involves mathematically complex models and algorithms. Considering that only partial information on the network is usually available, it is not straightforward to bring this knowledge back to a practical marketing campaign. So researchers in this field are trying to bridge the gap between theoretical results and practical problems. The generic, powerful methods of network science are sufficiently versatile to capture the specifics of real-world applications. As such, network science can provide guidelines that can bring great value for the design of heuristic methods in marketing strategies.
Note: This article gives the views of the author, and not the position of the Nexus blog, nor of the International Institute for Applied Systems Analysis.
Oct 13, 2014 | Citizen Science, Environment
By Linda See and Ian McCallum, IIASA Ecosystems Services and Management Program, Earth Observation Team
Land cover is of fundamental importance for environmental research. It serves as critical baseline information for many large-scale models, for example in developing future scenarios of land use and climate change. However, current land cover products are not accurate enough for many applications and to improve them we need better and more accessible validation data. We recently argued this point in a Nature correspondence, and here we take the opportunity to expand on our brief letter.
In the last decade, multiple global land cover data products have been developed. But when these products are compared, there are significant amounts of spatial disagreement across land cover types. Where one map shows cropland, another might show forest domains. These discrepancies persist even when you take differences in the legend definitions into account. The reasons for this disagreement include the use of different satellite sensors, different classification methodologies, and the lack of sufficient data from the ground, which are needed to train, calibrate, and validate land cover maps.

An artist’s illustration of the NASA Landsat Data Continuity Mission spacecraft, one of the many satellites that collects data about Earth’s surface. Credit: NASA/GSFC/Landsat
A recent Comment in Nature (Nature, 513, 30-31; 2014) argued that freely available satellite imagery will improve science and environmental-monitoring products. Although we fully agree that greater open access and sharing of satellite imagery is urgently needed, we believe that this plea neglects a crucial component of land cover generation: the data required to calibrate and validate these products.
At present, remotely sensed global land cover is not accurate enough for monitoring biodiversity loss and ecosystem dynamics or for many of the other applications for which baseline land cover and change over time are critical inputs. When Sentinel-2–a new Earth observation satellite to be launched in 2015 by the European Space Agency–comes online, it will be possible to produce land cover maps at a resolution of 10 meters. Although this has incredible potential for society as a whole, these products will only be useful if they represent the land cover more accurately than the current products available. To improve accuracy, more calibration and validation data are required. Although more investment is clearly needed in ground-based measurements, there are other, complementary solutions to this problem.

Map showing cropland disagreement between two different land cover maps, GlobCover and GLC2000: all colors represent disagreement. Credit: Geo-Wiki.org, Google Earth
Not only should governments and research institutes be urged to share imagery, they should also share their calibration and validation data. Some efforts have been made by the Global Observation for Forest Cover and Land Dynamics (GOFC-GOLD) in this direction, but there is an incredible amount of data that remains locked within institutes and agencies. The atmospheric community shares their data much more readily than the Earth Observation (EO) community, even though we would only benefit by doing so.
Crowdsourcing of calibration and validation data also has real potential for vastly increasing the amount of data available to improve classification algorithms and the accuracy of land cover products. The IIASA Geo-Wiki project is one example of a growing community of crowdsourcing applications that aim to improve the mapping of the Earth’s surface.

New apps developed by IIASA’s Earth Observation Team aim to involve people around the world in on-the-ground data validation efforts.
Geo-Wiki is a platform which provides citizens with the means to engage in environmental monitoring of the earth by providing feedback on existing spatial information overlaid on satellite imagery or by contributing entirely new data. Data can be input via the traditional desktop platform or mobile devices, with campaigns and games used to incentivize input. Resulting data are available without restriction.
Another major research projects we are using to address many of these issues identified above is the ERC Project Crowdland .
More information
Note: This article gives the views of the authors, and not the position of the Nexus blog, nor of the International Institute for Applied Systems Analysis.
Jan 14, 2014 | Citizen Science, Environment
Steffen Fritz has just been awarded an ERC Consolidator Grant to fund a research project on crowdsourcing and ground data collection on land-use and land cover. In this interview he talks about his plans for the new project, CrowdLand.

Farmers in Kenya are one group which the Crowdland Project aims to involve in their data gathering. Photo credit: Neil Palmer, CIAT
What’s the problem with current land cover data?
There are discrepancies between current land cover products, especially in cropland data. It’s all based on satellite data, and in these data, it is extremely difficult to distinguish between cropland and natural vegetation in certain parts of the world if you do not use so-called very high resolution imagery, similar to a picture you take from space. With this high-resolution data you can see structures like fields and so on, which you can then use to distinguish between natural vegetation and cropland. But this is a task where currently people are still better at than computers–and there is a huge amount of data to look at.
In our Geo-Wiki project and related efforts such as the Cropland Capture game, we have asked volunteers to look at these high-resolution images and classify the ground cover as cropland or not cropland. The efforts have been quite successful, but our new project will take this even further.
How will the new project expand on what you’ve already done in Geo-Wiki?
The big addition is to go on the ground. Most of the exercises we currently do are based on the desktop or the phones, or tablets, asking volunteers to classify imagery that they see on a screen.
What this project aims to do is to improve data you collect on the ground, known as in-situ data. You can use photography, GPS sensors, but also your knowledge you have about what you see. We will use volunteers to collect basic land cover data such as tree cover, cropland, and wetlands, but also much more detailed land-use information. With this type of data we can document what crops are grown where, whether they are irrigated, if the fields are fertilized, what exact type of crops are growing, and other crop management information which you cannot see in satellite imagery. And there are some things you can’t even see when you’re on the ground, thus you need to ask the farmer or recruit the farmer as a data provider. That’s an additional element this project will bring, that we will work closely with farmers and people on the ground.
For the study, you have chosen Austria and Kenya. Why these two countries?
In Austria we have much better in situ data. For example, the Land Use Change Analysis System (LUCAS) in Europe collects in situ data according to a consistent protocol. But this program is very expensive, and the agency that runs it, Eurostat, is discussing how to reduce costs. Additionally the survey is only repeated every three years so fast changes are not immediately recorded. Some countries are not in favor of LUCAS and they prefer to undertake their own surveys. Then however you lose the overall consistency and there is no Europe-wide harmonized database which allows for comparison between countries. Our plan is to use gaming, social incentives, and also small financial incentives to conduct a crowdsourced LUCAS survey. Then we will examine what results you get when you pay volunteers or trained volunteers compared to the data collected by experts.
In Kenya, the idea is similar, but in general in the developing world we have very limited information, and the resources are not there for major surveys like in Europe. In order to remedy that the idea is again to use crowdsourcing and use a “bounded crowd” which means people who have a certain level of expertise, and know about land cover and land use, for example people with a surveyor background, university students, or interested citizens who can be trained. But in developing countries in particular it’s important to use financial incentives. Financial incentives, even small ones, could probably help to collect much larger amounts of data. Kenya is a good choice also because it has quite a good internet connection, a 3G network, and a lot of new technologies evolving around mobile phones and smartphone technology.
What will happen with the data you collect during this project?
First, we will analyze the data in terms of quality. One of our research questions is how good are the data collected by volunteers compared to data collected by experts. Another research question is how can imperfect but large data collected by volunteers be filtered and combined so that it becomes useful and fulfills the scientific accuracy requirements.
Then we will use these data and integrate them into currently existing land use and land cover data, and find ways to make better use of it. For example, in order to make projections about future land-use and to better quantify current yield gaps it is crucial to get accurate current information on land-use, including spatially explicit information on crop types, crop management information and other data.
Once we have done some quality checks we will also make these data available for other researchers or interested groups of people.
Crowdsourcing for land cover is in its infancy. There have been lots of crowdsourcing projects in astronomy, archaeology, and biology, for example, but there hasn’t been much on land use, and there is huge potential there. ”We need to not only better understand the quality of the data we collect, but also expand the network of institutions who are working on this topic.”
Note: This article gives the views of the interviewee, and not the position of the Nexus blog, nor of the International Institute for Applied Systems Analysis.
00


You must be logged in to post a comment.