May 29, 2017 | Citizen Science, Risk and resilience
By Wei Liu, IIASA Risk and Resilience Program
What do Rajapur, Nepal; Chosica, Peru; and Tabasco, Mexico all have in common? Flooding: these areas are all threatened by floods, and they also face similar knowledge gaps, especially in terms of local level spatial information on risk, and the resources and the capacities of communities to manage risk.
To address these gaps, I and my colleagues at IIASA, in collaboration with Kathmandu Living Labs (KLL) and Practical Action (PA) Nepal are building on our experiences in Nepal’s Lower Karnali River basin to support flood risk mapping in flood-prone areas in Peru and Mexico.
Recent developments in data collection and communication via personal devices and social media have greatly enhanced citizens’ abilities to contribute spatial data, called Crowdsourced Geographic Information (CGI) in the mapping community. OpenStreetMap is the most widely used platform for sharing this free geographic data globally, and the fast growing Humanitarian OpenStreetMap Team has developed CGI in some of the world’s most disaster-prone and data-scarce regions. For example, after the 2015 Nepal Earthquake, thousands of global volunteers mapped infrastructure across Nepal, greatly supporting earthquake rescue, recovery, and reconstruction efforts.
Today there is excellent potential to engage citizen mappers in all stages of the disaster risk management cycle, including risk prevention and reduction, preparedness and reconstruction. In this project, we have successfully launched a series of such mapping activities for the Lower Karnali River basin in Nepal starting in early 2016. In an effort to share the experience and lessons of this work with other Zurich Global Flood Resilience Alliance field sites, in March 2017 we initiated two new mapathons in Kathmandu, with support from Soluciones Prácticas (PA Peru) and the Mexican Red Cross, to remotely map basic infrastructure such as buildings and roads, as well as visible water surface, around flood-prone communities in Chosica, Peru and Tobasco, Mexico.
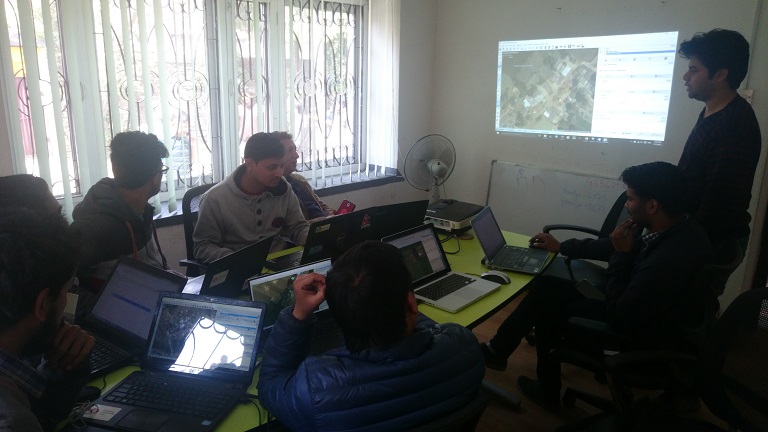
March 17th, 2017, staff and volunteers conducting remote mapping at Kathmandu Living Labs @ Wei Liu | IIASA
Prior to our efforts very few buildings in these areas were identified on online map portals, including Google Maps, Bing Maps, and OSM. Through our mapathons, dozens of Nepalese volunteers mapped over 15,000 buildings and 100 km of roads. The top scorer, Bishal Bhandari, mapped over 1,700 buildings and 6 km of roads for Chosica alone.
Having the basic infrastructure mapped before a flood event can be extremely valuable for increasing flood preparedness of communities and for local authorities and NGOs. During the period of the mapathons, the Lima region in Peru, including Chosica, was hit by a severe flood induced by coastal El Niño conditions. Having almost all buildings in Chosica mapped on the OSM platform now makes visible the high flood risk faced by people living in this densely populated area with both formal and informal settlements. These data may support conducting a quick damage assessment, as suggested by Miguel Arestegui, a collaborator from PA Peru during his visit to IIASA in April, 2017.
Recognizing the value of crowdsourced spatial risk information, we are working closely with partners, including OpenStreetMap Peru, to mobilize the creativity, technical know-how, and practical experience from the Nepal study to Latin America countries. Collecting such information using CGI comes with low cost but high potential for modeling and estimating the amount of people and economic assets potentially being affected under different future flood situations, for improving development and land-use plans to support disaster risk reduction, and for increasing preparedness and helping with allocating humanitarian support in a timely manner after disaster events.
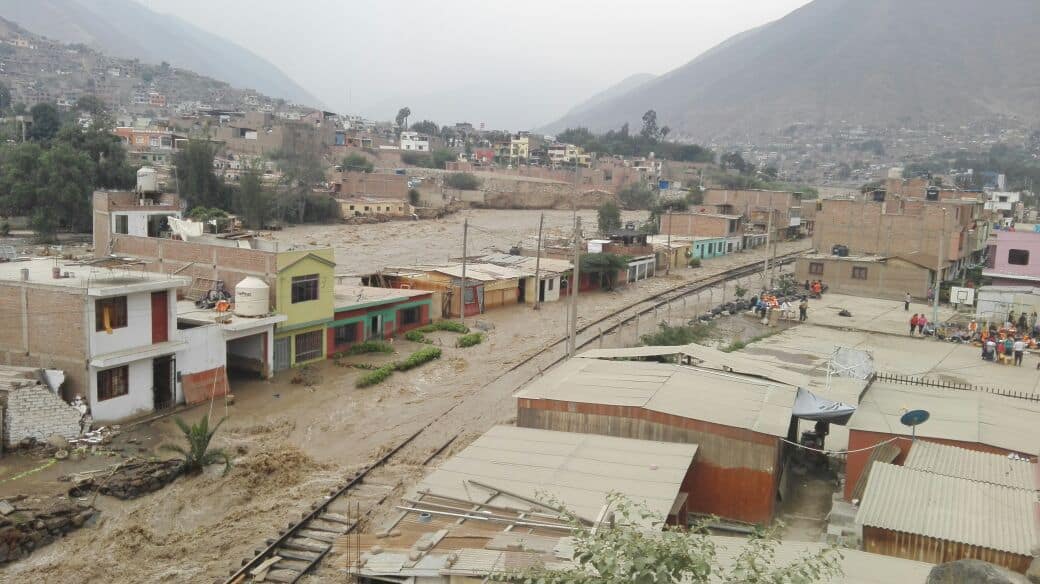
Flood-inundated houses and local railway in Chosica, Peru, 18/03/2017 @ Miluska Ordoñez | Soluciones Prácticas
The United Nation’s Sendai Framework for Disaster Risk Reduction states that knowledge in “all dimensions of vulnerability, capacity, exposure of persons and assets, hazard characteristics and the environment” needs to be leveraged to inform policies and practices across all stages of the disaster risk management cycle. CGI has a great potential to involve citizens from around the world to help fill this critical knowledge gap. These pilot mapathons conducted between Nepal and Latin America are promising examples of supporting community flood resilience through the mobilization of CGI via international partnerships within the Global South.
This article gives the views of the author, and not the position of the Nexus blog, nor of the International Institute for Applied Systems Analysis.
Feb 21, 2017 | Citizen Science
By Linda See, IIASA Ecosystems Services and Management Program
One of the biggest questions when it comes to citizen science is the quality of the data. Scientists worry that citizens are not as rigorous in their data collection as professionals might be, which calls into question the reliability of the data. At a meeting this month in Brussels on using citizen science to track invasive species, we grappled with the question: what it will take to trust this data source, particularly if it’s going to be used to alert authorities regarding the presence of an invasive species in a timely manner.
This discussion got me thinking about what other types of data are supplied by citizens that authorities simply trust, for example, when a citizen calls the emergency services to report an incident, such as a fire. Such reports are investigated by the authorities and the veracity of the alert is not questioned. Instead authorities are obliged to investigate such reports.
Yet the statistics show that false alarms do occur. For example, in 2015, there were more than 2.5 million false fire alarms in the United States, of which just under a third were due to system malfunctions. The remaining calls were unintentional, malicious, or other types of false alarms, such as a bomb scare. Statistics for calls to the emergency services more generally show similar trends in different European countries, where the percentage of false reports range from 40% in Latvia up to 75% in Lithuania and Norway. So why is it that we inherently trust this data source, despite the false alarm rate, and not data from citizen scientists? Is it because life is threatened or because fires are easier to spot than invasive species, or simply because emergency services are mandated with the requirement to investigate?
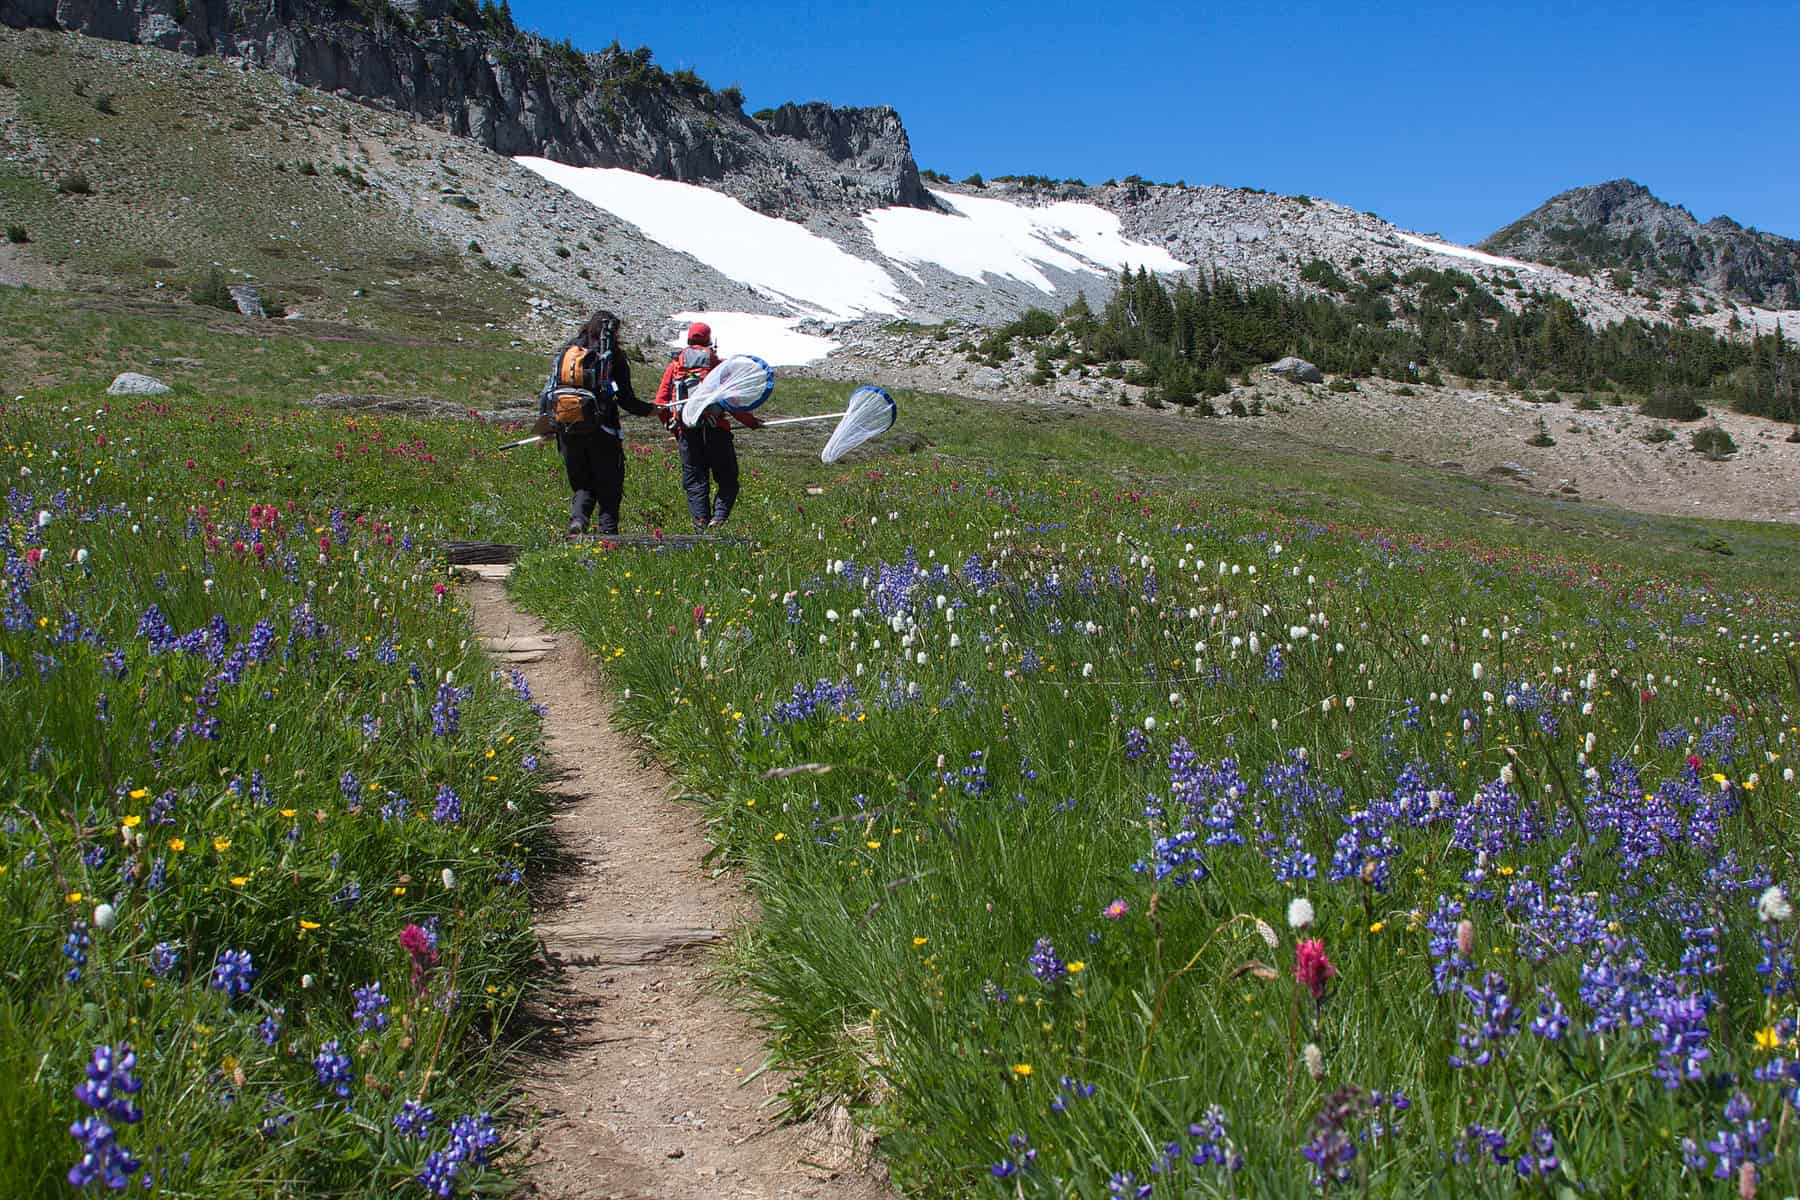
Volunteers monitor butterflies in Mount Rainier National Park, as part of the Cascade Butterfly Project, a citizen science effort organized by the US National Park Service © Kevin Bacher | US National Park Service
A recent encouraging development for citizen science was the signing of an executive order by President Obama on 6 January 2017, which gave federal agencies the jurisdiction to use citizen science and crowdsourced data in their operations. Do we need something similar in the EU or at the level of member states? And what will it really take for authorities to trust scientific data from citizens?
To move from the current situation of general distrust in citizen science data to one in which the data are viewed as a potentially useful source of information, we need further action. First we need to showcase examples of where data collected by citizens are already being used for monitoring. At the meeting in Brussels, Kyle Copas of the Global Biodiversity Information Facility (GBIF) noted that up to 40% of the data records in GBIF are supplied by citizens, which surprised many of the meeting participants. Data from GBIF are used for national and international monitoring of biodiversity. Secondly, we need to quantify the value of information coming from citizen scientists. For example, how much money could have been saved if reports on invasive species from citizens were acted upon? Third, we need to forge partnerships with government agencies to institutionally embed citizen science data streams into everyday operations. For example, the LandSense citizen observatory, a new project, aims to do exactly this. We are working with the National Mapping Agency in France to use citizen science data to update their maps but there are many other similar examples with other local and national agencies that will be tested over the next 3.5 years.
Finally, we need to develop quality assurance systems that can be easily plugged into the infrastructure of existing organizations. The EU-funded COBWEB project began building such a citizen science-based quality assurance system, which we are continuing to develop in LandSense as a service. Providing out-of-the-box tools may be one solution to help organizations to begin working with citizen science data more seriously at an institutional level.
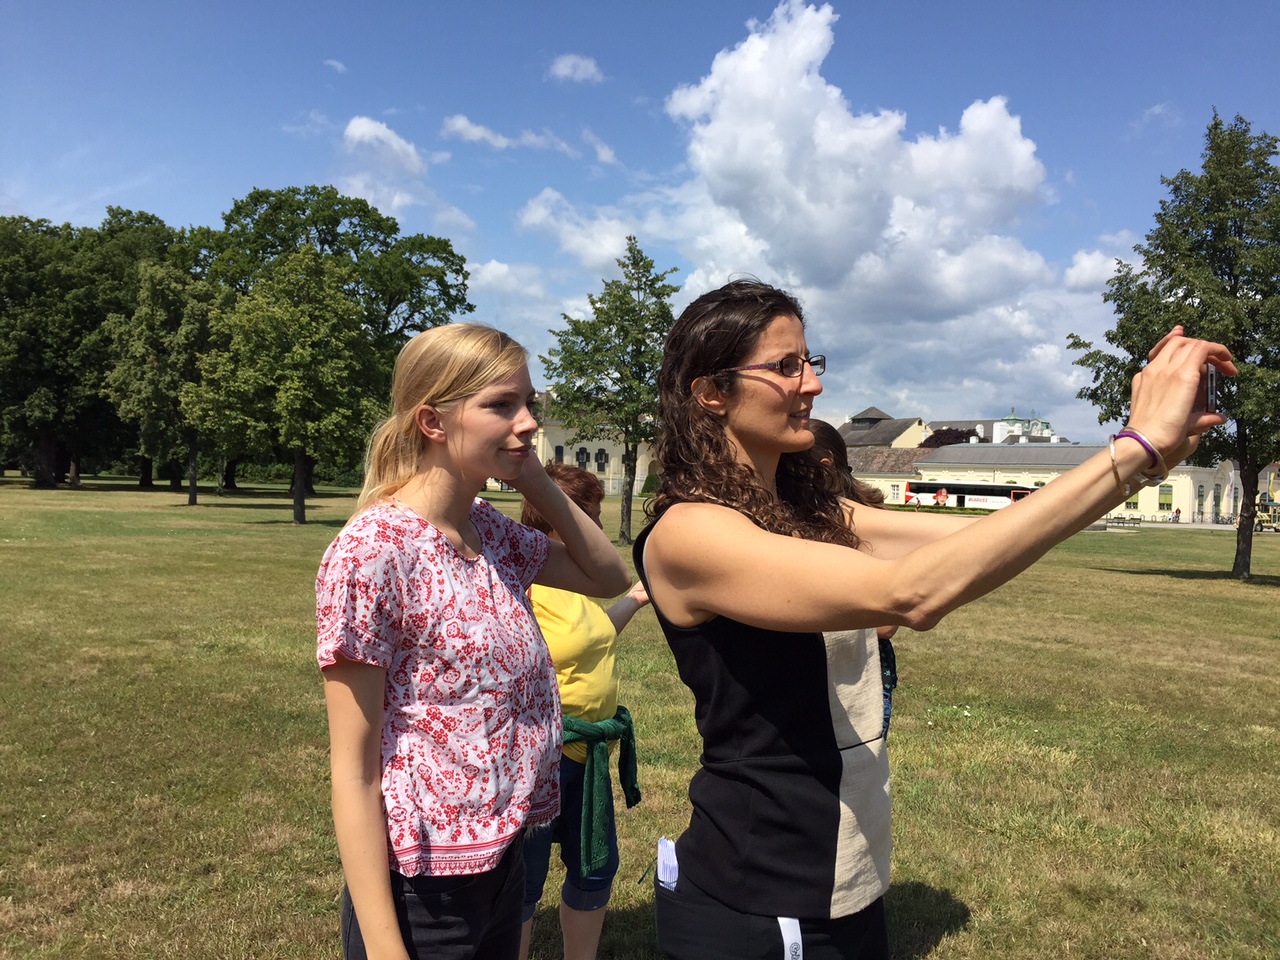
IIASA researchers test the Fotoquest app, a citizen science game developed at IIASA. ©Katherine Leitzell | IIASA
These measures will clearly take time to implement so I don’t expect that the discussion on the quality of the data will be removed from any agenda for some time to come. However, I look forward to the day when the main issue revolves around how we can possibly handle the masses of big data coming from citizens, a situation that many of us would like to be in.
More Information about the meeting: https://ec.europa.eu/jrc/en/event/workshop/citizen-science-open-data-model-invasive-alien-species-europe
This article gives the views of the author, and not the position of the Nexus blog, nor of the International Institute for Applied Systems Analysis.
Jan 12, 2017 | Citizen Science, Risk and resilience
By Ian McCallum, IIASA Ecosystems Services and Management Program
Communities need information to prepare for and respond to floods – to inform risk reduction strategies and strengthen resilience, improve land use planning, and generally prepare for when disaster strikes. But across much of the developing world, data are sparse at best for understanding the dynamics of flood risk. When and if disaster strikes, massive efforts are required in the response phase to develop or update information about basic infrastructure, for example, roads, bridges and buildings. In terms of strengthening community resilience it is important to know about the existence and location of such features as community shelters, medical clinics, drinking water, and more.
The risk Geo-Wiki platform
The Risk Geo-Wiki is online platform established in 2014, which acts not only as a repository of available flood related spatial information, but also provides for two-way information exchange. You can use the platform to view available information about flood risk at any location on the globe, along with geo-tagged photos uploaded by yourself or other users via a mobile application Geo-Wiki Pictures. The portal is intended to be of practical use to community leaders and NGOs, governments, academia, industry and citizens who are interested in better understanding the information available to strengthen flood resilience.
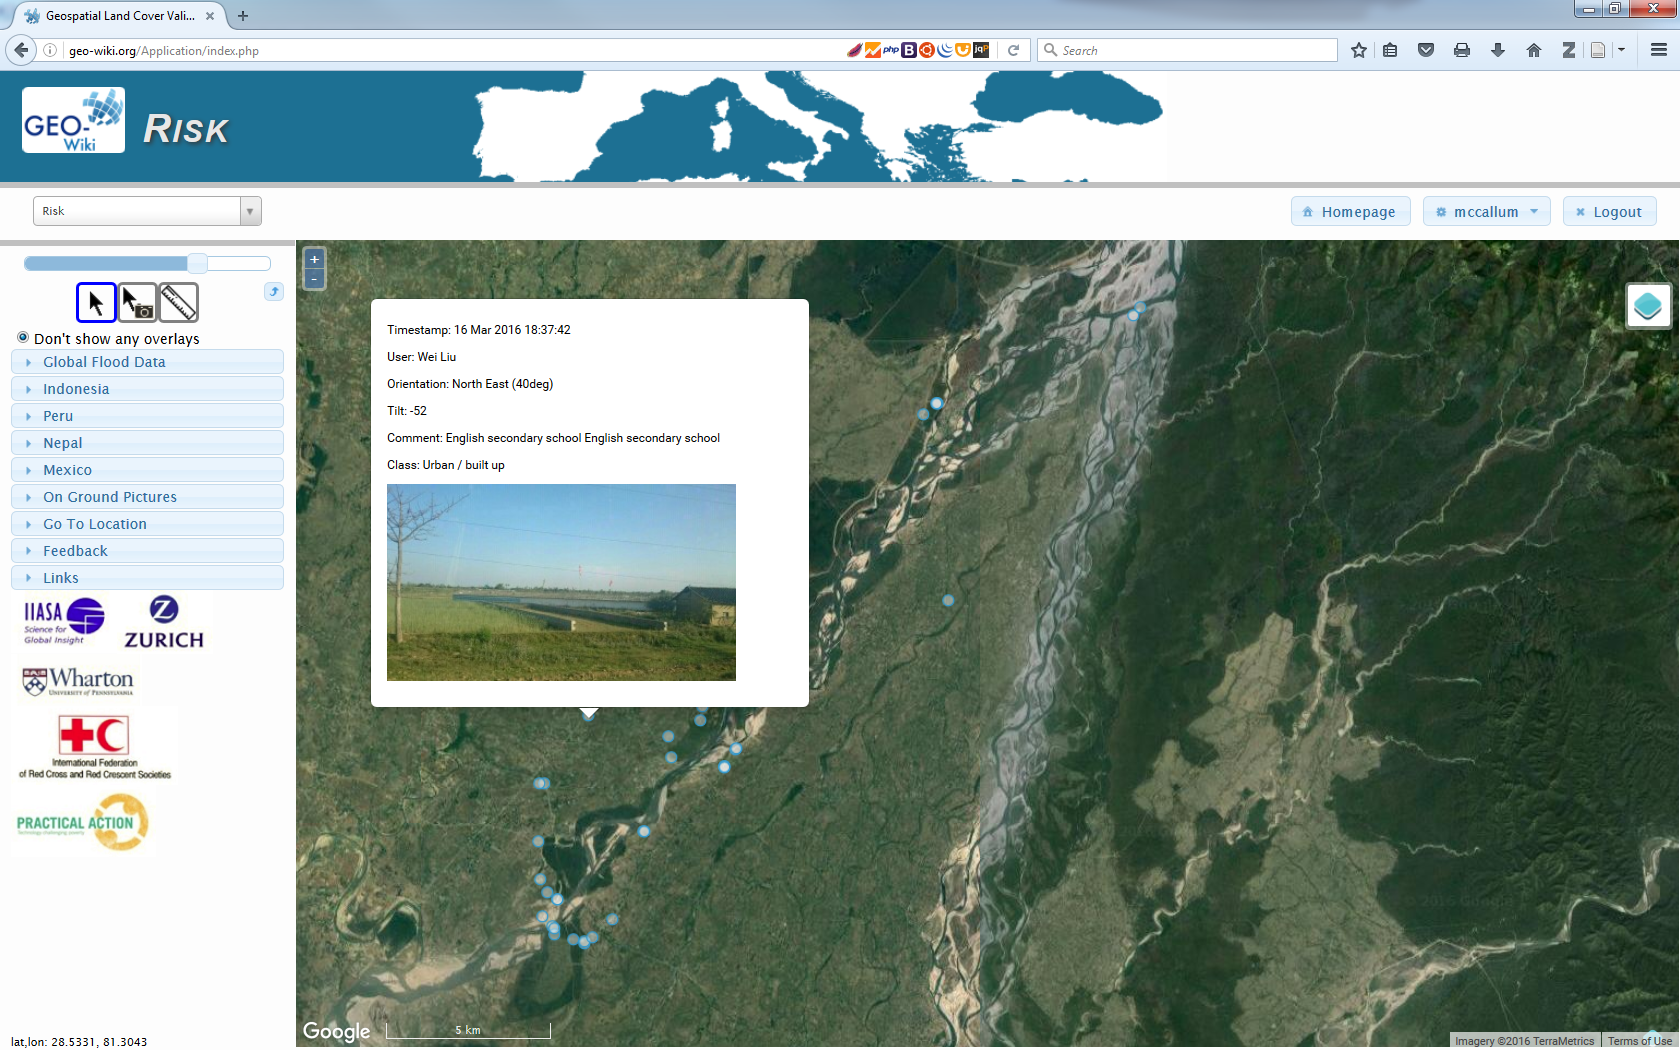
The Risk Geo-Wiki showing geo-tagged photographs overlaid upon satellite imagery across the Karnali basin, Nepal. © IIASA
With only a web browser, and a simple registration, anyone can access flood-related spatial information worldwide. Available data range from flood hazard, exposure and risk information, to biophysical and socioeconomic data. All of this information can be overlaid upon satellite imagery or OpenStreetMap, along with on-ground pictures taken with the related mobile application Geo-Wiki Pictures. You can use these data to understand the quality of available global products or to visualize the numerous local datasets provided for specific flood affected communities. People interested in flood resilience will benefit from visiting the platform and are welcome to provide additional information to fill many of the existing gaps in information.
Flood resilience and data gaps
One of the aims of the Risk Geo-Wiki is to identify and address data gaps on flood resilience and community-based disaster risk reduction. For example, there is a big disconnect between information suitable for global flood risk modelling and that necessary for community planning. Global modelers need local information with which to validate their forecasts while community planners want both detailed local information and an understanding of their communities in the wider region. The Flood Resilience Alliance is working with many interested groups to help fill this gap and at the same time help strengthen community resilience against floods and to develop and disseminate knowledge and expertise on flood resilience.
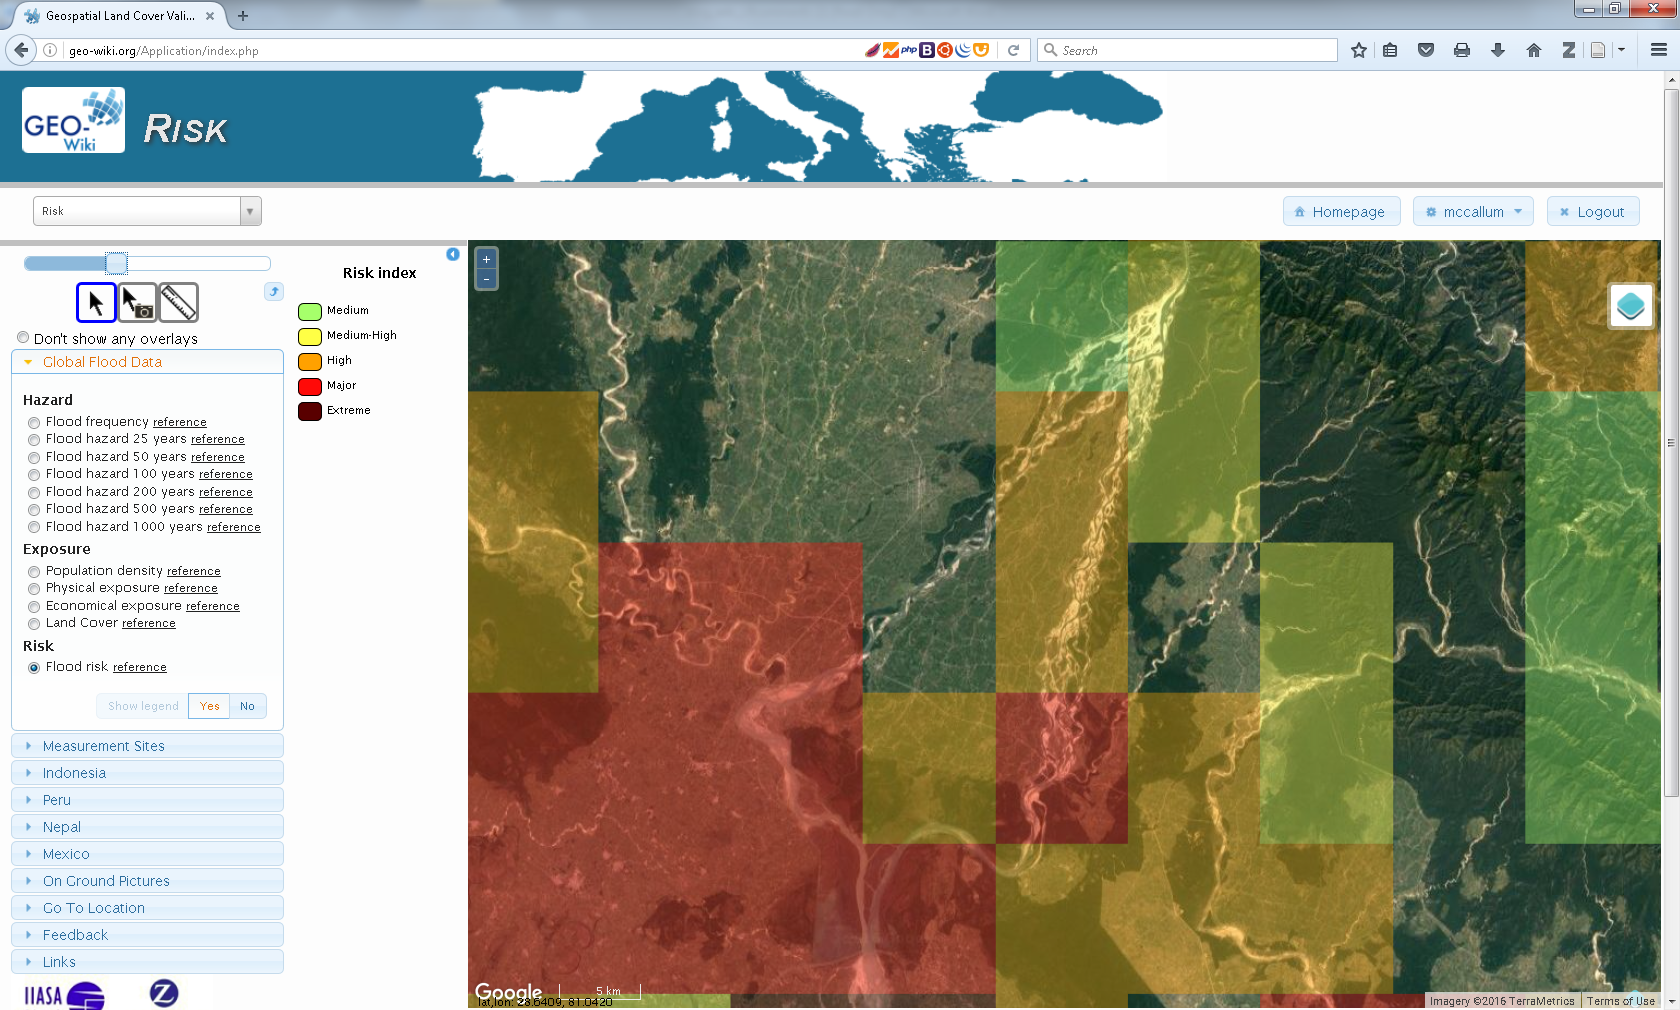
The Risk Geo-Wiki showing modelled global flood risk data overlaid at community level. While this data is suitable at the national and regional level, it is too coarse for informing community level decisions. © IIASA
Practical applications for local communities
Already, communities in Nepal, Peru, and Mexico have uploaded data to the site and are working with us on developing it further. For local communities who have uploaded spatial information to the site, it allows them to visualize their information overlaid upon satellite imagery or OpenStreetMap. Furthermore, if they have used Geo-Wiki Pictures to document efforts in their communities, these geo-tagged photos will also be available.
Community and NGO members mapping into OSM with mobile devices in the Karnali basin, Nepal. © Wei Liu, IIASA
In addition to local communities who have uploaded information, the Risk Geo-Wiki will provide important data to others interested in flood risk, including researchers, the insurance industry, NGOs, and donors. The portal provides a source of information that is both easily visualized and overlaid on satellite imagery with local images taken on the ground if available. Such a platform allows anyone interested to better understand flood events over their regions and communities of interest. It is, however, highly dependent upon the information that is made available to the platform, so we invite you to contribute. In particular if you have geographic information related to flood exposure, hazard, risk and vulnerability in the form of images or spatial data we would appreciate you getting in contact with us.
About the portal:
The Risk Geo-Wiki portal was established by the International Institute for Applied Systems Analysis (IIASA) in the context of the Flood Resilience Alliance. It was developed by the Earth Observation Systems Group within the Ecosystems Services and Management Program at IIASA.
Further information
- Risk Geo-Wiki
- Collection of geo-tagged photos with Geo-Wiki Pictures
- Mapping flood resilience in rural Nepal
- Flood Resilience Portal
- McCallum, I., Liu, W., See, L., Mechler, R., Keating, A., Hochrainer-Stigler, S., Mochizuki, J., Fritz, S., Dugar, S., Arestegui, M., Szoenyi, M., Laso Bayas, J.C., Burek, P., French, A. and Moorthy, I. (2016) Technologies to Support Community Flood Disaster Risk Reduction. International Journal of Disaster Risk Science, 7 (2). pp. 198-204.http://pure.iiasa.ac.at/13299/
This article gives the views of the author, and not the position of the Nexus blog, nor of the International Institute for Applied Systems Analysis.
Nov 10, 2016 | Risk and resilience
By Wei Liu, IIASA Risk and Resilience and Ecosystems Services and Management programs
Disasters caused by extreme weather events are on the rise. Floods in particular are increasing in frequency and severity, with reoccurring events trapping people in a vicious cycle of poverty. Information is key for communities to prepare for and respond to floods – to inform risk reduction strategies, improve land use planning, and prepare for when disaster strikes.
But, across much of the developing world, data is sparse at best for understanding the dynamics of flood risk. When and if disaster strikes, massive efforts are required in the response phase to develop or update information. After that, communities have an even greater need for data to help with recovery and reconstruction and further enhance communities’ resilience to future floods. This is particularly important for the Global South, such as the Karnali Basin in Nepal, where little information is available regarding community’s exposure and vulnerability to floods.
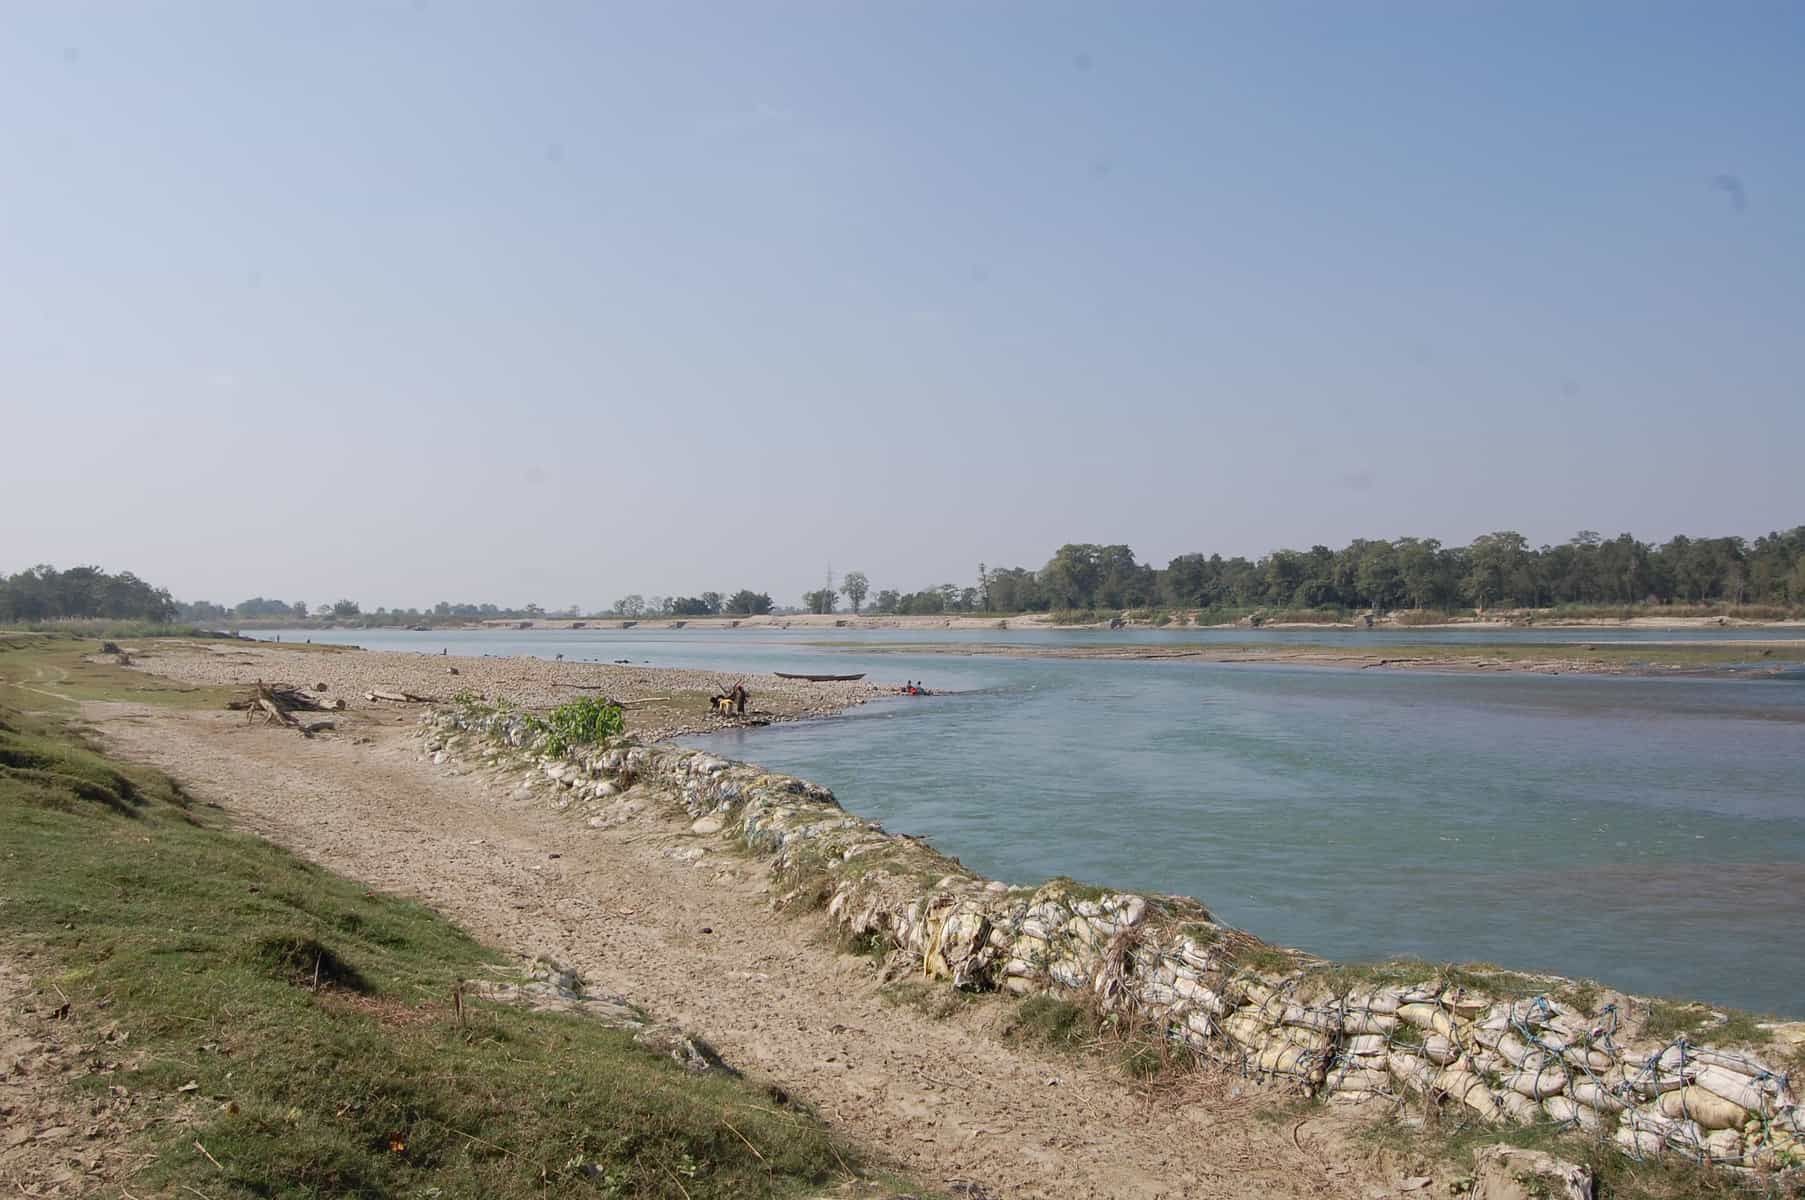
Karnali Basin in Nepal © Wei Liu | IIASA
That’s why we are working with Practical Action in the Zurich Flood Resilience Alliance to try to remedy this situation. Participatory Vulnerability and Capacity Assessment is a widely used tool to collect community level disaster risk and resilience information and to inform disaster risk reduction strategies. One of our first projects was to digitize a set of existing maps on disaster risk and community resources where the locations of, for example, rivers, houses, infrastructure and emergency shelters are usually hand-drawn by selected community members. Such maps provide critical information used by local stakeholders in designing and prioritizing among possible flood risk management options.
From hand-drawn to internet mapping
While hand-drawn maps are ideal for working in remote rural communities, they risk being damaged, lost, or simply unused. They are also more difficult to share with other stakeholders such as emergency services or merge with additional mapped information such as flood hazard. With the recent increase in internet mapping, platforms such as OpenStreetMap have made it possible for us to transfer existing maps or capture new information on a common platform in such a way that anyone with an internet connection can add, edit, and share maps. As this information is digital, it makes it easier to perform additional tasks, such as identifying households in areas of high risk or measuring the distance to the nearest emergency shelter, to support effective risk-reduction and resilience-building.
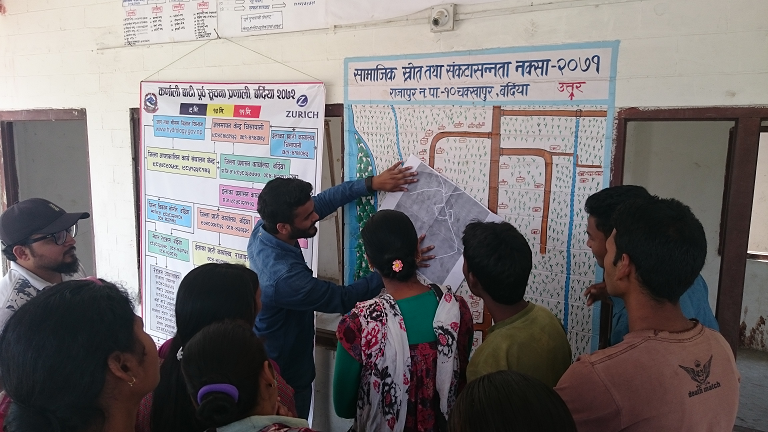
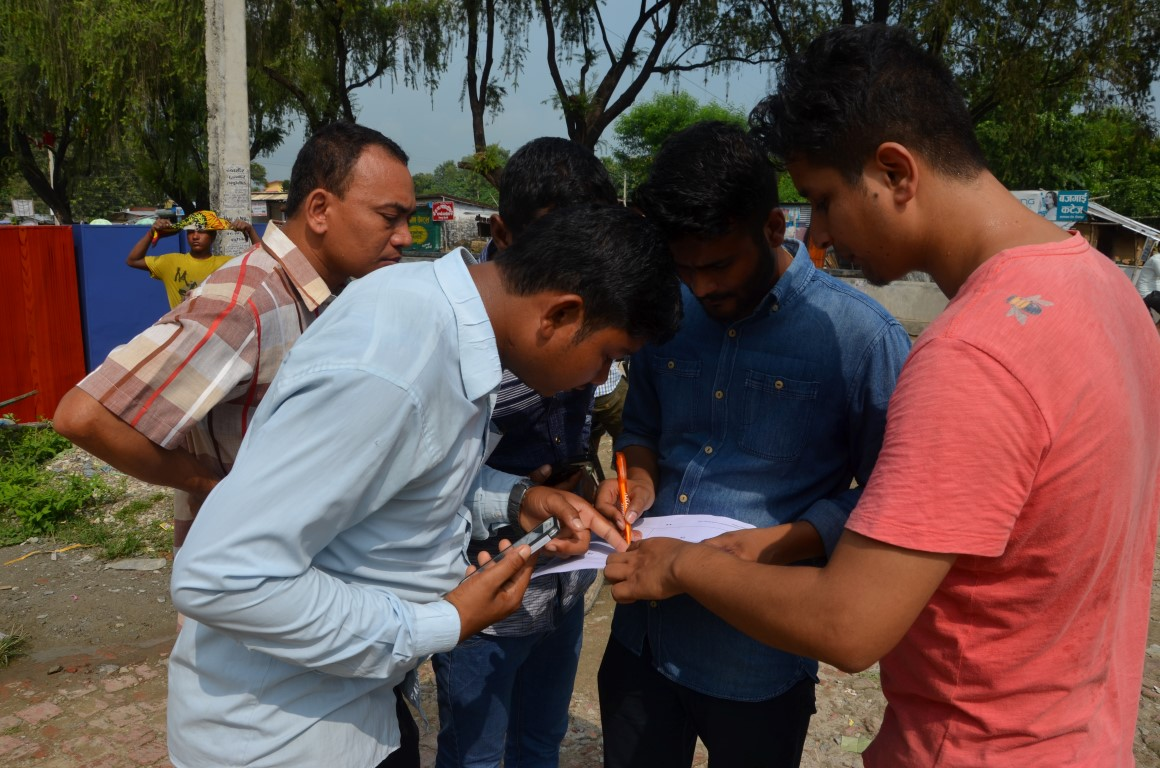
Practical Action Nepal, the Center for Social Development and Research, and community members discuss the transfer of community maps to online maps © Wei Liu | IIASA
From theory to practice
In March 2016, the Project team travelled to two Nepal communities in the Rajapur and Tikapur districts, to pilot the idea of working with a local NGO (the Center for Social Development and Research) and community members, to transfer their maps into a digital environment. The latter can easily be further edited, improved and shared within a broad range of stakeholders and potential users. Local residents in both communities were excited seeing their households and other features for the first time overlaid on a map with satellite imagery. The Center for Social Development and Research was also very enthusiastic about integrating their future community mapping activities with digital mapping, without losing the spirit of participation.
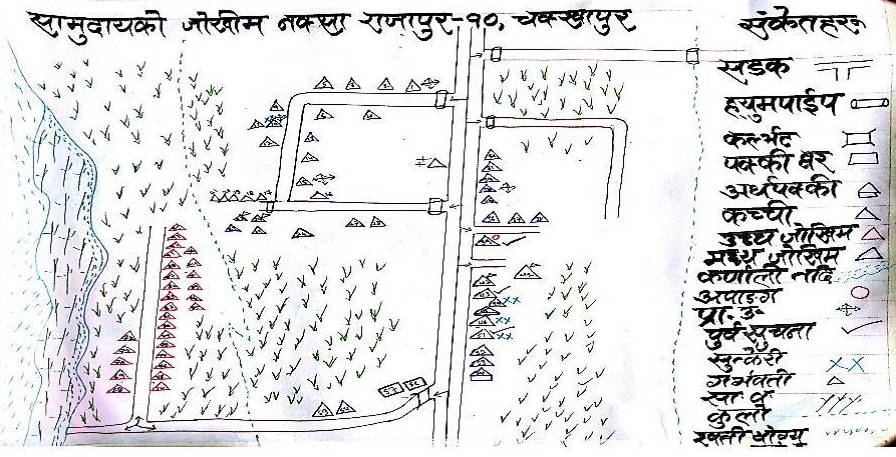
Hand drawn maps produced from community mapping exercises in Chakkhapur, Nepal © Practical Action
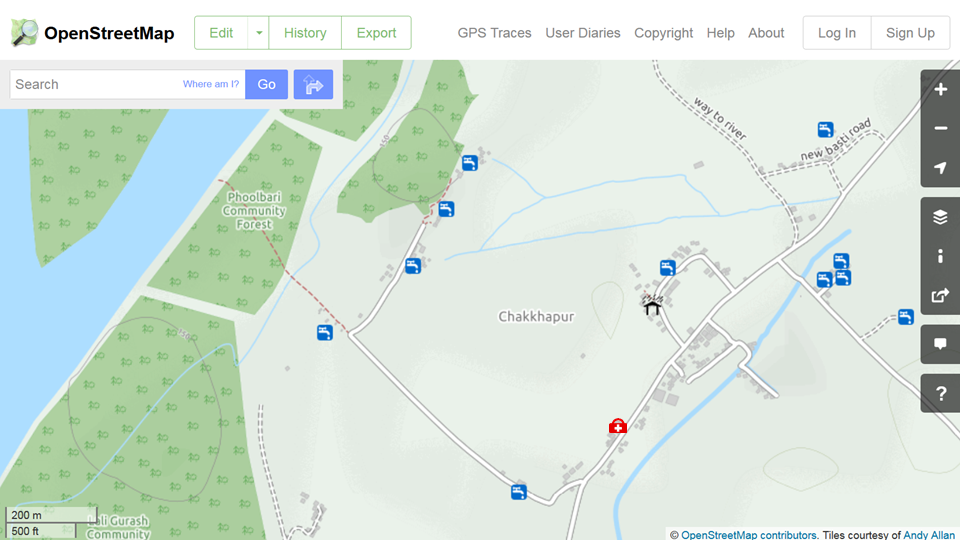
The resulting online maps in OpenStreetMap of Chakkhapur, Nepal, showing the location of drinking water, an emergency shelter and medical clinic. ©OpenStreetMap
Increasing resilience through improved information management
The first stage pilot study in the Karnali river basin confirmed the great potential of new digital technologies in providing accurate and locally relevant maps to improve flood risk assessment to support resilience building at the community level. The next step is to further engage local stakeholders. A wider partnership has been established between Practical Action, the Center for Social Development and Research, the International Institute for Applied Systems Analysis and Kathmandu Living Labs to further build local stakeholders’ capacity in mapping with digital technologies, including a training workshop for NGO staff members in September, 2016. The plan is to have more communities’ flood risk information mapped for designing more effective action plans and strategies for coping with future flood events across the Karnali river basin. A greater potential can be realized when this effort is further scaled up across the region and the results are placed into shared open online databases such as OpenStreetMap.
Further information
- Flood Resilience Portal
- Geo-Wiki Risk
- McCallum, I., Liu, W., See, L., Mechler, R., Keating, A., Hochrainer-Stigler, S., Mochizuki, J., Fritz, S., Dugar, S., Arestegui, M., Szoenyi, M., Laso Bayas, J.C., Burek, P., French, A. and Moorthy, I. (2016) Technologies to Support Community Flood Disaster Risk Reduction. International Journal of Disaster Risk Science, 7 (2). pp. 198-204. http://pure.iiasa.ac.at/13299/
Note: This article gives the views of the author, and not the position of the Nexus blog, nor of the International Institute for Applied Systems Analysis.
May 17, 2016 | Citizen Science
By Dilek Fraisl, IIASA Ecosystems Services and Management Program
In October 2015, we launched our latest game, Picture Pile. The idea is simple: look at a pair of satellite images from different years and tell us if you can see any evidence of deforestation. Thanks to the participation of many volunteers, 2.69 million pictures have already been sorted in our pile of 5 million pairs. But we still have a long way to go, and we need your help to get us there!
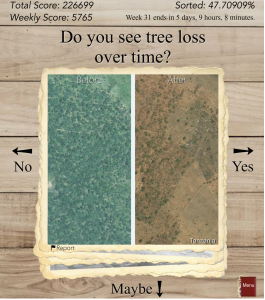
Screenshot from the game: click for more information (Image credit Tobias Sturn)
Deforestation is one of the most serious environmental problems in the world today. Forests cover a third of the land area on Earth, producing vital oxygen, habitats for a diversity of wildlife, and important ecosystem services. According to the World Wildlife Fund (WWF), some 46,000 to 58,000 square miles of forest are lost each year, which is equivalent to 48 football fields every minute. But this is a rough estimate since deforestation is very difficult to track. Reasons why are that satellite imagery can be of insufficient spatial resolution to map deforestation accurately, deforestation mostly occurs in small chunks that may not be visible from medium-resolution imagery, and very high-resolution data sets are expensive and can require big data processing capabilities, so can only be used for limited areas.
To help contribute to better mapping of deforestation, researchers in IIASA’s Earth Observation Systems (EOS) group, led by Steffen Fritz, have been working on novel projects to engage citizens in scientific data collection that can complement satellite-based traditional deforestation monitoring. One of the latest applications is Picture Pile, a game that makes use of very high-resolution satellite images spanning the last decade. Designed by Tobias Sturn, the aim is to provide data that can help researchers build a better map of deforestation. Players are provided with a pair of images that span two time periods and are then asked to answer a simple question: “Do you see tree loss over time?” After examining the image, the player drags the images to the right for “yes,” left for “no,” or down to indicate “maybe” when the deforestation is not clearly visible.
Every image is sorted multiple times by numerous independent players, in order to build confidence in the results, and also to gain an understanding of how good the players are at recognizing visible patterns of deforestation. Once enough data are collected at a single location, the images are taken out of the game and new ones are added, thereby increasing the spatial coverage of our mapped area over time. Right now we are focusing on Tanzania and Indonesia, two regions where we know there are problems with existing maps of deforestation.
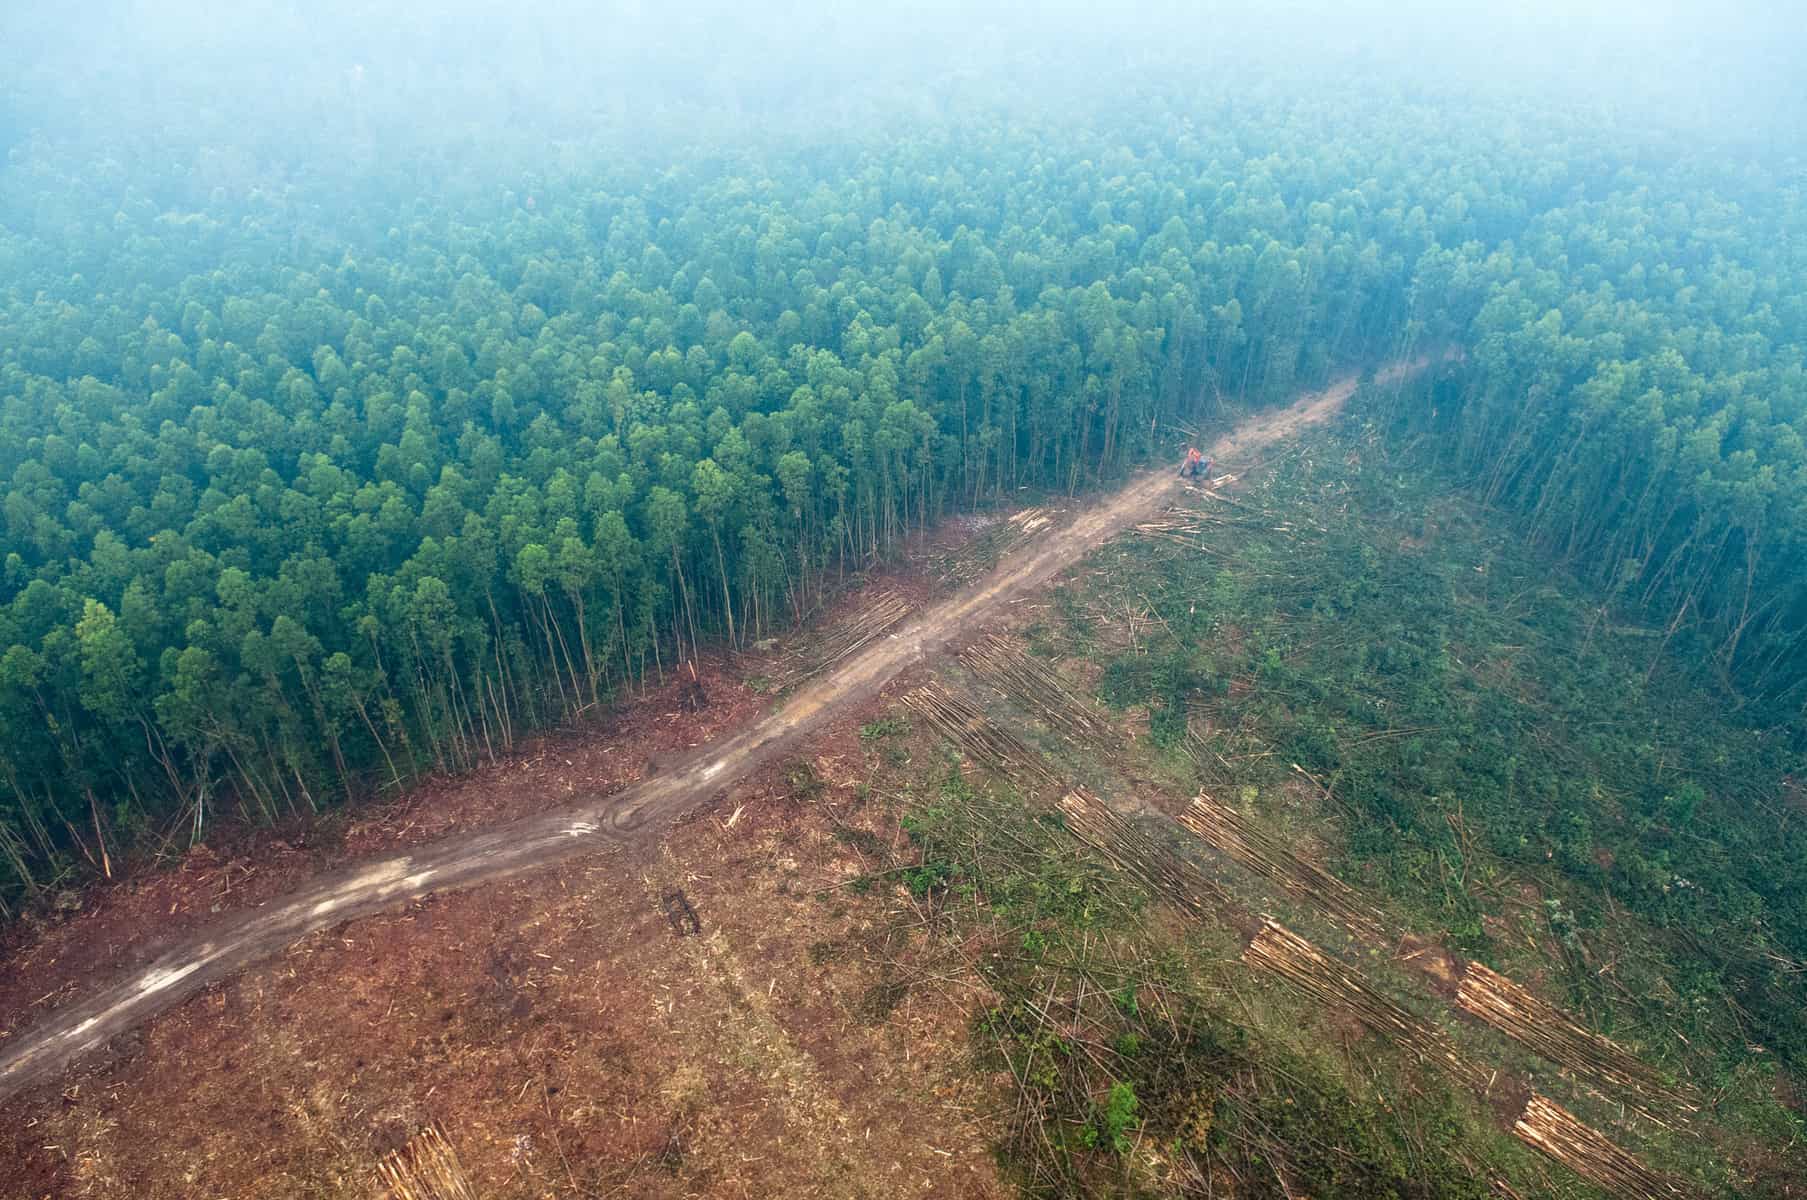
Picture Pile is focusing first on Indonesia (pictured) and Tanzania – two regions where there are problems with existing maps of deforestation. Photo (cc) Aulia Erlangga for Center for International Forestry Research (CIFOR).
Once the pile is fully sorted, the 5 million photos in the data set will be used to develop better maps of forest cover and forest loss using hybrid techniques developed by the group as well as inputs to classification algorithms. We will also use the data to validate the accuracy of existing global land cover maps. Finally, we will mine the data set to look for patterns regarding quality (for example, how many samples do we need to provide to the “crowd” before we can be confident enough to use their data in further research). In short, by integrating citizens in scientific research, Picture Pile will also help us improve the science of land cover monitoring through crowdsourcing mechanisms.
So please join in and help us get to the finish line. You can play Picture Pile in your browser or you can download the free iOS/Android app from the Apple and Google Play stores and play on your smartphone or tablet. Your contributions will help scientists like those at IIASA to tackle global problems such as deforestation and environmental degradation. At the same time you may win some great prizes: a brand new smartphone, a tablet, or a mini tablet.
More information:
Reference
Schepaschenko D, See L, Lesiv M, McCallum I, Fritz S, Salk C, Perger C, Schepaschenko M, Shvidenko A, Kovalevskyi S, Albrecht F, Kraxner F, Bun A, Maksyutov S, Sokolov A, Dürauer M, Obersteiner M. (2015) Global hybrid forest mask: synergy of remote sensing, crowd sourcing and statistics. Remote Sensing of the Environment, 162, 208-220. doi:10.1016/j.rse.2015.02.011
Note: This article gives the views of the author, and not the position of the Nexus blog, nor of the International Institute for Applied Systems Analysis.
You must be logged in to post a comment.